Reports

- Global Locations -

Headquarters

Future Market Insights, Inc.

Christiana Corporate, 200
Continental Drive, Suite 401,
Newark, Delaware - 19713,
United States

T: +1-845-579-5705

Americas

Future Market Insights, Inc.

616 Corporate Way, Suite 2-9018,
Valley Cottage, NY 10989, United States

T: +1-347-918-3531

MEA

Future Market Insights

1602-6 Jumeirah Bay X2 Tower, Plot No: JLT-PH2-X2A,
Jumeirah Lakes Towers, Dubai,
United Arab Emirates

Europe

Future Market Insights

3rd Floor, 207 Regent Street,
W1B 3HH London
United Kingdom

T: + 44 (0) 20 8123 9659
D: +44 (0) 20 3287 4268

Asia Pacific

Future Market Insights

IndiaLand Global Tech Park, Unit UG-1, Behind Grand HighStreet, Phase 1, Hinjawadi, MH, Pune – 411057, India

Mobile Clinic Market Snapshot from 2024 to 2034

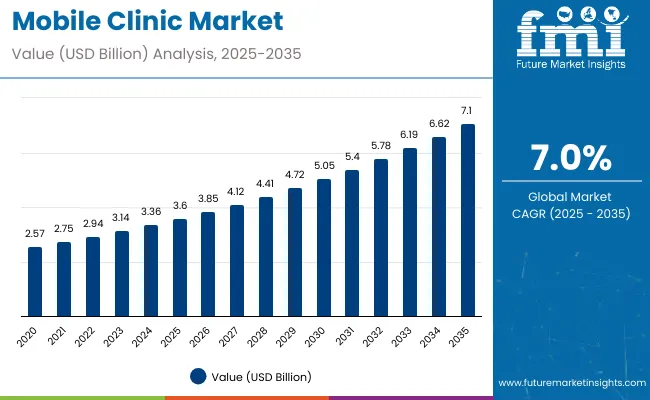
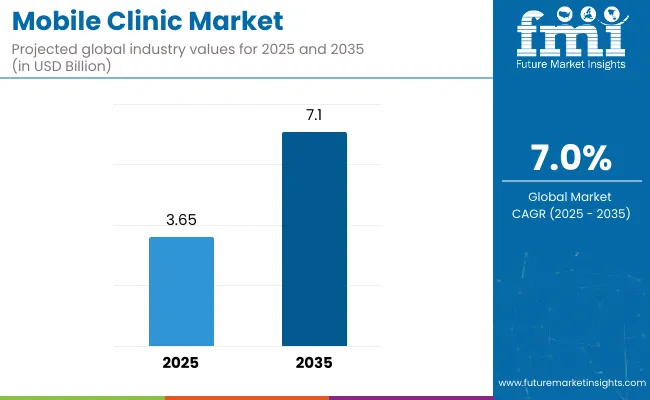
The mobile clinic market had an estimated market share worth US$ 3.1 billion in 2023, and it is predicted to reach a global market valuation of US$ 6.7 billion by 2034, expanding at a CAGR of 7% from 2024 to 2034.

Report Attribute Details
Estimated Market Value in 2023 US$ 3.1 billion
Expected Market Value in 2024 US$ 3.4 billion
Projected Forecast Value in 2034 US$ 6.7 billion
Anticipated Growth Rate from 2024 to 2034 7%

Don't pay for what you don't need

Customize your report by selecting specific countries or regions and save 30%!

Demand Analysis of Mobile Clinics

Companies can advance in the mobile clinic market by using these tactics:

  • Key enterprises may strengthen their position by using their resources and experience to develop mobile clinic networks, giving them a competitive advantage and market leadership.
  • Top companies may lead the way in mobile clinic technology, gear, and services innovation, establishing themselves as pioneers in the field and drawing in alliances, capital, and personnel.
  • They may diversify their income sources and lessen their reliance on traditional business segments by entering the mobile clinic industry. This helps to decrease risks and improve financial stability.
  • Working together in the mobile clinic space with government agencies, non-profits, and healthcare providers gives significant companies various benefits. This includes access to new markets, resource sharing, and effect amplification, all of which promote long term growth and sustainability.

Mobile Clinic Market Historical Analysis 2019 to 2023 vs. Forecast Outlook 2024 to 2034

The global demand for the mobile clinic market was estimated to reach a valuation of US$ 2,048.17 million in 2019, according to a report from Future Market Insights (FMI). From 2019 to 2023, the mobile clinic market witnessed significant growth, registering a CAGR of 10.80%.

Historical CAGR 2019 to 2023 10.80%
Forecast CAGR 2024 to 2034 7%

The market for mobile clinic is expected to grow in the future due to these factors

  • Mobile clinics provide healthcare services in underprivileged or distant communities, filling gaps in healthcare access and boosting population health.
  • During crises or catastrophes, mobile clinics can reach vulnerable people and offer on demand treatments in response to changing healthcare requirements and exigencies.
  • By eliminating the overhead expenses connected with conventional brick and mortar institutions, mobile clinics provide effective and reasonably priced healthcare alternatives.
  • Mobile clinics may do diagnostic testing, provide remote consultations, handle medical records, and have a greater impact when telemedicine and digital health technologies are integrated.
Sabyasachi Ghosh
Sabyasachi Ghosh

Principal Consultant

Talk to Analyst

Find your sweet spots for generating winning opportunities in this market.

Key Factors Driving the Mobile Clinic Market

Demand for Accessible Healthcare Services and Technological Advancements To drive Demand

Consumer demand for easily accessible healthcare services is driving the mobile clinic market. The need for mobile clinics, which address the healthcare requirements of a variety of groups, is fueled by the growing need for healthcare in underserved or distant locations as well as the difficulties in accessing regular healthcare facilities.

Technological innovations driving the growth of the mobile clinic market include telemedicine, remote monitoring devices, and mobile health apps. With the help of these advancements, mobile clinics may now provide healthcare services to underprivileged and isolated people more conveniently, effectively, and readily.

Factors that can impede the Market Growth

Regulatory Barriers and Infrastructural Challenges to Restrict Market Growth

Regulatory obstacles and licensing requirements are one issue limiting the expansion of the mobile clinic market. Mobile clinic operators face difficulties in navigating legal frameworks and obtaining appropriate licenses due to complex rules and licensing processes that differ between countries. This can impede market development and restrict the supply of healthcare services in certain locations.

In rural or poor areas, infrastructural issues are another factor impeding market expansion. The deployment and operation of mobile clinics are hampered by inadequate transportation networks, unstable power supplies, and restricted access to communication technology. It is challenging to successfully provide healthcare services to underserved communities.

Get the data you need at a Fraction of the cost

Personalize your report by choosing insights you need
and save 40%!

Comparative View of Adjacent Markets

In this section, the analysis will be drawn among three relevant markets. These are the mobile clinic market, mobile gamma cameras market, and telemedicine equipment market.

Several common forces promote the markets for telemedicine equipment, mobile gamma cameras, and mobile clinics. There is an increasing need for affordable healthcare services globally, which has led to the development and acceptance of innovative methods to assist underprivileged groups. Technology has completely changed the way that healthcare is delivered by enabling diagnostic imaging and distant consultations via telemedicine and mobile platforms.

The demand for quick and effective medical treatment is being met by the growing popularity of remote healthcare solutions. These markets are pushing the development of mobile clinics and telemedicine technology to enhance healthcare outcomes globally by bridging gaps in healthcare access, especially in rural or distant locations.

Mobile Clinic Market:

Market Name Mobile Clinic Market
CAGR from 2024 to 2034 7%
Growth Factor
  • The market for mobile clinics is expanding due to the growing demand for telemedicine, which makes telehealth technology equipped units necessary for the delivery of healthcare remotely.
Future Opportunities
  • By offering convenient medical services and enhancing health outcomes for individuals with limited access to regular healthcare facilities, mobile clinics may take advantage of underdeveloped locations.

Mobile Gamma Cameras Market:

Market Name Mobile Gamma Cameras Market
CAGR from 2024 to 2034 4.2%
Growth Factor
  • Mobile gamma cameras are ideal for point of care imaging, allowing healthcare personnel to perform diagnostic procedures at the patient's bedside or in remote places.
Future Opportunities
  • In distant and rural healthcare settings, where access to advanced imaging equipment may be limited, mobile gamma cameras are very useful.

Telemedicine Equipment Market:

Market Name Telemedicine Equipment Market
CAGR from 2024 to 2034 17.3%
Growth Factor Technologies that are being used to help collect data, reassure the public, treat patients, and make diagnosis include chatbots and telemedicine.
Future Opportunities An increase in the need for radiological services as a result of the increased frequency of long term conditions including orthopedic injuries and congestive heart failure

Category wise Insights

This section focuses on providing detailed analysis of two particular market segments for the mobile clinic, the dominant clinic and the significant design layout. The two main segments discussed below are the OPD and single layout room.

OPD Clinics to Gain Prominence in the Mobile Clinic Market in 2024

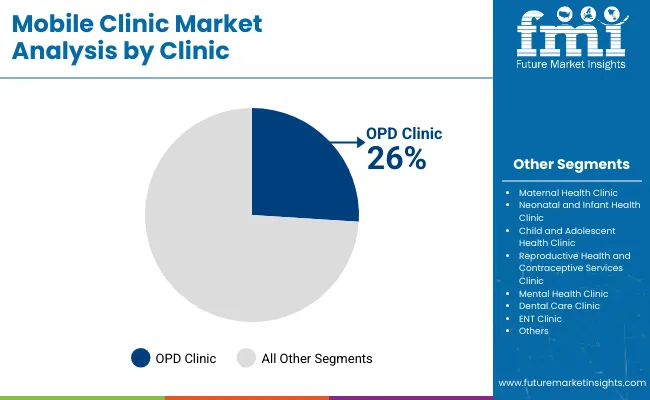
Clinic Type OPD
Market Share in 2024 26.3%

In 2024, the OPD mobile clinic is likely to gain a market share of 26.30%. OPD clinics are expected to gain momentum in the mobile clinic industry due to their capacity to deliver critical outpatient treatments directly to communities.

OPD clinics provide practical and affordable answers in response to the growing need for easily accessible healthcare and the growing emphasis on preventative treatment. These mobile clinics remove barriers to healthcare access, especially in underserved or distant locations, by bringing medical experts and services closer to patients. This has led to their popularity and adoption in the mobile healthcare environment.

Secondary Technology to Gain Traction in the Mobile Clinic Market

Design Layout Single Layout Room
Market Share in 2024 78.90%

In 2024, the single layout room segment is anticipated to acquire 78.90% market share. The efficiency and adaptability of the single layout room will probably help it become more popular in the mobile clinic market. Its elegant and compact form makes the most use of available space and creates a comfortable atmosphere for a range of medical services.

This arrangement may be easily modified to meet a variety of healthcare requirements, from consultations to simple operations, improving patient comfort and healthcare professional productivity. Its ease of use and practicality make it a desirable choice for mobile clinics looking to efficiently utilize available space and resources.

Region wise Analysis

This section will go into detail on the mobile clinic markets in a few key countries, including the United States, the United Kingdom, Spain, India, and Thailand. This part will focus on the key factors that are driving up demand in these countries for the mobile clinic.

Countries CAGR from 2024 to 2034
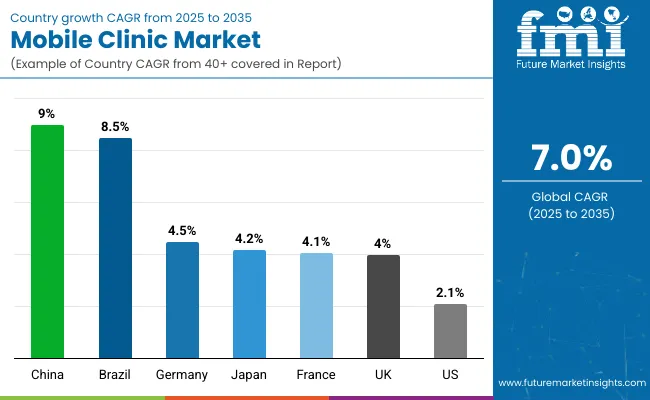
The United States 2.1%
The United Kingdom 3.80%
Spain 4.6%
India 4.6%
Thailand 5.5%

Healthcare Deserts and Disaster Management Groups in the United States to Accelerate Demand

The United States mobile clinic ecosystem is anticipated to gain a CAGR of 2.1% through 2034. Factors that are bolstering the growth are:

  • Mobile clinics serve to solve healthcare deserts, especially in rural or distant places where standard healthcare services are limited. Mobile clinics guarantee that locals have access to necessary healthcare services without requiring lengthy travel by delivering medical treatments straight to these underprivileged regions.
  • Mobile clinics respond quickly to disaster stricken areas to provide essential healthcare services to impacted communities. They also give rapid medical care during crises in the United States.

Healthcare across Underserved Communities in the United Kingdom to Boost Demand

The mobile clinic market in the United Kingdom is expected to expand with a 3.80% CAGR through 2034. The factors pushing the growth are:

  • In the United Kingdom, mobile clinics are essential for improving healthcare accessible for marginalized populations, including impoverished urban neighborhoods and rural locations.
  • Mobile clinics guarantee that people have easy access to necessary healthcare services nearer to their homes by providing medical services right to these communities.
  • This program improves overall health outcomes for vulnerable groups by addressing healthcare access gaps in addition to geographical limitations.

Event and Festival Healthcare in Spain to Bolster Growth

The mobile clinic ecosystem in Spain is anticipated to develop with a 4.6% CAGR from 2024 to 2034. The drivers behind this growth are:

  • In Spain, mobile clinics with on-site medical services have a special function during festivals and events.
  • These clinics are essential for large scale events around the nation because they guarantee timely medical assistance during crises, improving event safety and attendee pleasure.

High Quality Healthcare Services across Rural Areas in India to Accelerate Demand

The mobile clinic industry in India is anticipated to reach a 4.6% CAGR from 2024 to 2034. The drivers propelling growth forward are:

  • Mobile clinics let underprivileged communities have better access to medical treatments by addressing the issue of healthcare accessibility in rural and distant places where regular healthcare infrastructure is absent.
  • By offering on site medical consultations, diagnostics, and preventative treatment, mobile clinics ease the stress on overworked healthcare institutions while cutting wait times and increasing the effectiveness of healthcare delivery.

Tourist Healthcare Services in Thailand to Enhance Market Growth

The mobile clinic ecosystem in Thailand is likely to evolve with a 5.5% CAGR during the forecast period. The factors bolstering the growth are:

  • Thailand's booming tourism sector increases demand for mobile clinics, which provide convenient healthcare services to visitors at well known locations, hotels, or resorts, enhancing the country's image as a traveler friendly destination.
  • By making guests feel safe and well cared for during their trip, this improves the entire travel experience and encourages return business and favorable word of mouth referrals.

Market Competition

Leading companies in the mobile clinic market are experimenting by utilizing modern technology to improve the provision of healthcare. By creating mobile units with telemedicine capabilities, diagnostic instruments, and electronic health record systems, they put accessibility first.

These companies also put a lot of emphasis on customisation, building mobile clinics with particular target populations and healthcare requirements in mind. In order to maximize service delivery and solve particular healthcare concerns in various areas, they also place a strong emphasis on community participation. To this end, they collaborate with local healthcare providers and groups.

The key players in this market include:

  • ADI Mobile Health
  • LifeLine Mobile, Inc.
  • Medical Coaches
  • Matthews Specialty Vehicles
  • Odulair LLC.
  • Johnson Medical International Sdn Bhd
  • MinFound Medical Systems Co. Ltd
  • CVR Industries USA Inc.
  • EMS Mobile Systems Inc.
  • Farber Specialty Vehicles

Significant advancements in the mobile clinic market are being made by key market participants, and their offerings include:

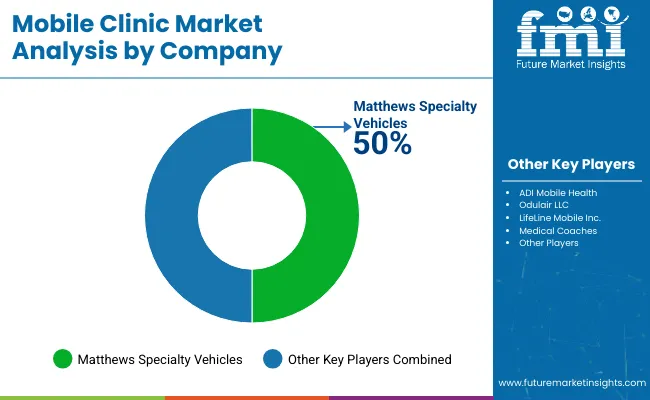
  • In 2023, Matthews Specialty Vehicles, Inc. signed a Memorandum of Understanding (MOU) with Phoenix Motor Inc., a leading manufacturer of all electric medium duty trucks. Their combined goal is to construct and operate Class 4 electric specialized vehicles for a range of commercial uses, such as shuttles, bloodmobiles, bookmobiles, schools, public safety, and mobile healthcare.
  • The long term objectives of both businesses will be aided by this collaboration, which will cover product development, production, assembly, maintenance, sales, marketing, and certification in relation to Phoenix's commercial electric vehicles, including the company's upcoming Gen 4 cars and Gen 5 vehicles with specially designed chassis.

Key Coverage in the Mobile Clinic Market Report

  • Mobile Clinics Market Size & Share Analysis
  • USA Mobile Clinics Market
  • Mobile Healthcare Clinic Market
  • Mobile Medical Unit Market
  • Mobile Clinics Market Application

Report Scope

Report Attribute Details
Growth Rate CAGR of 7% from 2024 to 2034
Market value in 2024 US$ 3.4 billion
Market value in 2034 US$ 6.7 billion
Base Year for Estimation 2023
Historical Data 2019 to 2023
Forecast Period 2024 to 2034
Quantitative Units US$ billion for value
Report Coverage Revenue Forecast, Company Ranking, Competitive Landscape, Growth Factors, Trends, and Pricing Analysis
Segments Covered
  • Clinics
  • Design Layout
  • Vehicle
  • Region
Region Covered
  • North America
  • Latin America
  • Western Europe
  • Eastern Europe
  • South Asia and Pacific
  • East Asia
  • The Middle East & Africa
Countries Profiled
  • United States
  • Canada
  • Brazil
  • Mexico
  • Germany
  • United Kingdom
  • France
  • Spain
  • Italy
  • Poland
  • Russia
  • Czech Republic
  • Romania
  • India
  • Bangladesh
  • Australia
  • New Zealand
  • China
  • Japan
  • South Korea
  • GCC Countries
  • South Africa
  • Israel
Key Companies Profiled
  • ADI Mobile Health
  • LifeLine Mobile Inc.
  • Medical Coaches
  • Matthews Specialty Vehicles
  • Odulair LLC.
  • Johnson Medical International Sdn Bhd
  • MinFound Medical Systems Co. Ltd
  • CVR Industries USA Inc.
  • EMS Mobile Systems Inc.
  • Farber Specialty Vehicles
Customization Scope Available on Request

Key Segments Profiled in the Mobile Clinic Market

By Clinics:

  • Maternal Health
  • Neonatal and Infant Health
  • Child and Adolescent Health
  • Reproductive Health and Contraceptive Services
  • Mental Health
  • Dental Care
  • ENT
  • Geriatric Care
  • OPD
  • Diagnostic/Screening
  • Emergency Care

By Design Layout:

  • Single Exam Room
  • Double Exam Room
  • Triple Exam Room

By Vehicle:

  • Mobile Medical Vans
  • Mobile Medical Bus
  • Mobile Medical Shipping Containers

By Region:

  • North America
  • Latin America
  • Western Europe
  • Eastern Europe
  • South Asia and Pacific
  • East Asia
  • Middle East & Africa

Frequently Asked Questions

What is the anticipated growth rate of the mobile clinic market from 2024 to 2034?

The mobile clinic market is expected to garner a 7% CAGR from 2024 to 2034.

What will be the global market outlook for mobile clinic through 2024?

By 2024, the global mobile clinic market is likely to gain US$ 3.4 billion.

What is the expected global market valuation for mobile clinic by 2034?

By 2034, the mobile clinic market valuation is likely to reach US$ 6.7 billion.

How will the demand for mobile clinic develop in the United States?

The mobile clinic industry in the United States is likely to garner a 2.1% CAGR during the forecast period.

Which type of clinic is likely to gain traction in the mobile clinic market?

The OPD clinic is likely to gain traction in the global mobile clinic market with a 26.3% market share in 2024.

Which design layout will dominantly be used in the mobile clinic market?

The single layout room is anticipated to be dominantly used, with an expected 78.90% market share in 2024.

Table of Content

1. Executive Summary

    1.1. Global Market Outlook

    1.2. Demand-side Trends

    1.3. Supply-side Trends

    1.4. Technology Roadmap Analysis

    1.5. Analysis and Recommendations

2. Market Overview

    2.1. Market Coverage / Taxonomy

    2.2. Market Definition / Scope / Limitations

3. Market Background

    3.1. Market Dynamics

        3.1.1. Drivers

        3.1.2. Restraints

        3.1.3. Opportunity

        3.1.4. Trends

    3.2. Scenario Forecast

        3.2.1. Demand in Optimistic Scenario

        3.2.2. Demand in Likely Scenario

        3.2.3. Demand in Conservative Scenario

    3.3. Opportunity Map Analysis

    3.4. Investment Feasibility Matrix

    3.5. PESTLE and Porter’s Analysis

    3.6. Regulatory Landscape

        3.6.1. By Key Regions

        3.6.2. By Key Countries

    3.7. Regional Parent Market Outlook

4. Global Market Analysis 2019 to 2023 and Forecast, 2024 to 2034

    4.1. Historical Market Size Value (US$ Million) Analysis, 2019 to 2023

    4.2. Current and Future Market Size Value (US$ Million) Projections, 2024 to 2034

        4.2.1. Y-o-Y Growth Trend Analysis

        4.2.2. Absolute $ Opportunity Analysis

5. Global Market Analysis 2019 to 2023 and Forecast 2024 to 2034, By Clinic

    5.1. Introduction / Key Findings

    5.2. Historical Market Size Value (US$ Million) Analysis By Clinic, 2019 to 2023

    5.3. Current and Future Market Size Value (US$ Million) Analysis and Forecast By Clinic, 2024 to 2034

        5.3.1. Maternal Health Clinic

        5.3.2. Neonatal and Infant Health Clinic

        5.3.3. Child and Adolescent Health Clinic

        5.3.4. Reproductive Health and Contraceptive Services Clinic

        5.3.5. Mental Health Clinic

        5.3.6. Dental Care Clinic

        5.3.7. ENT Clinic

        5.3.8. Geriatric Care Clinic

        5.3.9. OPD Clinic

        5.3.10. Diagnostic/Screening Clinic

        5.3.11. Emergency Care Clinic

    5.4. Y-o-Y Growth Trend Analysis By Clinic, 2019 to 2023

    5.5. Absolute $ Opportunity Analysis By Clinic, 2024 to 2034

6. Global Market Analysis 2019 to 2023 and Forecast 2024 to 2034, By Design Layout

    6.1. Introduction / Key Findings

    6.2. Historical Market Size Value (US$ Million) Analysis By Design Layout, 2019 to 2023

    6.3. Current and Future Market Size Value (US$ Million) Analysis and Forecast By Design Layout, 2024 to 2034

        6.3.1. Single Exam Room

        6.3.2. Double Exam Room

        6.3.3. Triple Exam Room

    6.4. Y-o-Y Growth Trend Analysis By Design Layout, 2019 to 2023

    6.5. Absolute $ Opportunity Analysis By Design Layout, 2024 to 2034

7. Global Market Analysis 2019 to 2023 and Forecast 2024 to 2034, By Vehicle 

    7.1. Introduction / Key Findings

    7.2. Historical Market Size Value (US$ Million) Analysis By Vehicle, 2019 to 2023

    7.3. Current and Future Market Size Value (US$ Million) Analysis and Forecast By Vehicle, 2024 to 2034

        7.3.1. Mobile Medical Vans

        7.3.2. Mobile Medical Bus

    7.4. Y-o-Y Growth Trend Analysis By Vehicle, 2019 to 2023

    7.5. Absolute $ Opportunity Analysis By Vehicle, 2024 to 2034

8. Global Market Analysis 2019 to 2023 and Forecast 2024 to 2034, By Region

    8.1. Introduction

    8.2. Historical Market Size Value (US$ Million) Analysis By Region, 2019 to 2023

    8.3. Current Market Size Value (US$ Million) Analysis and Forecast By Region, 2024 to 2034

        8.3.1. North America

        8.3.2. Latin America

        8.3.3. Western Europe

        8.3.4. Eastern Europe

        8.3.5. South Asia and Pacific

        8.3.6. East Asia

        8.3.7. Middle East and Africa

    8.4. Market Attractiveness Analysis By Region

9. North America Market Analysis 2019 to 2023 and Forecast 2024 to 2034, By Country

    9.1. Historical Market Size Value (US$ Million) Trend Analysis By Market Taxonomy, 2019 to 2023

    9.2. Market Size Value (US$ Million) Forecast By Market Taxonomy, 2024 to 2034

        9.2.1. By Country

            9.2.1.1. USA

            9.2.1.2. Canada

        9.2.2. By Clinic

        9.2.3. By Design Layout

        9.2.4. By Vehicle

    9.3. Market Attractiveness Analysis

        9.3.1. By Country

        9.3.2. By Clinic

        9.3.3. By Design Layout

        9.3.4. By Vehicle

    9.4. Key Takeaways

10. Latin America Market Analysis 2019 to 2023 and Forecast 2024 to 2034, By Country

    10.1. Historical Market Size Value (US$ Million) Trend Analysis By Market Taxonomy, 2019 to 2023

    10.2. Market Size Value (US$ Million) Forecast By Market Taxonomy, 2024 to 2034

        10.2.1. By Country

            10.2.1.1. Brazil

            10.2.1.2. Mexico

            10.2.1.3. Rest of Latin America

        10.2.2. By Clinic

        10.2.3. By Design Layout

        10.2.4. By Vehicle

    10.3. Market Attractiveness Analysis

        10.3.1. By Country

        10.3.2. By Clinic

        10.3.3. By Design Layout

        10.3.4. By Vehicle

    10.4. Key Takeaways

11. Western Europe Market Analysis 2019 to 2023 and Forecast 2024 to 2034, By Country

    11.1. Historical Market Size Value (US$ Million) Trend Analysis By Market Taxonomy, 2019 to 2023

    11.2. Market Size Value (US$ Million) Forecast By Market Taxonomy, 2024 to 2034

        11.2.1. By Country

            11.2.1.1. Germany

            11.2.1.2. UK

            11.2.1.3. France

            11.2.1.4. Spain

            11.2.1.5. Italy

            11.2.1.6. Rest of Western Europe

        11.2.2. By Clinic

        11.2.3. By Design Layout

        11.2.4. By Vehicle

    11.3. Market Attractiveness Analysis

        11.3.1. By Country

        11.3.2. By Clinic

        11.3.3. By Design Layout

        11.3.4. By Vehicle

    11.4. Key Takeaways

12. Eastern Europe Market Analysis 2019 to 2023 and Forecast 2024 to 2034, By Country

    12.1. Historical Market Size Value (US$ Million) Trend Analysis By Market Taxonomy, 2019 to 2023

    12.2. Market Size Value (US$ Million) Forecast By Market Taxonomy, 2024 to 2034

        12.2.1. By Country

            12.2.1.1. Poland

            12.2.1.2. Russia

            12.2.1.3. Czech Republic

            12.2.1.4. Romania

            12.2.1.5. Rest of Eastern Europe

        12.2.2. By Clinic

        12.2.3. By Design Layout

        12.2.4. By Vehicle

    12.3. Market Attractiveness Analysis

        12.3.1. By Country

        12.3.2. By Clinic

        12.3.3. By Design Layout

        12.3.4. By Vehicle

    12.4. Key Takeaways

13. South Asia and Pacific Market Analysis 2019 to 2023 and Forecast 2024 to 2034, By Country

    13.1. Historical Market Size Value (US$ Million) Trend Analysis By Market Taxonomy, 2019 to 2023

    13.2. Market Size Value (US$ Million) Forecast By Market Taxonomy, 2024 to 2034

        13.2.1. By Country

            13.2.1.1. India

            13.2.1.2. Bangladesh

            13.2.1.3. Australia

            13.2.1.4. New Zealand

            13.2.1.5. Rest of South Asia and Pacific

        13.2.2. By Clinic

        13.2.3. By Design Layout

        13.2.4. By Vehicle

    13.3. Market Attractiveness Analysis

        13.3.1. By Country

        13.3.2. By Clinic

        13.3.3. By Design Layout

        13.3.4. By Vehicle

    13.4. Key Takeaways

14. East Asia Market Analysis 2019 to 2023 and Forecast 2024 to 2034, By Country

    14.1. Historical Market Size Value (US$ Million) Trend Analysis By Market Taxonomy, 2019 to 2023

    14.2. Market Size Value (US$ Million) Forecast By Market Taxonomy, 2024 to 2034

        14.2.1. By Country

            14.2.1.1. China

            14.2.1.2. Japan

            14.2.1.3. South Korea

        14.2.2. By Clinic

        14.2.3. By Design Layout

        14.2.4. By Vehicle

    14.3. Market Attractiveness Analysis

        14.3.1. By Country

        14.3.2. By Clinic

        14.3.3. By Design Layout

        14.3.4. By Vehicle

    14.4. Key Takeaways

15. Middle East and Africa Market Analysis 2019 to 2023 and Forecast 2024 to 2034, By Country

    15.1. Historical Market Size Value (US$ Million) Trend Analysis By Market Taxonomy, 2019 to 2023

    15.2. Market Size Value (US$ Million) Forecast By Market Taxonomy, 2024 to 2034

        15.2.1. By Country

            15.2.1.1. GCC Countries

            15.2.1.2. South Africa

            15.2.1.3. Israel

            15.2.1.4. Rest of MEA

        15.2.2. By Clinic

        15.2.3. By Design Layout

        15.2.4. By Vehicle

    15.3. Market Attractiveness Analysis

        15.3.1. By Country

        15.3.2. By Clinic

        15.3.3. By Design Layout

        15.3.4. By Vehicle

    15.4. Key Takeaways

16. Key Countries Market Analysis

    16.1. USA

        16.1.1. Market Share Analysis, 2023

            16.1.1.1. By Clinic

            16.1.1.2. By Design Layout

            16.1.1.3. By Vehicle

    16.2. Canada

        16.2.1. Market Share Analysis, 2023

            16.2.1.1. By Clinic

            16.2.1.2. By Design Layout

            16.2.1.3. By Vehicle

    16.3. Brazil

        16.3.1. Market Share Analysis, 2023

            16.3.1.1. By Clinic

            16.3.1.2. By Design Layout

            16.3.1.3. By Vehicle

    16.4. Mexico

        16.4.1. Market Share Analysis, 2023

            16.4.1.1. By Clinic

            16.4.1.2. By Design Layout

            16.4.1.3. By Vehicle

    16.5. Germany

        16.5.1. Market Share Analysis, 2023

            16.5.1.1. By Clinic

            16.5.1.2. By Design Layout

            16.5.1.3. By Vehicle

    16.6. UK

        16.6.1. Market Share Analysis, 2023

            16.6.1.1. By Clinic

            16.6.1.2. By Design Layout

            16.6.1.3. By Vehicle

    16.7. France

        16.7.1. Market Share Analysis, 2023

            16.7.1.1. By Clinic

            16.7.1.2. By Design Layout

            16.7.1.3. By Vehicle

    16.8. Spain

        16.8.1. Market Share Analysis, 2023

            16.8.1.1. By Clinic

            16.8.1.2. By Design Layout

            16.8.1.3. By Vehicle

    16.9. Italy

        16.9.1. Market Share Analysis, 2023

            16.9.1.1. By Clinic

            16.9.1.2. By Design Layout

            16.9.1.3. By Vehicle

    16.10. Poland

        16.10.1. Market Share Analysis, 2023

            16.10.1.1. By Clinic

            16.10.1.2. By Design Layout

            16.10.1.3. By Vehicle

    16.11. Russia

        16.11.1. Market Share Analysis, 2023

            16.11.1.1. By Clinic

            16.11.1.2. By Design Layout

            16.11.1.3. By Vehicle

    16.12. Czech Republic

        16.12.1. Market Share Analysis, 2023

            16.12.1.1. By Clinic

            16.12.1.2. By Design Layout

            16.12.1.3. By Vehicle

    16.13. Romania

        16.13.1. Market Share Analysis, 2023

            16.13.1.1. By Clinic

            16.13.1.2. By Design Layout

            16.13.1.3. By Vehicle

    16.14. India

        16.14.1. Market Share Analysis, 2023

            16.14.1.1. By Clinic

            16.14.1.2. By Design Layout

            16.14.1.3. By Vehicle

    16.15. Bangladesh

        16.15.1. Market Share Analysis, 2023

            16.15.1.1. By Clinic

            16.15.1.2. By Design Layout

            16.15.1.3. By Vehicle

    16.16. Australia

        16.16.1. Market Share Analysis, 2023

            16.16.1.1. By Clinic

            16.16.1.2. By Design Layout

            16.16.1.3. By Vehicle

    16.17. New Zealand

        16.17.1. Market Share Analysis, 2023

            16.17.1.1. By Clinic

            16.17.1.2. By Design Layout

            16.17.1.3. By Vehicle

    16.18. China

        16.18.1. Market Share Analysis, 2023

            16.18.1.1. By Clinic

            16.18.1.2. By Design Layout

            16.18.1.3. By Vehicle

    16.19. Japan

        16.19.1. Market Share Analysis, 2023

            16.19.1.1. By Clinic

            16.19.1.2. By Design Layout

            16.19.1.3. By Vehicle

    16.20. South Korea

        16.20.1. Market Share Analysis, 2023

            16.20.1.1. By Clinic

            16.20.1.2. By Design Layout

            16.20.1.3. By Vehicle

    16.21. GCC Countries

        16.21.1. Market Share Analysis, 2023

            16.21.1.1. By Clinic

            16.21.1.2. By Design Layout

            16.21.1.3. By Vehicle

    16.22. South Africa

        16.22.1. Market Share Analysis, 2023

            16.22.1.1. By Clinic

            16.22.1.2. By Design Layout

            16.22.1.3. By Vehicle

    16.23. Israel

        16.23.1. Market Share Analysis, 2023

            16.23.1.1. By Clinic

            16.23.1.2. By Design Layout

            16.23.1.3. By Vehicle

17. Market Structure Analysis

    17.1. Competition Dashboard

    17.2. Competition Benchmarking

    17.3. Market Share Analysis of Top Players

        17.3.1. By Regional

        17.3.2. By Clinic

        17.3.3. By Design Layout

        17.3.4. By Vehicle

18. Competition Analysis

    18.1. Competition Deep Dive

        18.1.1. ADI Mobile Health

            18.1.1.1. Overview

            18.1.1.2. Product Portfolio

            18.1.1.3. Profitability by Market Segments

            18.1.1.4. Sales Footprint

            18.1.1.5. Strategy Overview

                18.1.1.5.1. Marketing Strategy

        18.1.2. LifeLine Mobile, Inc.

            18.1.2.1. Overview

            18.1.2.2. Product Portfolio

            18.1.2.3. Profitability by Market Segments

            18.1.2.4. Sales Footprint

            18.1.2.5. Strategy Overview

                18.1.2.5.1. Marketing Strategy

        18.1.3. Medical Coaches

            18.1.3.1. Overview

            18.1.3.2. Product Portfolio

            18.1.3.3. Profitability by Market Segments

            18.1.3.4. Sales Footprint

            18.1.3.5. Strategy Overview

                18.1.3.5.1. Marketing Strategy

        18.1.4. Matthews Specialty Vehicles

            18.1.4.1. Overview

            18.1.4.2. Product Portfolio

            18.1.4.3. Profitability by Market Segments

            18.1.4.4. Sales Footprint

            18.1.4.5. Strategy Overview

                18.1.4.5.1. Marketing Strategy

        18.1.5. Odulair LLC.

            18.1.5.1. Overview

            18.1.5.2. Product Portfolio

            18.1.5.3. Profitability by Market Segments

            18.1.5.4. Sales Footprint

            18.1.5.5. Strategy Overview

                18.1.5.5.1. Marketing Strategy

        18.1.6. Johnson Medical International Sdn Bhd

            18.1.6.1. Overview

            18.1.6.2. Product Portfolio

            18.1.6.3. Profitability by Market Segments

            18.1.6.4. Sales Footprint

            18.1.6.5. Strategy Overview

                18.1.6.5.1. Marketing Strategy

        18.1.7. MinFound Medical Systems Co., Ltd

            18.1.7.1. Overview

            18.1.7.2. Product Portfolio

            18.1.7.3. Profitability by Market Segments

            18.1.7.4. Sales Footprint

            18.1.7.5. Strategy Overview

                18.1.7.5.1. Marketing Strategy

        18.1.8. CVR Industries USA, Inc.

            18.1.8.1. Overview

            18.1.8.2. Product Portfolio

            18.1.8.3. Profitability by Market Segments

            18.1.8.4. Sales Footprint

            18.1.8.5. Strategy Overview

                18.1.8.5.1. Marketing Strategy

        18.1.9. EMS Mobile Systems Inc.

            18.1.9.1. Overview

            18.1.9.2. Product Portfolio

            18.1.9.3. Profitability by Market Segments

            18.1.9.4. Sales Footprint

            18.1.9.5. Strategy Overview

                18.1.9.5.1. Marketing Strategy

        18.1.10. Farber Specialty Vehicles

            18.1.10.1. Overview

            18.1.10.2. Product Portfolio

            18.1.10.3. Profitability by Market Segments

            18.1.10.4. Sales Footprint

            18.1.10.5. Strategy Overview

                18.1.10.5.1. Marketing Strategy

19. Assumptions & Acronyms Used

20. Research Methodology

List of Tables

Table 1: Global Market Value (US$ Million) Forecast by Region, 2019 to 2034

Table 2: Global Market Value (US$ Million) Forecast by Clinic, 2019 to 2034

Table 3: Global Market Value (US$ Million) Forecast by Design Layout, 2019 to 2034

Table 4: Global Market Value (US$ Million) Forecast by Vehicle, 2019 to 2034

Table 5: North America Market Value (US$ Million) Forecast by Country, 2019 to 2034

Table 6: North America Market Value (US$ Million) Forecast by Clinic, 2019 to 2034

Table 7: North America Market Value (US$ Million) Forecast by Design Layout, 2019 to 2034

Table 8: North America Market Value (US$ Million) Forecast by Vehicle, 2019 to 2034

Table 9: Latin America Market Value (US$ Million) Forecast by Country, 2019 to 2034

Table 10: Latin America Market Value (US$ Million) Forecast by Clinic, 2019 to 2034

Table 11: Latin America Market Value (US$ Million) Forecast by Design Layout, 2019 to 2034

Table 12: Latin America Market Value (US$ Million) Forecast by Vehicle, 2019 to 2034

Table 13: Western Europe Market Value (US$ Million) Forecast by Country, 2019 to 2034

Table 14: Western Europe Market Value (US$ Million) Forecast by Clinic, 2019 to 2034

Table 15: Western Europe Market Value (US$ Million) Forecast by Design Layout, 2019 to 2034

Table 16: Western Europe Market Value (US$ Million) Forecast by Vehicle, 2019 to 2034

Table 17: Eastern Europe Market Value (US$ Million) Forecast by Country, 2019 to 2034

Table 18: Eastern Europe Market Value (US$ Million) Forecast by Clinic, 2019 to 2034

Table 19: Eastern Europe Market Value (US$ Million) Forecast by Design Layout, 2019 to 2034

Table 20: Eastern Europe Market Value (US$ Million) Forecast by Vehicle, 2019 to 2034

Table 21: South Asia and Pacific Market Value (US$ Million) Forecast by Country, 2019 to 2034

Table 22: South Asia and Pacific Market Value (US$ Million) Forecast by Clinic, 2019 to 2034

Table 23: South Asia and Pacific Market Value (US$ Million) Forecast by Design Layout, 2019 to 2034

Table 24: South Asia and Pacific Market Value (US$ Million) Forecast by Vehicle, 2019 to 2034

Table 25: East Asia Market Value (US$ Million) Forecast by Country, 2019 to 2034

Table 26: East Asia Market Value (US$ Million) Forecast by Clinic, 2019 to 2034

Table 27: East Asia Market Value (US$ Million) Forecast by Design Layout, 2019 to 2034

Table 28: East Asia Market Value (US$ Million) Forecast by Vehicle, 2019 to 2034

Table 29: Middle East and Africa Market Value (US$ Million) Forecast by Country, 2019 to 2034

Table 30: Middle East and Africa Market Value (US$ Million) Forecast by Clinic, 2019 to 2034

Table 31: Middle East and Africa Market Value (US$ Million) Forecast by Design Layout, 2019 to 2034

Table 32: Middle East and Africa Market Value (US$ Million) Forecast by Vehicle, 2019 to 2034

List of Charts

Figure 1: Global Market Value (US$ Million) by Clinic, 2024 to 2034

Figure 2: Global Market Value (US$ Million) by Design Layout, 2024 to 2034

Figure 3: Global Market Value (US$ Million) by Vehicle, 2024 to 2034

Figure 4: Global Market Value (US$ Million) by Region, 2024 to 2034

Figure 5: Global Market Value (US$ Million) Analysis by Region, 2019 to 2034

Figure 6: Global Market Value Share (%) and BPS Analysis by Region, 2024 to 2034

Figure 7: Global Market Y-o-Y Growth (%) Projections by Region, 2024 to 2034

Figure 8: Global Market Value (US$ Million) Analysis by Clinic, 2019 to 2034

Figure 9: Global Market Value Share (%) and BPS Analysis by Clinic, 2024 to 2034

Figure 10: Global Market Y-o-Y Growth (%) Projections by Clinic, 2024 to 2034

Figure 11: Global Market Value (US$ Million) Analysis by Design Layout, 2019 to 2034

Figure 12: Global Market Value Share (%) and BPS Analysis by Design Layout, 2024 to 2034

Figure 13: Global Market Y-o-Y Growth (%) Projections by Design Layout, 2024 to 2034

Figure 14: Global Market Value (US$ Million) Analysis by Vehicle, 2019 to 2034

Figure 15: Global Market Value Share (%) and BPS Analysis by Vehicle, 2024 to 2034

Figure 16: Global Market Y-o-Y Growth (%) Projections by Vehicle, 2024 to 2034

Figure 17: Global Market Attractiveness by Clinic, 2024 to 2034

Figure 18: Global Market Attractiveness by Design Layout, 2024 to 2034

Figure 19: Global Market Attractiveness by Vehicle, 2024 to 2034

Figure 20: Global Market Attractiveness by Region, 2024 to 2034

Figure 21: North America Market Value (US$ Million) by Clinic, 2024 to 2034

Figure 22: North America Market Value (US$ Million) by Design Layout, 2024 to 2034

Figure 23: North America Market Value (US$ Million) by Vehicle, 2024 to 2034

Figure 24: North America Market Value (US$ Million) by Country, 2024 to 2034

Figure 25: North America Market Value (US$ Million) Analysis by Country, 2019 to 2034

Figure 26: North America Market Value Share (%) and BPS Analysis by Country, 2024 to 2034

Figure 27: North America Market Y-o-Y Growth (%) Projections by Country, 2024 to 2034

Figure 28: North America Market Value (US$ Million) Analysis by Clinic, 2019 to 2034

Figure 29: North America Market Value Share (%) and BPS Analysis by Clinic, 2024 to 2034

Figure 30: North America Market Y-o-Y Growth (%) Projections by Clinic, 2024 to 2034

Figure 31: North America Market Value (US$ Million) Analysis by Design Layout, 2019 to 2034

Figure 32: North America Market Value Share (%) and BPS Analysis by Design Layout, 2024 to 2034

Figure 33: North America Market Y-o-Y Growth (%) Projections by Design Layout, 2024 to 2034

Figure 34: North America Market Value (US$ Million) Analysis by Vehicle, 2019 to 2034

Figure 35: North America Market Value Share (%) and BPS Analysis by Vehicle, 2024 to 2034

Figure 36: North America Market Y-o-Y Growth (%) Projections by Vehicle, 2024 to 2034

Figure 37: North America Market Attractiveness by Clinic, 2024 to 2034

Figure 38: North America Market Attractiveness by Design Layout, 2024 to 2034

Figure 39: North America Market Attractiveness by Vehicle, 2024 to 2034

Figure 40: North America Market Attractiveness by Country, 2024 to 2034

Figure 41: Latin America Market Value (US$ Million) by Clinic, 2024 to 2034

Figure 42: Latin America Market Value (US$ Million) by Design Layout, 2024 to 2034

Figure 43: Latin America Market Value (US$ Million) by Vehicle, 2024 to 2034

Figure 44: Latin America Market Value (US$ Million) by Country, 2024 to 2034

Figure 45: Latin America Market Value (US$ Million) Analysis by Country, 2019 to 2034

Figure 46: Latin America Market Value Share (%) and BPS Analysis by Country, 2024 to 2034

Figure 47: Latin America Market Y-o-Y Growth (%) Projections by Country, 2024 to 2034

Figure 48: Latin America Market Value (US$ Million) Analysis by Clinic, 2019 to 2034

Figure 49: Latin America Market Value Share (%) and BPS Analysis by Clinic, 2024 to 2034

Figure 50: Latin America Market Y-o-Y Growth (%) Projections by Clinic, 2024 to 2034

Figure 51: Latin America Market Value (US$ Million) Analysis by Design Layout, 2019 to 2034

Figure 52: Latin America Market Value Share (%) and BPS Analysis by Design Layout, 2024 to 2034

Figure 53: Latin America Market Y-o-Y Growth (%) Projections by Design Layout, 2024 to 2034

Figure 54: Latin America Market Value (US$ Million) Analysis by Vehicle, 2019 to 2034

Figure 55: Latin America Market Value Share (%) and BPS Analysis by Vehicle, 2024 to 2034

Figure 56: Latin America Market Y-o-Y Growth (%) Projections by Vehicle, 2024 to 2034

Figure 57: Latin America Market Attractiveness by Clinic, 2024 to 2034

Figure 58: Latin America Market Attractiveness by Design Layout, 2024 to 2034

Figure 59: Latin America Market Attractiveness by Vehicle, 2024 to 2034

Figure 60: Latin America Market Attractiveness by Country, 2024 to 2034

Figure 61: Western Europe Market Value (US$ Million) by Clinic, 2024 to 2034

Figure 62: Western Europe Market Value (US$ Million) by Design Layout, 2024 to 2034

Figure 63: Western Europe Market Value (US$ Million) by Vehicle, 2024 to 2034

Figure 64: Western Europe Market Value (US$ Million) by Country, 2024 to 2034

Figure 65: Western Europe Market Value (US$ Million) Analysis by Country, 2019 to 2034

Figure 66: Western Europe Market Value Share (%) and BPS Analysis by Country, 2024 to 2034

Figure 67: Western Europe Market Y-o-Y Growth (%) Projections by Country, 2024 to 2034

Figure 68: Western Europe Market Value (US$ Million) Analysis by Clinic, 2019 to 2034

Figure 69: Western Europe Market Value Share (%) and BPS Analysis by Clinic, 2024 to 2034

Figure 70: Western Europe Market Y-o-Y Growth (%) Projections by Clinic, 2024 to 2034

Figure 71: Western Europe Market Value (US$ Million) Analysis by Design Layout, 2019 to 2034

Figure 72: Western Europe Market Value Share (%) and BPS Analysis by Design Layout, 2024 to 2034

Figure 73: Western Europe Market Y-o-Y Growth (%) Projections by Design Layout, 2024 to 2034

Figure 74: Western Europe Market Value (US$ Million) Analysis by Vehicle, 2019 to 2034

Figure 75: Western Europe Market Value Share (%) and BPS Analysis by Vehicle, 2024 to 2034

Figure 76: Western Europe Market Y-o-Y Growth (%) Projections by Vehicle, 2024 to 2034

Figure 77: Western Europe Market Attractiveness by Clinic, 2024 to 2034

Figure 78: Western Europe Market Attractiveness by Design Layout, 2024 to 2034

Figure 79: Western Europe Market Attractiveness by Vehicle, 2024 to 2034

Figure 80: Western Europe Market Attractiveness by Country, 2024 to 2034

Figure 81: Eastern Europe Market Value (US$ Million) by Clinic, 2024 to 2034

Figure 82: Eastern Europe Market Value (US$ Million) by Design Layout, 2024 to 2034

Figure 83: Eastern Europe Market Value (US$ Million) by Vehicle, 2024 to 2034

Figure 84: Eastern Europe Market Value (US$ Million) by Country, 2024 to 2034

Figure 85: Eastern Europe Market Value (US$ Million) Analysis by Country, 2019 to 2034

Figure 86: Eastern Europe Market Value Share (%) and BPS Analysis by Country, 2024 to 2034

Figure 87: Eastern Europe Market Y-o-Y Growth (%) Projections by Country, 2024 to 2034

Figure 88: Eastern Europe Market Value (US$ Million) Analysis by Clinic, 2019 to 2034

Figure 89: Eastern Europe Market Value Share (%) and BPS Analysis by Clinic, 2024 to 2034

Figure 90: Eastern Europe Market Y-o-Y Growth (%) Projections by Clinic, 2024 to 2034

Figure 91: Eastern Europe Market Value (US$ Million) Analysis by Design Layout, 2019 to 2034

Figure 92: Eastern Europe Market Value Share (%) and BPS Analysis by Design Layout, 2024 to 2034

Figure 93: Eastern Europe Market Y-o-Y Growth (%) Projections by Design Layout, 2024 to 2034

Figure 94: Eastern Europe Market Value (US$ Million) Analysis by Vehicle, 2019 to 2034

Figure 95: Eastern Europe Market Value Share (%) and BPS Analysis by Vehicle, 2024 to 2034

Figure 96: Eastern Europe Market Y-o-Y Growth (%) Projections by Vehicle, 2024 to 2034

Figure 97: Eastern Europe Market Attractiveness by Clinic, 2024 to 2034

Figure 98: Eastern Europe Market Attractiveness by Design Layout, 2024 to 2034

Figure 99: Eastern Europe Market Attractiveness by Vehicle, 2024 to 2034

Figure 100: Eastern Europe Market Attractiveness by Country, 2024 to 2034

Figure 101: South Asia and Pacific Market Value (US$ Million) by Clinic, 2024 to 2034

Figure 102: South Asia and Pacific Market Value (US$ Million) by Design Layout, 2024 to 2034

Figure 103: South Asia and Pacific Market Value (US$ Million) by Vehicle, 2024 to 2034

Figure 104: South Asia and Pacific Market Value (US$ Million) by Country, 2024 to 2034

Figure 105: South Asia and Pacific Market Value (US$ Million) Analysis by Country, 2019 to 2034

Figure 106: South Asia and Pacific Market Value Share (%) and BPS Analysis by Country, 2024 to 2034

Figure 107: South Asia and Pacific Market Y-o-Y Growth (%) Projections by Country, 2024 to 2034

Figure 108: South Asia and Pacific Market Value (US$ Million) Analysis by Clinic, 2019 to 2034

Figure 109: South Asia and Pacific Market Value Share (%) and BPS Analysis by Clinic, 2024 to 2034

Figure 110: South Asia and Pacific Market Y-o-Y Growth (%) Projections by Clinic, 2024 to 2034

Figure 111: South Asia and Pacific Market Value (US$ Million) Analysis by Design Layout, 2019 to 2034

Figure 112: South Asia and Pacific Market Value Share (%) and BPS Analysis by Design Layout, 2024 to 2034

Figure 113: South Asia and Pacific Market Y-o-Y Growth (%) Projections by Design Layout, 2024 to 2034

Figure 114: South Asia and Pacific Market Value (US$ Million) Analysis by Vehicle, 2019 to 2034

Figure 115: South Asia and Pacific Market Value Share (%) and BPS Analysis by Vehicle, 2024 to 2034

Figure 116: South Asia and Pacific Market Y-o-Y Growth (%) Projections by Vehicle, 2024 to 2034

Figure 117: South Asia and Pacific Market Attractiveness by Clinic, 2024 to 2034

Figure 118: South Asia and Pacific Market Attractiveness by Design Layout, 2024 to 2034

Figure 119: South Asia and Pacific Market Attractiveness by Vehicle, 2024 to 2034

Figure 120: South Asia and Pacific Market Attractiveness by Country, 2024 to 2034

Figure 121: East Asia Market Value (US$ Million) by Clinic, 2024 to 2034

Figure 122: East Asia Market Value (US$ Million) by Design Layout, 2024 to 2034

Figure 123: East Asia Market Value (US$ Million) by Vehicle, 2024 to 2034

Figure 124: East Asia Market Value (US$ Million) by Country, 2024 to 2034

Figure 125: East Asia Market Value (US$ Million) Analysis by Country, 2019 to 2034

Figure 126: East Asia Market Value Share (%) and BPS Analysis by Country, 2024 to 2034

Figure 127: East Asia Market Y-o-Y Growth (%) Projections by Country, 2024 to 2034

Figure 128: East Asia Market Value (US$ Million) Analysis by Clinic, 2019 to 2034

Figure 129: East Asia Market Value Share (%) and BPS Analysis by Clinic, 2024 to 2034

Figure 130: East Asia Market Y-o-Y Growth (%) Projections by Clinic, 2024 to 2034

Figure 131: East Asia Market Value (US$ Million) Analysis by Design Layout, 2019 to 2034

Figure 132: East Asia Market Value Share (%) and BPS Analysis by Design Layout, 2024 to 2034

Figure 133: East Asia Market Y-o-Y Growth (%) Projections by Design Layout, 2024 to 2034

Figure 134: East Asia Market Value (US$ Million) Analysis by Vehicle, 2019 to 2034

Figure 135: East Asia Market Value Share (%) and BPS Analysis by Vehicle, 2024 to 2034

Figure 136: East Asia Market Y-o-Y Growth (%) Projections by Vehicle, 2024 to 2034

Figure 137: East Asia Market Attractiveness by Clinic, 2024 to 2034

Figure 138: East Asia Market Attractiveness by Design Layout, 2024 to 2034

Figure 139: East Asia Market Attractiveness by Vehicle, 2024 to 2034

Figure 140: East Asia Market Attractiveness by Country, 2024 to 2034

Figure 141: Middle East and Africa Market Value (US$ Million) by Clinic, 2024 to 2034

Figure 142: Middle East and Africa Market Value (US$ Million) by Design Layout, 2024 to 2034

Figure 143: Middle East and Africa Market Value (US$ Million) by Vehicle, 2024 to 2034

Figure 144: Middle East and Africa Market Value (US$ Million) by Country, 2024 to 2034

Figure 145: Middle East and Africa Market Value (US$ Million) Analysis by Country, 2019 to 2034

Figure 146: Middle East and Africa Market Value Share (%) and BPS Analysis by Country, 2024 to 2034

Figure 147: Middle East and Africa Market Y-o-Y Growth (%) Projections by Country, 2024 to 2034

Figure 148: Middle East and Africa Market Value (US$ Million) Analysis by Clinic, 2019 to 2034

Figure 149: Middle East and Africa Market Value Share (%) and BPS Analysis by Clinic, 2024 to 2034

Figure 150: Middle East and Africa Market Y-o-Y Growth (%) Projections by Clinic, 2024 to 2034

Figure 151: Middle East and Africa Market Value (US$ Million) Analysis by Design Layout, 2019 to 2034

Figure 152: Middle East and Africa Market Value Share (%) and BPS Analysis by Design Layout, 2024 to 2034

Figure 153: Middle East and Africa Market Y-o-Y Growth (%) Projections by Design Layout, 2024 to 2034

Figure 154: Middle East and Africa Market Value (US$ Million) Analysis by Vehicle, 2019 to 2034

Figure 155: Middle East and Africa Market Value Share (%) and BPS Analysis by Vehicle, 2024 to 2034

Figure 156: Middle East and Africa Market Y-o-Y Growth (%) Projections by Vehicle, 2024 to 2034

Figure 157: Middle East and Africa Market Attractiveness by Clinic, 2024 to 2034

Figure 158: Middle East and Africa Market Attractiveness by Design Layout, 2024 to 2034

Figure 159: Middle East and Africa Market Attractiveness by Vehicle, 2024 to 2034

Figure 160: Middle East and Africa Market Attractiveness by Country, 2024 to 2034

Recommendations

Healthcare

Outpatient Clinics Market

Published : October 2023

Healthcare

Mobile Gamma Cameras Market

Published : September 2023

Healthcare

Telemedicine Equipment Market

Published : October 2022

Healthcare

Private office-based clinics Market

Published : April 2022

Explore Healthcare Insights

View Reports