Reports

- Global Locations -

Headquarters

Future Market Insights, Inc.

Christiana Corporate, 200
Continental Drive, Suite 401,
Newark, Delaware - 19713,
United States

T: +1-845-579-5705

Americas

Future Market Insights, Inc.

616 Corporate Way, Suite 2-9018,
Valley Cottage, NY 10989, United States

T: +1-347-918-3531

MEA

Future Market Insights

1602-6 Jumeirah Bay X2 Tower, Plot No: JLT-PH2-X2A,
Jumeirah Lakes Towers, Dubai,
United Arab Emirates

Europe

Future Market Insights

3rd Floor, 207 Regent Street,
W1B 3HH London
United Kingdom

T: + 44 (0) 20 8123 9659
D: +44 (0) 20 3287 4268

Asia Pacific

Future Market Insights

IndiaLand Global Tech Park, Unit UG-1, Behind Grand HighStreet, Phase 1, Hinjawadi, MH, Pune – 411057, India

Cardiology Information System Market Outlook from 2024 to 2034

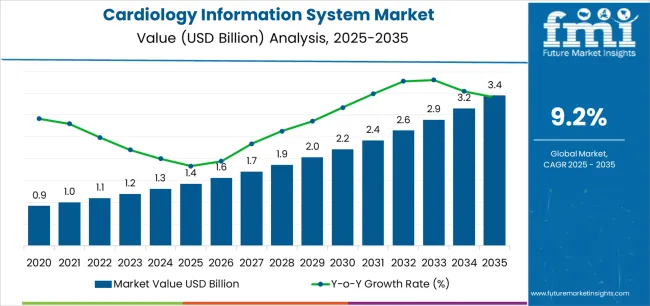
The cardiology information system market is estimated to be valued at US$ 1.3 billion in 2024. The cardiology information system is predicted to rise at a CAGR of 9.7% from 2024 to 2034. The global cardiology information system market is anticipated to reach US$ 3.7 billion by 2034.

The market for cardiology information systems has been experiencing growth due to the increasing prevalence of cardiovascular diseases and the need for efficient management of cardiology-related data.

The adoption of digital health solutions and the emphasis on interoperability within healthcare systems have also contributed to the growth of this market.

Advancements in imaging technologies and the use of artificial intelligence (AI) for image analysis and diagnostics are also influencing the development of cardiology information systems.

Attributes Key Insights
Estimated Market Size in 2024 US$ 1.3 billion
Projected Market Value in 2034 US$ 3.7 billion
Value-based CAGR from 2024 to 2034 9.7%

Don't pay for what you don't need

Customize your report by selecting specific countries or regions and save 30%!

2019 to 2023 Historical Analysis vs. 2024 to 2034 Market Forecast Projections

From 2019 to 2023, the cardiology information system market experienced a CAGR of 12.5%. The emphasis on interoperability within healthcare systems has driven the integration of cardiology information systems with other health information technologies, such as electronic medical records (EMR) and picture archiving and communication systems (PACS).

Seamless data exchange between different components of the healthcare infrastructure improves overall patient care. Government regulations and incentives promoting the adoption of healthcare information systems, including those in cardiology, have stimulated market growth.

Compliance with regulatory requirements and participation in incentive programs drive healthcare organizations to invest in modern information systems. Projections indicate that the global cardiology information system market is expected to experience a CAGR of 9.7% from 2024 to 2034.

Historical CAGR from 2019 to 2023 12.5%
Forecast CAGR from 2024 to 2034 9.7%

Cardiology Information System Market Growth Driver

  • The aging population worldwide is contributing to an increased prevalence of cardiovascular diseases and is a key driver for the growth of the cardiology information system market.
  • The increasing incidence and prevalence of cardiovascular diseases globally have fueled the demand for advanced solutions to manage and streamline cardiology-related data.
  • The persistent evolution of technology, particularly the incorporation of artificial intelligence (AI) and machine learning within healthcare systems, has the capability to stimulate the widespread adoption of advanced cardiology information systems.
  • Government regulations and incentives that encourage the adoption of healthcare information systems, including cardiology solutions, are driving market growth.
Sabyasachi Ghosh
Sabyasachi Ghosh

Principal Consultant

Talk to Analyst

Find your sweet spots for generating winning opportunities in this market.

Cardiology Information System Market Key Challenges

  • Healthcare data, especially in cardiology, contains sensitive and confidential information. Ensuring robust data security measures to protect patient privacy and comply with regulations such as HIPAA (Health Insurance Portability and Accountability Act) is a persistent challenge.
  • Achieving seamless interoperability with other healthcare information systems, such as electronic medical records (EMR) and picture archiving and communication systems (PACS), can be challenging.
  • Ensuring a smooth integration process and maintaining data consistency can be complex.
  • The initial costs associated with implementing cardiology information systems, including software, hardware, and training, can be substantial.
  • Keeping up with evolving healthcare regulations and ensuring compliance with standards can be challenging.
  • Meeting regulatory requirements, such as those related to data security and privacy, may necessitate ongoing updates and adjustments to the cardiology information system.
  • Lack of standardization in data formats and communication protocols within the healthcare industry poses challenges for interoperability.

Comparative View of Adjacent Markets

Future Market Insights has compared three markets, namely the radiology information system (RIS) market and the clinical information system (CIS) market are below.

The surge in chronic diseases, such as cancer, arthritis, cardiovascular ailments, and diabetes, linked to escalated fast food consumption and sedentary lifestyles, serves as a pivotal catalyst propelling the radiology information system (RIS) market.

The clinical information system (CIS) market is experiencing robust growth, driven by a surge in the prevalence and incidence of various critical diseases.

Cardiology Information System Market:

Attributes Cardiology Information System Market
CAGR from 2024 to 2034 9.7%
Key Trends
  • The growing trend of telemedicine and telecardiology has increased the demand for CIS that supports remote access to cardiological data.
Growth Factor
  • The rising incidence of cardiovascular diseases (CVDs) globally is a major driver for the growth of Cardiology Information Systems.

Radiology Information System (RIS) Market:

Attributes Radiology Information System (RIS) Market
CAGR from 2022 to 2032 7.9%
Key Trends
  • Growing shift towards cloud-based RIS solutions.
Growth Factor
  • The anticipated increase in demand for computerized medical imaging is set to propel the growth of the radiology information system (RIS) market.

Clinical Information System Market:

Attributes Clinical Information System Market
CAGR from 2022 to 2032 8%
Key Trends
Growth Factor
  • The increasing occurrence of diverse chronic diseases within the expanding global population is expected to be a significant factor contributing to the market share growth of clinical information systems.

Get the data you need at a Fraction of the cost

Personalize your report by choosing insights you need
and save 40%!

Country-wise Analysis

The provided table highlights the top five countries in terms of revenue, with South Korea and Japan leading the list. Government initiatives and healthcare policies wield substantial influence in driving the uptake of cutting-edge healthcare technologies, such as cardiology information systems in South Korea.

The ongoing progress in technology, particularly the incorporation of artificial intelligence (AI) and machine learning within healthcare frameworks, has the potential to fuel the widespread adoption of advanced cardiology information systems in Japan.

Attributes Forecast CAGRs from 2024 to 2034
The United States 10.0%
The United Kingdom 10.9%
China 9.8%
Japan 11.2%
South Korea 11.8%

Increased Healthcare Investment to Contribute to the Growth of the Cardiology Information System Market in the United States

The cardiology information system market in the United States is expected to grow with a CAGR of 10.0% from 2024 to 2034. The United States has a significant burden of cardiovascular diseases. The rising prevalence of conditions such as heart disease and stroke could drive the demand for advanced cardiology information systems to manage and streamline patient data.

The United States healthcare system has been undergoing a digital transformation, with increased adoption of electronic health records (EHR) and healthcare information technologies. This trend is likely to include the integration and adoption of advanced cardiology information systems.

Digital Health Transformation to Boost Market Growth in the United Kingdom

The prevalence of cardiovascular diseases in the United Kingdom is a key factor driving the demand for advanced cardiology solutions. The need for efficient management of cardiology-related data, including diagnostic imaging and patient records, may contribute to the growth of the cardiology information system market.

The cardiology information system market in the United Kingdom is expected to grow with a CAGR of 10.9% from 2024 to 2034.

The National Health Service (NHS) in the United Kingdom plays a significant role in shaping the healthcare technology landscape. Initiatives and investments by the NHS to modernize and digitize healthcare services may contribute to the adoption of cardiology information systems.

The United Kingdom's healthcare sector has been undergoing a digital transformation, with a focus on improving patient care through the use of digital technologies. This transformation includes the adoption of electronic health records (EHR) and other information systems, potentially extending to specialized systems like cardiology information systems.

Prevalence of Cardiovascular Diseases Driving Market Growth in China

The cardiology information system market in China is expected to grow with a CAGR of 9.8% from 2024 to 2034. China has been increasing its healthcare expenditure, and the government has implemented various initiatives to improve healthcare infrastructure and services. This investment could contribute to the adoption of advanced healthcare information systems, including cardiology information systems.

The increasing prevalence of cardiovascular diseases in China is a significant driver for the demand for cardiology information systems. As the population ages and lifestyle factors contribute to heart-related conditions, there is a growing need for efficient management of cardiology-related data.

Government policies and initiatives aimed at modernizing healthcare services may influence the adoption of healthcare information systems. In China, the government has been actively working to enhance healthcare infrastructure and promote the use of technology in healthcare delivery.

Technological Innovations to Propel Market in Japan

The cardiology information system market in Japan is expected to grow with a CAGR of 11.2% from 2024 to 2034. Japan has a rapidly aging population, leading to an increased prevalence of cardiovascular diseases. The need for efficient management of cardiovascular patient data is likely to drive the demand for advanced cardiology information systems to support diagnosis and treatment.

Japan is known for its advancements in technology and innovation. The adoption of state-of-the-art imaging technologies and the integration of artificial intelligence (AI) into cardiology information systems may be prominent trends in the Japanese market.

Government Initiatives and Policies Drive Market in South Korea

The cardiology information system market in South Korea is expected to grow with a CAGR of 11.8% from 2024 to 2034. South Korea has been actively adopting telemedicine and digital health solutions.

Cardiology information systems that support remote access to cardiovascular data and telecardiology consultations may align with these trends.

Government initiatives and policies in South Korea can significantly influence the adoption of healthcare information systems. The government's support for digital health initiatives and regulations may shape the landscape of cardiology information system adoption.

Category-wise Insights

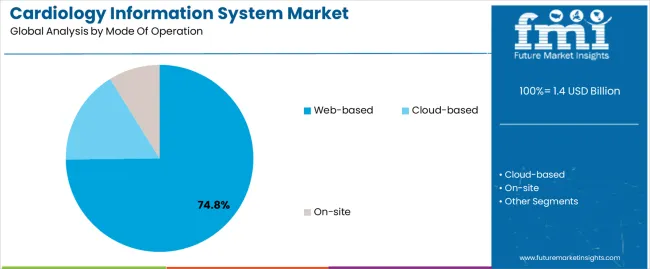
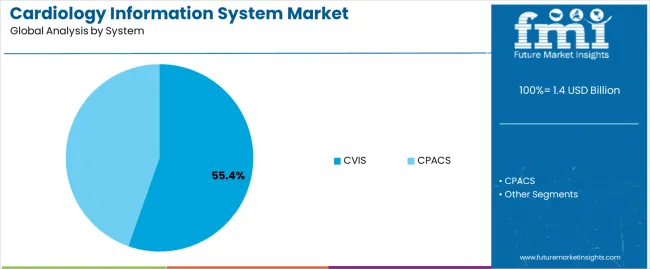
The below section shows the leading segment. The web-based segment is to grow at a CAGR of 9.6% from 2024 to 2034. Based on application, the CVIS segment is anticipated to hold a dominant share through 2034. It is set to exhibit a CAGR of 9.4% from 2024 to 2034.

Category CAGR
Web-based 9.6%
CVIS 9.4%

Web-Based Segment to Remain Prominent Throughout the Forecast Period

Based on the mode of operation, the web-based segment is anticipated to thrive at a CAGR of 9.6% from 2024 to 2034. Web-based cardiology information systems allow healthcare professionals to access patient data and diagnostic information remotely. This accessibility is crucial for efficient collaboration among healthcare providers, especially when dealing with complex cardiology cases that may require input from multiple specialists.

Web-based systems offer greater flexibility and scalability compared to traditional, on-premises solutions. Healthcare providers can scale their usage according to their needs and adapt the system to changes in patient volumes or organizational growth without significant infrastructure modifications.

Web-based CIS allows for real-time updates and synchronization of data across different locations. This ensures that healthcare providers have access to the most recent patient information, test results, and medical histories, contributing to more informed decision-making.

Web-based cardiology information systems are designed to integrate seamlessly with other healthcare information technologies, such as electronic medical records (EMR) and picture archiving and communication systems (PACS). This interoperability enhances the overall efficiency of healthcare workflows and contributes to better patient care.

CVIS Segment is expected to Expand at the Fastest CAGR over the Forecast Period.

Based on the system, the CVIS segment is anticipated to thrive at a CAGR of 9.4% from 2024 to 2034. CVIS systems offer comprehensive data management capabilities tailored to cardiology workflows. These systems efficiently handle various types of cardiology-related data, including diagnostic images, reports, and patient information, in a centralized and organized manner.

CVIS systems integrate seamlessly with other healthcare information systems, such as Electronic Health Records (EHR) and Picture Archiving and Communication Systems (PACS). This integration streamlines workflows, enabling healthcare professionals to access and share relevant patient data across different departments and specialties.
Competitive Landscape

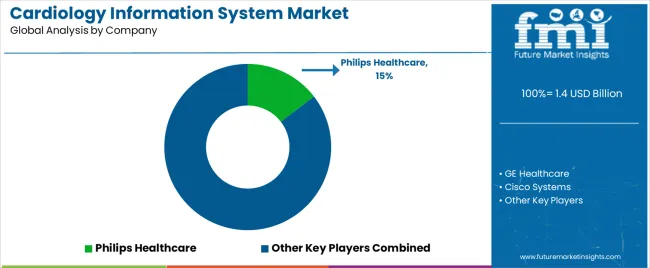
The cardiology information system market is moderately competitive, with a significant presence of major players. In this dynamic environment, companies are proactively employing various strategies, including expansions, acquisitions, mergers, the launch of new products, and technological upgrades, to strengthen their market positions. These diverse approaches are instrumental for market participants to not only broaden their market share but also to sustain and reinforce their current standings.

  • Philips Healthcare provides a wide range of healthcare solutions, including medical imaging, patient monitoring, and healthcare informatics. In the cardiology information system market, Philips offers solutions for cardiovascular data management and analytics.
  • GE Healthcare is a leading provider of medical imaging, monitoring, biomanufacturing, and cell therapy technologies. In the cardiology information system market, GE Healthcare offers solutions for managing and analyzing cardiology data, supporting diagnosis and treatment planning.

Report Scope

Attributes Details
Estimated Market Size in 2024 US$ 1.3 billion
Projected Market Valuation in 2034 US$ 3.7 billion
Value-based CAGR 2024 to 2034 9.7%
Forecast Period 2024 to 2034
Historical Data Available for 2019 to 2023
Market Analysis Value in US$ billion
Key Regions Covered
  • North America
  • Latin America
  • Western Europe
  • Eastern Europe
  • South Asia and Pacific
  • East Asia
  • Middle East and Africa
Key Market Segments Covered
  • Mode of operation
  • System
  • Region
Key Countries Profiled
  • The United States
  • Canada
  • Brazil
  • Mexico
  • Germany
  • The United Kingdom
  • France
  • Spain
  • Italy
  • Russia
  • Poland
  • Czech Republic
  • Romania
  • India
  • Bangladesh
  • Australia
  • New Zealand
  • China
  • Japan
  • South Korea
  • GCC countries
  • South Africa
  • Israel
Key Companies Profiled
  • Philips Healthcare
  • GE Healthcare
  • Cisco Systems
  • Fujifilm Medical Systems Inc.
  • Siemens Healthcare GmbH
  • Cerner Corporation
  • LUMEDX Corporation
  • Digisonics Inc.
  • Honeywell Life Care Solutions

Cardiology Information System Market - Key Segments

BY Mode of Operation:

  • Web-based
  • Cloud-based
  • On-site

By System:

  • CVIS
  • CPACS

By Region:

  • North America
  • Latin America
  • Western Europe
  • Eastern Europe
  • South Asia and Pacific
  • East Asia
  • Middle East and Africa

Frequently Asked Questions

What is the expected worth of the cardiology information system market in 2024?

As of 2024, the market for cardiology information systems is expected to be valued at US$ 1.3 billion.

What is the anticipated market value for the cardiology information system in 2034?

By 2034, the market value of cardiology information systems is expected to reach US$ 3.7 billion.

What is the projected forecast CAGR for the cardiology information system market from 2024 to 2034?

From 2024 to 2034, the cardiology information system market is expected to flourish at a CAGR of 9.7%

Based on mode of operation, which segment dominates the cardiology information system market?

Web Based segment is expected to grow at a CAGR of 9.6% from 2024 to 2034.

Which country is likely to be at the pinnacle of the market?

South Korea is likely the top-performing market, with a CAGR of 11.8%.

Table of Content

1. Executive Summary

    1.1. Global Market Outlook

    1.2. Demand-side Trends

    1.3. Supply-side Trends

    1.4. Technology Roadmap Analysis

    1.5. Analysis and Recommendations

2. Market Overview

    2.1. Market Coverage / Taxonomy

    2.2. Market Definition / Scope / Limitations

3. Market Background

    3.1. Market Dynamics

        3.1.1. Drivers

        3.1.2. Restraints

        3.1.3. Opportunity

        3.1.4. Trends

    3.2. Scenario Forecast

        3.2.1. Demand in Optimistic Scenario

        3.2.2. Demand in Likely Scenario

        3.2.3. Demand in Conservative Scenario

    3.3. Opportunity Map Analysis

    3.4. Investment Feasibility Matrix

    3.5. PESTLE and Porter’s Analysis

    3.6. Regulatory Landscape

        3.6.1. By Key Regions

        3.6.2. By Key Countries

    3.7. Regional Parent Market Outlook

4. Global Market Analysis 2019 to 2023 and Forecast, 2024 to 2034

    4.1. Historical Market Size Value (US$ Million) Analysis, 2019 to 2023

    4.2. Current and Future Market Size Value (US$ Million) Projections, 2024 to 2034

        4.2.1. Y-o-Y Growth Trend Analysis

        4.2.2. Absolute $ Opportunity Analysis

5. Global Market Analysis 2019 to 2023 and Forecast 2024 to 2034, By Mode Of Operation

    5.1. Introduction / Key Findings

    5.2. Historical Market Size Value (US$ Million) Analysis By Mode Of Operation, 2019 to 2023

    5.3. Current and Future Market Size Value (US$ Million) Analysis and Forecast By Mode Of Operation, 2024 to 2034

        5.3.1. Web-based

        5.3.2. Cloud-based

        5.3.3. On-site

    5.4. Y-o-Y Growth Trend Analysis By Mode Of Operation, 2019 to 2023

    5.5. Absolute $ Opportunity Analysis By Mode Of Operation, 2024 to 2034

6. Global Market Analysis 2019 to 2023 and Forecast 2024 to 2034, By System

    6.1. Introduction / Key Findings

    6.2. Historical Market Size Value (US$ Million) Analysis By System , 2019 to 2023

    6.3. Current and Future Market Size Value (US$ Million) Analysis and Forecast By System , 2024 to 2034

        6.3.1. CVIS

        6.3.2. CPACS

    6.4. Y-o-Y Growth Trend Analysis By System , 2019 to 2023

    6.5. Absolute $ Opportunity Analysis By System , 2024 to 2034

7. Global Market Analysis 2019 to 2023 and Forecast 2024 to 2034, By Region

    7.1. Introduction

    7.2. Historical Market Size Value (US$ Million) Analysis By Region, 2019 to 2023

    7.3. Current Market Size Value (US$ Million) Analysis and Forecast By Region, 2024 to 2034

        7.3.1. North America

        7.3.2. Latin America

        7.3.3. Western Europe

        7.3.4. Eastern Europe

        7.3.5. South Asia and Pacific

        7.3.6. East Asia

        7.3.7. Middle East and Africa

    7.4. Market Attractiveness Analysis By Region

8. North America Market Analysis 2019 to 2023 and Forecast 2024 to 2034, By Country

    8.1. Historical Market Size Value (US$ Million) Trend Analysis By Market Taxonomy, 2019 to 2023

    8.2. Market Size Value (US$ Million) Forecast By Market Taxonomy, 2024 to 2034

        8.2.1. By Country

            8.2.1.1. USA

            8.2.1.2. Canada

        8.2.2. By Mode Of Operation

        8.2.3. By System

    8.3. Market Attractiveness Analysis

        8.3.1. By Country

        8.3.2. By Mode Of Operation

        8.3.3. By System

    8.4. Key Takeaways

9. Latin America Market Analysis 2019 to 2023 and Forecast 2024 to 2034, By Country

    9.1. Historical Market Size Value (US$ Million) Trend Analysis By Market Taxonomy, 2019 to 2023

    9.2. Market Size Value (US$ Million) Forecast By Market Taxonomy, 2024 to 2034

        9.2.1. By Country

            9.2.1.1. Brazil

            9.2.1.2. Mexico

            9.2.1.3. Rest of Latin America

        9.2.2. By Mode Of Operation

        9.2.3. By System

    9.3. Market Attractiveness Analysis

        9.3.1. By Country

        9.3.2. By Mode Of Operation

        9.3.3. By System

    9.4. Key Takeaways

10. Western Europe Market Analysis 2019 to 2023 and Forecast 2024 to 2034, By Country

    10.1. Historical Market Size Value (US$ Million) Trend Analysis By Market Taxonomy, 2019 to 2023

    10.2. Market Size Value (US$ Million) Forecast By Market Taxonomy, 2024 to 2034

        10.2.1. By Country

            10.2.1.1. Germany

            10.2.1.2. UK

            10.2.1.3. France

            10.2.1.4. Spain

            10.2.1.5. Italy

            10.2.1.6. Rest of Western Europe

        10.2.2. By Mode Of Operation

        10.2.3. By System

    10.3. Market Attractiveness Analysis

        10.3.1. By Country

        10.3.2. By Mode Of Operation

        10.3.3. By System

    10.4. Key Takeaways

11. Eastern Europe Market Analysis 2019 to 2023 and Forecast 2024 to 2034, By Country

    11.1. Historical Market Size Value (US$ Million) Trend Analysis By Market Taxonomy, 2019 to 2023

    11.2. Market Size Value (US$ Million) Forecast By Market Taxonomy, 2024 to 2034

        11.2.1. By Country

            11.2.1.1. Poland

            11.2.1.2. Russia

            11.2.1.3. Czech Republic

            11.2.1.4. Romania

            11.2.1.5. Rest of Eastern Europe

        11.2.2. By Mode Of Operation

        11.2.3. By System

    11.3. Market Attractiveness Analysis

        11.3.1. By Country

        11.3.2. By Mode Of Operation

        11.3.3. By System

    11.4. Key Takeaways

12. South Asia and Pacific Market Analysis 2019 to 2023 and Forecast 2024 to 2034, By Country

    12.1. Historical Market Size Value (US$ Million) Trend Analysis By Market Taxonomy, 2019 to 2023

    12.2. Market Size Value (US$ Million) Forecast By Market Taxonomy, 2024 to 2034

        12.2.1. By Country

            12.2.1.1. India

            12.2.1.2. Bangladesh

            12.2.1.3. Australia

            12.2.1.4. New Zealand

            12.2.1.5. Rest of South Asia and Pacific

        12.2.2. By Mode Of Operation

        12.2.3. By System

    12.3. Market Attractiveness Analysis

        12.3.1. By Country

        12.3.2. By Mode Of Operation

        12.3.3. By System

    12.4. Key Takeaways

13. East Asia Market Analysis 2019 to 2023 and Forecast 2024 to 2034, By Country

    13.1. Historical Market Size Value (US$ Million) Trend Analysis By Market Taxonomy, 2019 to 2023

    13.2. Market Size Value (US$ Million) Forecast By Market Taxonomy, 2024 to 2034

        13.2.1. By Country

            13.2.1.1. China

            13.2.1.2. Japan

            13.2.1.3. South Korea

        13.2.2. By Mode Of Operation

        13.2.3. By System

    13.3. Market Attractiveness Analysis

        13.3.1. By Country

        13.3.2. By Mode Of Operation

        13.3.3. By System

    13.4. Key Takeaways

14. Middle East and Africa Market Analysis 2019 to 2023 and Forecast 2024 to 2034, By Country

    14.1. Historical Market Size Value (US$ Million) Trend Analysis By Market Taxonomy, 2019 to 2023

    14.2. Market Size Value (US$ Million) Forecast By Market Taxonomy, 2024 to 2034

        14.2.1. By Country

            14.2.1.1. GCC Countries

            14.2.1.2. South Africa

            14.2.1.3. Israel

            14.2.1.4. Rest of MEA

        14.2.2. By Mode Of Operation

        14.2.3. By System

    14.3. Market Attractiveness Analysis

        14.3.1. By Country

        14.3.2. By Mode Of Operation

        14.3.3. By System

    14.4. Key Takeaways

15. Key Countries Market Analysis

    15.1. USA

        15.1.1. Pricing Analysis

        15.1.2. Market Share Analysis, 2023

            15.1.2.1. By Mode Of Operation

            15.1.2.2. By System

    15.2. Canada

        15.2.1. Pricing Analysis

        15.2.2. Market Share Analysis, 2023

            15.2.2.1. By Mode Of Operation

            15.2.2.2. By System

    15.3. Brazil

        15.3.1. Pricing Analysis

        15.3.2. Market Share Analysis, 2023

            15.3.2.1. By Mode Of Operation

            15.3.2.2. By System

    15.4. Mexico

        15.4.1. Pricing Analysis

        15.4.2. Market Share Analysis, 2023

            15.4.2.1. By Mode Of Operation

            15.4.2.2. By System

    15.5. Germany

        15.5.1. Pricing Analysis

        15.5.2. Market Share Analysis, 2023

            15.5.2.1. By Mode Of Operation

            15.5.2.2. By System

    15.6. UK

        15.6.1. Pricing Analysis

        15.6.2. Market Share Analysis, 2023

            15.6.2.1. By Mode Of Operation

            15.6.2.2. By System

    15.7. France

        15.7.1. Pricing Analysis

        15.7.2. Market Share Analysis, 2023

            15.7.2.1. By Mode Of Operation

            15.7.2.2. By System

    15.8. Spain

        15.8.1. Pricing Analysis

        15.8.2. Market Share Analysis, 2023

            15.8.2.1. By Mode Of Operation

            15.8.2.2. By System

    15.9. Italy

        15.9.1. Pricing Analysis

        15.9.2. Market Share Analysis, 2023

            15.9.2.1. By Mode Of Operation

            15.9.2.2. By System

    15.10. Poland

        15.10.1. Pricing Analysis

        15.10.2. Market Share Analysis, 2023

            15.10.2.1. By Mode Of Operation

            15.10.2.2. By System

    15.11. Russia

        15.11.1. Pricing Analysis

        15.11.2. Market Share Analysis, 2023

            15.11.2.1. By Mode Of Operation

            15.11.2.2. By System

    15.12. Czech Republic

        15.12.1. Pricing Analysis

        15.12.2. Market Share Analysis, 2023

            15.12.2.1. By Mode Of Operation

            15.12.2.2. By System

    15.13. Romania

        15.13.1. Pricing Analysis

        15.13.2. Market Share Analysis, 2023

            15.13.2.1. By Mode Of Operation

            15.13.2.2. By System

    15.14. India

        15.14.1. Pricing Analysis

        15.14.2. Market Share Analysis, 2023

            15.14.2.1. By Mode Of Operation

            15.14.2.2. By System

    15.15. Bangladesh

        15.15.1. Pricing Analysis

        15.15.2. Market Share Analysis, 2023

            15.15.2.1. By Mode Of Operation

            15.15.2.2. By System

    15.16. Australia

        15.16.1. Pricing Analysis

        15.16.2. Market Share Analysis, 2023

            15.16.2.1. By Mode Of Operation

            15.16.2.2. By System

    15.17. New Zealand

        15.17.1. Pricing Analysis

        15.17.2. Market Share Analysis, 2023

            15.17.2.1. By Mode Of Operation

            15.17.2.2. By System

    15.18. China

        15.18.1. Pricing Analysis

        15.18.2. Market Share Analysis, 2023

            15.18.2.1. By Mode Of Operation

            15.18.2.2. By System

    15.19. Japan

        15.19.1. Pricing Analysis

        15.19.2. Market Share Analysis, 2023

            15.19.2.1. By Mode Of Operation

            15.19.2.2. By System

    15.20. South Korea

        15.20.1. Pricing Analysis

        15.20.2. Market Share Analysis, 2023

            15.20.2.1. By Mode Of Operation

            15.20.2.2. By System

    15.21. GCC Countries

        15.21.1. Pricing Analysis

        15.21.2. Market Share Analysis, 2023

            15.21.2.1. By Mode Of Operation

            15.21.2.2. By System

    15.22. South Africa

        15.22.1. Pricing Analysis

        15.22.2. Market Share Analysis, 2023

            15.22.2.1. By Mode Of Operation

            15.22.2.2. By System

    15.23. Israel

        15.23.1. Pricing Analysis

        15.23.2. Market Share Analysis, 2023

            15.23.2.1. By Mode Of Operation

            15.23.2.2. By System

16. Market Structure Analysis

    16.1. Competition Dashboard

    16.2. Competition Benchmarking

    16.3. Market Share Analysis of Top Players

        16.3.1. By Regional

        16.3.2. By Mode Of Operation

        16.3.3. By System

17. Competition Analysis

    17.1. Competition Deep Dive

        17.1.1. Philips Healthcare

            17.1.1.1. Overview

            17.1.1.2. Product Portfolio

            17.1.1.3. Profitability by Market Segments

            17.1.1.4. Sales Footprint

            17.1.1.5. Strategy Overview

                17.1.1.5.1. Marketing Strategy

        17.1.2. GE Healthcare

            17.1.2.1. Overview

            17.1.2.2. Product Portfolio

            17.1.2.3. Profitability by Market Segments

            17.1.2.4. Sales Footprint

            17.1.2.5. Strategy Overview

                17.1.2.5.1. Marketing Strategy

        17.1.3. Cisco Systems

            17.1.3.1. Overview

            17.1.3.2. Product Portfolio

            17.1.3.3. Profitability by Market Segments

            17.1.3.4. Sales Footprint

            17.1.3.5. Strategy Overview

                17.1.3.5.1. Marketing Strategy

        17.1.4. Fujifilm Medical Systems, Inc.

            17.1.4.1. Overview

            17.1.4.2. Product Portfolio

            17.1.4.3. Profitability by Market Segments

            17.1.4.4. Sales Footprint

            17.1.4.5. Strategy Overview

                17.1.4.5.1. Marketing Strategy

        17.1.5. Siemens Healthcare GmbH

            17.1.5.1. Overview

            17.1.5.2. Product Portfolio

            17.1.5.3. Profitability by Market Segments

            17.1.5.4. Sales Footprint

            17.1.5.5. Strategy Overview

                17.1.5.5.1. Marketing Strategy

        17.1.6. Cerner Corporation

            17.1.6.1. Overview

            17.1.6.2. Product Portfolio

            17.1.6.3. Profitability by Market Segments

            17.1.6.4. Sales Footprint

            17.1.6.5. Strategy Overview

                17.1.6.5.1. Marketing Strategy

        17.1.7. LUMEDX Corporation

            17.1.7.1. Overview

            17.1.7.2. Product Portfolio

            17.1.7.3. Profitability by Market Segments

            17.1.7.4. Sales Footprint

            17.1.7.5. Strategy Overview

                17.1.7.5.1. Marketing Strategy

        17.1.8. Digisonics, Inc.

            17.1.8.1. Overview

            17.1.8.2. Product Portfolio

            17.1.8.3. Profitability by Market Segments

            17.1.8.4. Sales Footprint

            17.1.8.5. Strategy Overview

                17.1.8.5.1. Marketing Strategy

        17.1.9. Honeywell Life Care Solutions

            17.1.9.1. Overview

            17.1.9.2. Product Portfolio

            17.1.9.3. Profitability by Market Segments

            17.1.9.4. Sales Footprint

            17.1.9.5. Strategy Overview

                17.1.9.5.1. Marketing Strategy

18. Assumptions & Acronyms Used

19. Research Methodology

List of Tables

Table 1: Global Market Value (US$ Million) Forecast by Region, 2019 to 2034

Table 2: Global Market Value (US$ Million) Forecast by Mode Of Operation, 2019 to 2034

Table 3: Global Market Value (US$ Million) Forecast by System, 2019 to 2034

Table 4: North America Market Value (US$ Million) Forecast by Country, 2019 to 2034

Table 5: North America Market Value (US$ Million) Forecast by Mode Of Operation, 2019 to 2034

Table 6: North America Market Value (US$ Million) Forecast by System, 2019 to 2034

Table 7: Latin America Market Value (US$ Million) Forecast by Country, 2019 to 2034

Table 8: Latin America Market Value (US$ Million) Forecast by Mode Of Operation, 2019 to 2034

Table 9: Latin America Market Value (US$ Million) Forecast by System, 2019 to 2034

Table 10: Western Europe Market Value (US$ Million) Forecast by Country, 2019 to 2034

Table 11: Western Europe Market Value (US$ Million) Forecast by Mode Of Operation, 2019 to 2034

Table 12: Western Europe Market Value (US$ Million) Forecast by System, 2019 to 2034

Table 13: Eastern Europe Market Value (US$ Million) Forecast by Country, 2019 to 2034

Table 14: Eastern Europe Market Value (US$ Million) Forecast by Mode Of Operation, 2019 to 2034

Table 15: Eastern Europe Market Value (US$ Million) Forecast by System, 2019 to 2034

Table 16: South Asia and Pacific Market Value (US$ Million) Forecast by Country, 2019 to 2034

Table 17: South Asia and Pacific Market Value (US$ Million) Forecast by Mode Of Operation, 2019 to 2034

Table 18: South Asia and Pacific Market Value (US$ Million) Forecast by System, 2019 to 2034

Table 19: East Asia Market Value (US$ Million) Forecast by Country, 2019 to 2034

Table 20: East Asia Market Value (US$ Million) Forecast by Mode Of Operation, 2019 to 2034

Table 21: East Asia Market Value (US$ Million) Forecast by System, 2019 to 2034

Table 22: Middle East and Africa Market Value (US$ Million) Forecast by Country, 2019 to 2034

Table 23: Middle East and Africa Market Value (US$ Million) Forecast by Mode Of Operation, 2019 to 2034

Table 24: Middle East and Africa Market Value (US$ Million) Forecast by System, 2019 to 2034

List of Charts

Figure 1: Global Market Value (US$ Million) by Mode Of Operation, 2024 to 2034

Figure 2: Global Market Value (US$ Million) by System, 2024 to 2034

Figure 3: Global Market Value (US$ Million) by Region, 2024 to 2034

Figure 4: Global Market Value (US$ Million) Analysis by Region, 2019 to 2034

Figure 5: Global Market Value Share (%) and BPS Analysis by Region, 2024 to 2034

Figure 6: Global Market Y-o-Y Growth (%) Projections by Region, 2024 to 2034

Figure 7: Global Market Value (US$ Million) Analysis by Mode Of Operation, 2019 to 2034

Figure 8: Global Market Value Share (%) and BPS Analysis by Mode Of Operation, 2024 to 2034

Figure 9: Global Market Y-o-Y Growth (%) Projections by Mode Of Operation, 2024 to 2034

Figure 10: Global Market Value (US$ Million) Analysis by System, 2019 to 2034

Figure 11: Global Market Value Share (%) and BPS Analysis by System, 2024 to 2034

Figure 12: Global Market Y-o-Y Growth (%) Projections by System, 2024 to 2034

Figure 13: Global Market Attractiveness by Mode Of Operation, 2024 to 2034

Figure 14: Global Market Attractiveness by System, 2024 to 2034

Figure 15: Global Market Attractiveness by Region, 2024 to 2034

Figure 16: North America Market Value (US$ Million) by Mode Of Operation, 2024 to 2034

Figure 17: North America Market Value (US$ Million) by System, 2024 to 2034

Figure 18: North America Market Value (US$ Million) by Country, 2024 to 2034

Figure 19: North America Market Value (US$ Million) Analysis by Country, 2019 to 2034

Figure 20: North America Market Value Share (%) and BPS Analysis by Country, 2024 to 2034

Figure 21: North America Market Y-o-Y Growth (%) Projections by Country, 2024 to 2034

Figure 22: North America Market Value (US$ Million) Analysis by Mode Of Operation, 2019 to 2034

Figure 23: North America Market Value Share (%) and BPS Analysis by Mode Of Operation, 2024 to 2034

Figure 24: North America Market Y-o-Y Growth (%) Projections by Mode Of Operation, 2024 to 2034

Figure 25: North America Market Value (US$ Million) Analysis by System, 2019 to 2034

Figure 26: North America Market Value Share (%) and BPS Analysis by System, 2024 to 2034

Figure 27: North America Market Y-o-Y Growth (%) Projections by System, 2024 to 2034

Figure 28: North America Market Attractiveness by Mode Of Operation, 2024 to 2034

Figure 29: North America Market Attractiveness by System, 2024 to 2034

Figure 30: North America Market Attractiveness by Country, 2024 to 2034

Figure 31: Latin America Market Value (US$ Million) by Mode Of Operation, 2024 to 2034

Figure 32: Latin America Market Value (US$ Million) by System, 2024 to 2034

Figure 33: Latin America Market Value (US$ Million) by Country, 2024 to 2034

Figure 34: Latin America Market Value (US$ Million) Analysis by Country, 2019 to 2034

Figure 35: Latin America Market Value Share (%) and BPS Analysis by Country, 2024 to 2034

Figure 36: Latin America Market Y-o-Y Growth (%) Projections by Country, 2024 to 2034

Figure 37: Latin America Market Value (US$ Million) Analysis by Mode Of Operation, 2019 to 2034

Figure 38: Latin America Market Value Share (%) and BPS Analysis by Mode Of Operation, 2024 to 2034

Figure 39: Latin America Market Y-o-Y Growth (%) Projections by Mode Of Operation, 2024 to 2034

Figure 40: Latin America Market Value (US$ Million) Analysis by System, 2019 to 2034

Figure 41: Latin America Market Value Share (%) and BPS Analysis by System, 2024 to 2034

Figure 42: Latin America Market Y-o-Y Growth (%) Projections by System, 2024 to 2034

Figure 43: Latin America Market Attractiveness by Mode Of Operation, 2024 to 2034

Figure 44: Latin America Market Attractiveness by System, 2024 to 2034

Figure 45: Latin America Market Attractiveness by Country, 2024 to 2034

Figure 46: Western Europe Market Value (US$ Million) by Mode Of Operation, 2024 to 2034

Figure 47: Western Europe Market Value (US$ Million) by System, 2024 to 2034

Figure 48: Western Europe Market Value (US$ Million) by Country, 2024 to 2034

Figure 49: Western Europe Market Value (US$ Million) Analysis by Country, 2019 to 2034

Figure 50: Western Europe Market Value Share (%) and BPS Analysis by Country, 2024 to 2034

Figure 51: Western Europe Market Y-o-Y Growth (%) Projections by Country, 2024 to 2034

Figure 52: Western Europe Market Value (US$ Million) Analysis by Mode Of Operation, 2019 to 2034

Figure 53: Western Europe Market Value Share (%) and BPS Analysis by Mode Of Operation, 2024 to 2034

Figure 54: Western Europe Market Y-o-Y Growth (%) Projections by Mode Of Operation, 2024 to 2034

Figure 55: Western Europe Market Value (US$ Million) Analysis by System, 2019 to 2034

Figure 56: Western Europe Market Value Share (%) and BPS Analysis by System, 2024 to 2034

Figure 57: Western Europe Market Y-o-Y Growth (%) Projections by System, 2024 to 2034

Figure 58: Western Europe Market Attractiveness by Mode Of Operation, 2024 to 2034

Figure 59: Western Europe Market Attractiveness by System, 2024 to 2034

Figure 60: Western Europe Market Attractiveness by Country, 2024 to 2034

Figure 61: Eastern Europe Market Value (US$ Million) by Mode Of Operation, 2024 to 2034

Figure 62: Eastern Europe Market Value (US$ Million) by System, 2024 to 2034

Figure 63: Eastern Europe Market Value (US$ Million) by Country, 2024 to 2034

Figure 64: Eastern Europe Market Value (US$ Million) Analysis by Country, 2019 to 2034

Figure 65: Eastern Europe Market Value Share (%) and BPS Analysis by Country, 2024 to 2034

Figure 66: Eastern Europe Market Y-o-Y Growth (%) Projections by Country, 2024 to 2034

Figure 67: Eastern Europe Market Value (US$ Million) Analysis by Mode Of Operation, 2019 to 2034

Figure 68: Eastern Europe Market Value Share (%) and BPS Analysis by Mode Of Operation, 2024 to 2034

Figure 69: Eastern Europe Market Y-o-Y Growth (%) Projections by Mode Of Operation, 2024 to 2034

Figure 70: Eastern Europe Market Value (US$ Million) Analysis by System, 2019 to 2034

Figure 71: Eastern Europe Market Value Share (%) and BPS Analysis by System, 2024 to 2034

Figure 72: Eastern Europe Market Y-o-Y Growth (%) Projections by System, 2024 to 2034

Figure 73: Eastern Europe Market Attractiveness by Mode Of Operation, 2024 to 2034

Figure 74: Eastern Europe Market Attractiveness by System, 2024 to 2034

Figure 75: Eastern Europe Market Attractiveness by Country, 2024 to 2034

Figure 76: South Asia and Pacific Market Value (US$ Million) by Mode Of Operation, 2024 to 2034

Figure 77: South Asia and Pacific Market Value (US$ Million) by System, 2024 to 2034

Figure 78: South Asia and Pacific Market Value (US$ Million) by Country, 2024 to 2034

Figure 79: South Asia and Pacific Market Value (US$ Million) Analysis by Country, 2019 to 2034

Figure 80: South Asia and Pacific Market Value Share (%) and BPS Analysis by Country, 2024 to 2034

Figure 81: South Asia and Pacific Market Y-o-Y Growth (%) Projections by Country, 2024 to 2034

Figure 82: South Asia and Pacific Market Value (US$ Million) Analysis by Mode Of Operation, 2019 to 2034

Figure 83: South Asia and Pacific Market Value Share (%) and BPS Analysis by Mode Of Operation, 2024 to 2034

Figure 84: South Asia and Pacific Market Y-o-Y Growth (%) Projections by Mode Of Operation, 2024 to 2034

Figure 85: South Asia and Pacific Market Value (US$ Million) Analysis by System, 2019 to 2034

Figure 86: South Asia and Pacific Market Value Share (%) and BPS Analysis by System, 2024 to 2034

Figure 87: South Asia and Pacific Market Y-o-Y Growth (%) Projections by System, 2024 to 2034

Figure 88: South Asia and Pacific Market Attractiveness by Mode Of Operation, 2024 to 2034

Figure 89: South Asia and Pacific Market Attractiveness by System, 2024 to 2034

Figure 90: South Asia and Pacific Market Attractiveness by Country, 2024 to 2034

Figure 91: East Asia Market Value (US$ Million) by Mode Of Operation, 2024 to 2034

Figure 92: East Asia Market Value (US$ Million) by System, 2024 to 2034

Figure 93: East Asia Market Value (US$ Million) by Country, 2024 to 2034

Figure 94: East Asia Market Value (US$ Million) Analysis by Country, 2019 to 2034

Figure 95: East Asia Market Value Share (%) and BPS Analysis by Country, 2024 to 2034

Figure 96: East Asia Market Y-o-Y Growth (%) Projections by Country, 2024 to 2034

Figure 97: East Asia Market Value (US$ Million) Analysis by Mode Of Operation, 2019 to 2034

Figure 98: East Asia Market Value Share (%) and BPS Analysis by Mode Of Operation, 2024 to 2034

Figure 99: East Asia Market Y-o-Y Growth (%) Projections by Mode Of Operation, 2024 to 2034

Figure 100: East Asia Market Value (US$ Million) Analysis by System, 2019 to 2034

Figure 101: East Asia Market Value Share (%) and BPS Analysis by System, 2024 to 2034

Figure 102: East Asia Market Y-o-Y Growth (%) Projections by System, 2024 to 2034

Figure 103: East Asia Market Attractiveness by Mode Of Operation, 2024 to 2034

Figure 104: East Asia Market Attractiveness by System, 2024 to 2034

Figure 105: East Asia Market Attractiveness by Country, 2024 to 2034

Figure 106: Middle East and Africa Market Value (US$ Million) by Mode Of Operation, 2024 to 2034

Figure 107: Middle East and Africa Market Value (US$ Million) by System, 2024 to 2034

Figure 108: Middle East and Africa Market Value (US$ Million) by Country, 2024 to 2034

Figure 109: Middle East and Africa Market Value (US$ Million) Analysis by Country, 2019 to 2034

Figure 110: Middle East and Africa Market Value Share (%) and BPS Analysis by Country, 2024 to 2034

Figure 111: Middle East and Africa Market Y-o-Y Growth (%) Projections by Country, 2024 to 2034

Figure 112: Middle East and Africa Market Value (US$ Million) Analysis by Mode Of Operation, 2019 to 2034

Figure 113: Middle East and Africa Market Value Share (%) and BPS Analysis by Mode Of Operation, 2024 to 2034

Figure 114: Middle East and Africa Market Y-o-Y Growth (%) Projections by Mode Of Operation, 2024 to 2034

Figure 115: Middle East and Africa Market Value (US$ Million) Analysis by System, 2019 to 2034

Figure 116: Middle East and Africa Market Value Share (%) and BPS Analysis by System, 2024 to 2034

Figure 117: Middle East and Africa Market Y-o-Y Growth (%) Projections by System, 2024 to 2034

Figure 118: Middle East and Africa Market Attractiveness by Mode Of Operation, 2024 to 2034

Figure 119: Middle East and Africa Market Attractiveness by System, 2024 to 2034

Figure 120: Middle East and Africa Market Attractiveness by Country, 2024 to 2034

Recommendations

Healthcare

Interventional Cardiology Devices Market

Published : October 2022

Healthcare

Clinical Information System Market

Published : June 2022

Explore Healthcare Insights

View Reports

Cardiology Information System Market