This site uses cookies, including third-party cookies, that help us to provide and improve our services.

Privacy Policy
- Global Locations -
Headquarters
Future Market Insights, Inc.
Christiana Corporate, 200 Continental Drive, Suite 401, Newark, Delaware - 19713, United States
T: +1-845-579-5705
MEA
Market Access DMCC

1602-6 Jumeirah Bay X2 Tower, Plot No: JLT-PH2-X2A,

Jumeirah Lakes Towers, Dubai,

United Arab Emirates

Americas
Future Market Insights
616 Corporate Way, Suite 2-9018,
Valley Cottage, NY 10989,
United States
T: +1-347-918-3531
Europe
Future Market Insights
3rd Floor, 207 Regent Street,
London W1B 3HH
United Kingdom
T: + 44 (0) 20 8123 9659
D: +44 (0) 20 3287 4268
APAC
Future Market Insights
Office No. 401-A, 4th Floor,
VANTAGE 9, S.No. 36/1/1,
Baner, Pune 411045 India

Radio Frequency Identification Market

RFID Technology to become the New Regulator of All Commercial Activities. FMI Finds their Competence in Present Times

Radio Frequency Identification Market by Component, Application & Region | Forecast 2023 to 2033

Radio Frequency Identification Market Snapshot (2023 to 2033)

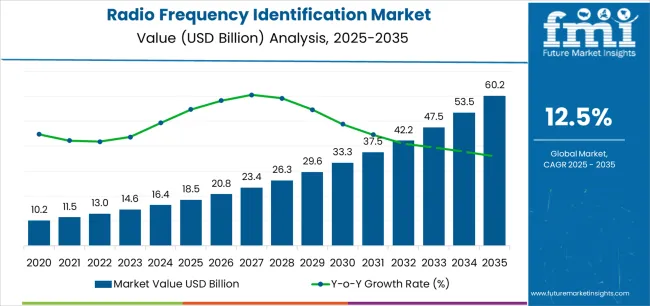
Future Market Insights (FMI) has projected the global Radio Frequency Identification (RFID) market size to reach US$ 25.9 Billion in 2023. With a favorable demand outlook, sales are forecast to increase at an impressive 16.8% CAGR, reaching US$ 122.6 Billion by 2033.

Increasing the adoption of RFID tags in the manufacturing sector for asset management and quality control is expected to boost the market. Besides this, higher demand for contact tracing driven after the outbreak of COVID-19 has pushed the adoption of radio frequency identification services in the world. Such advancements have provided immense opportunity for the Radio Frequency Identification (RFID) market in the healthcare sector.

The increasing focus on security and management of assets in the retail, healthcare, and automotive sectors also will create growth opportunities. As per FMI, sales of radio frequency identification are projected to represent 55% of the global asset tracking market share in 2023.

RFID technology has progressed from detecting tags from a short distance up to a distance exceeding 100 meters nowadays. For instance, active RFID tag types are utilized to track not just stationary assets but can also detect moving objects and employees in real time.

The recent emergence of portable RFID readers or sled readers has expanded the possibilities of RFID technologies. It has allowed for more convenient vehicle tracking and monitoring at a lower cost, consequently increasing its demand in the transport sector.

Following recent technical developments and improvements, the earlier passive ultra-high frequency band of 860 to 960 MHz has now been further formed into a new band dubbed RAIN RFID. It is now the most widely used RFID frequency in the market and has expanded the RFID market to reach many vendors in the existing ecosystem.

Attribute

Details

Radio Frequency Identification Market Estimated Size 2023

US$ 25.9 Billion

Radio Frequency Identification Market Value-based CAGR (2023 to 2033)

~16.8%

Radio Frequency Identification Market Projected Size in 2033

US$ 122.6 Billion

Customize this Report

Let us know your requirement to get
100% FREE customization

How The Market Progressed Till June 2022?

Market Statistics

Details

H1,2021 (A)

14.4%

H1,2022 Projected (P)

13.7%

H1,2022 Outlook (O)

14.8%

BPS Change : H1,2022 (O) - H1,2022 (P)

(+) 110 ↑

BPS Change : H1,2022 (O) - H1,2021 (A)

(+) 40 ↑

Radio frequency identification is a particular kind of radio technology that utilizes radio waves to track tags attached to an object and therefore identify the object. Radio frequency identification technology is an important tool for logistical applications and is being utilized to enhance supply chains and production procedures across various industries.

According to the Future Market Insights analysis, the BPS values interpreted in the RFID market in H1,2022-(O) (Outlook) over H1,2022 (P) showed a growth of +110 units. The BPS change: H1, 2022 (O) over H1,2021 (A) showed growth of +40 units.

The crucial reason for this growth of BPS values is the growing concentration on security and management of assets in the healthcare, retail, and automotive sectors, which is creating opportunities for the RFID market growth. Thus, the benefits offered by radio frequency identification technology, such as asset tracking and monitoring, are driving the market growth positively.

Radio Frequency Identification Market 2017 to 2022 Outlook in Comparison to 2023 to 2033 Growth Forecast

Demand for RFID systems and software is projected to grow at a 16.8% CAGR, in comparison with the 11.% CAGR registered between 2017 and 2022, as per FMI.

Growth of the market is expected to be driven by rising demand for supply chain management and asset management solutions in the retail, automotive, and manufacturing sectors. In the healthcare sector, the increasing adoption of RFID tags for medical equipment management will continue augmenting the growth of the market in the forthcoming years.

Besides this, RFID technologies are widely being adopted in the aviation industry, especially in Airbus, Boing, and other defense aircraft, for improving supply chain visibility, work-in-progress tracking (WIP), and logistics management.

In response to growing demand, manufacturers are focusing on the integration of connective technologies such as the Internet of Things (IoT) to facilitate the optimal identification of assets in real-time locations. Such developments are indicative of lucrative prospects for players in the market.

Sudip Saha
Sudip Saha
Principal Consultant
LinkedIn
Talk to Analyst

Find your sweet spots for generating winning opportunities in this market.

Talk to Analyst

How Are Ongoing Advancements in RFID Technology Impacting Sales?

The structure and functioning of RFID tags make them uniquely versatile, but new integrations in this technology are making them more acceptable and adaptable in a variety of end-use sectors.

In the manufacturing sector, warehouse management systems (WMS) based on RFID are being used, thereby improving the traceability and precision in operations ranging from picking to delivery.

With the integration of IoT, RFID solutions can be turned into smart sensors, enabling manufacturers to track temperature, real-time location, and other aspects that influence supply chain management.

Earlier, manufacturers avoided active solutions due to limited shelf life and high costs. Thanks to recent developments in battery performance, active RFID is being adopted as they offer greater accuracy in long-range monitoring.

This has emerged as a key factor encouraging their applications in the healthcare sector for equipment management and maintaining strict access control. Also, mobility is one of the key advantages offered by RFID systems. To improve this aspect, manufacturers are integrating cloud-based data storage systems, making them an integral component of RFID technology.

When stored in the cloud, real-time data becomes more accessible and manageable, which in turn enhances stock accuracy, replenishment, and product availability. Cloud systems can potentially streamline processes in all areas of the supply chain, thereby enhancing productivity and accuracy in warehouses, IT departments, and other end-use sectors.

Backed by the aforementioned factors, sales of RFID are expected to gain traction at a considerable pace over the assessment period, opines FMI.

Country-wise Analysis

Countries

CAGR (2023 to 2033)

USA

11.5%

UK

17.8%

Germany

12.7%

China

22.5%

India

22.9%

The USA Radio Frequency Identification Market is striving to compete with China

Attributes

Details

Market Size (2033)

US$ 14.9 Billion

Market Absolute Dollar Growth (US$ Million/Billion)

US$ 9.9 Billion

Growing demand for effective asset management in the retail and healthcare sectors in the USA is propelling sales in the country, placing it as a dominant market in North America. The USA is home to a robust retail sector, global housing apparel, and consumer products brands.

Increasing focus on improving asset management in this sector will continue pushing sales. Prices and details of products with RFID tags are automatically recorded when the customer approaches the billing counter, which saves time and improves productivity in the retail sector.

In addition to this, the growing adoption of RFID tags in the aviation sector in the USA is expected to bode well for the market. These tags are being used in the aviation sector for the management of luggage, logistics, and other transportation equipment to facilitate timely delivery and avoid misplacement.

Against this backdrop, demand in the USA market is expected to gain traction over the assessment period.

China Radio Frequency Identification Market to remain Lucrative for Global Players

Attributes

Details

Market Size (2033)

US$ 30.3 Billion

Market Absolute Dollar Growth (US$ Million/Billion)

US$ 26.3 Billion

The ongoing expansion of the healthcare and automotive sectors in China is expected to boost the market in the forthcoming years. As per FMI, China is expected to command the lion’s share in the East Asia market over the assessment period.

China is one of the largest automotive markets in the world. Applications of RFID tags in the automotive sector can improve vehicle identification and dealership. Through these tags, real-time status and location of vehicles can be acquired, which is a much-desired solution in the automotive sector.

Using RFID tags also improves productivity in automotive dealerships by reducing errors and offering remote data access in real-time. Favored by these factors, sales in the China market are projected to remain high over the forecast period.

UK Radio Frequency Market to Cater to the needs of Other European Countries

Attributes

Details

Market Size (2033)

US$ 7.3 Billion

Market Absolute Dollar Growth (US$ Million/Billion)

US$ 5.9 Billion

Increasing the adoption of RFID tags in vehicles for automated toll deduction on highways and roadways is propelling sales in the market. This is expected to place the UK as a lucrative pocket in the Europe market.

Increasing international tourism in the country is another factor spurring demand for RFID. In the aviation and hospitality sectors, these tags are actively being adopted to keep track of luggage, passenger information, and other elements to improve the security and accommodation of goods and packages. This is expected to continue boosting the UK market in the forthcoming years.

MarketNage
Become a MarketNgage Insider

A unified Market Research Subscription Platform, built for today's disparate research needs.

Comparative View of Adjacent Market

Radio Frequency Identification (RFID) Market:

Attributes

Radio Frequency Identification (RFID) Market

CAGR (2023 to 2033)

16.8%

Market Value (2023)

US$ 25.9 Billion

Growth Factor

The growing use of RFID products in many new applications

Future Opportunities

Recent advancements in RFID solutions and their uses

Market Trends

Offering affordable machinery and RFID readers to the users

Near Field Communication (NFC) Market:

Attributes

Near Field Communication (NFC) Market

CAGR (2023 to 2033)

15%

Market Value (2023)

US$ 20.5 Billion

Growth Factor

Rising use of mobile Payments systems for retailing segment

Future Opportunities

Expansion of digital literacy around the world

Market Trends

Strategic collaboration with online payment gateways.

Network File System (NFS) Market:

Attributes

Network File System (NFS) Market

CAGR (2023 to 2033)

14.2%

Market Value (2023)

US$ 4 Billion

Growth Factor

Digitization of most types of businesses and services

Future Opportunities

The rapid development of emerging economies with industries

Market Trends

Service providers are retaining end users by subscription model

Entry of Many Regional Players has Severely Fragmented the Market

As per the market analysis report of FMI, the Radio Frequency Identification technology is predicted to advance significantly over the coming years. This development is predicted owing to increased market competition and the availability of premium RFID solutions internationally.

Leading players operating in the global radiofrequency identification market are focusing on research and development to launch innovative products, thereby diversifying their product portfolios. In addition to this, players are investing in mergers, acquisitions, and collaborations to gain a competitive edge in the market.

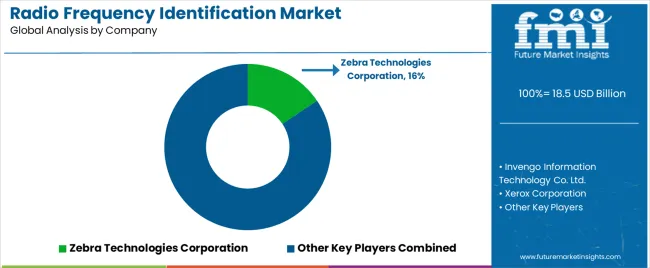
In December 2021, Zebra Technologies Corporation announced that Crystal, a Colombina retailer and owner of popular brands Punto Blanco, Glax, Gef, and Babyfresh has selected the company’s RFID solutions to enable accurate and fast omnichannel sales while minimizing safety overstocks.

Scope of Report

Attribute

Details

Forecast Period

2017 to 2022

Historical Data Available for

2023 to 2033

Market Analysis

Units for Volume and US$ Million for Value

Key Regions Covered

North America, Latin America, Europe, East Asia, South Asia, Oceania, and MEA

Key Countries Covered

United States of America, Canada, Brazil, Mexico, Germany, the UK, France, Italy, Spain, Nordic, Russia, Poland, China, India, Thailand, Indonesia, Australia and New Zealand, Japan, GCC countries, North Africa, South Africa, and others.

Key Market Segments Covered

Component, Applications, and Region

Key Companies Profiled

Pricing

Available upon Request

Radio Frequency Identification Market by Category

Component:

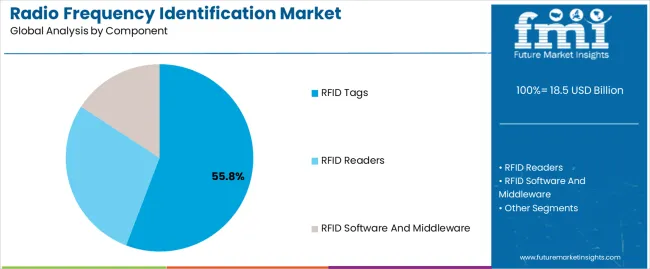
  • RFID Tags
    • Low Frequency (LF)
    • High Frequency (HF)
    • Ultra-High Frequency (UHF)
    • Microwave Frequency
    • Ultra-Wideband (UWB)
  • RFID Readers
  • RFID Software and Middleware

Applications:

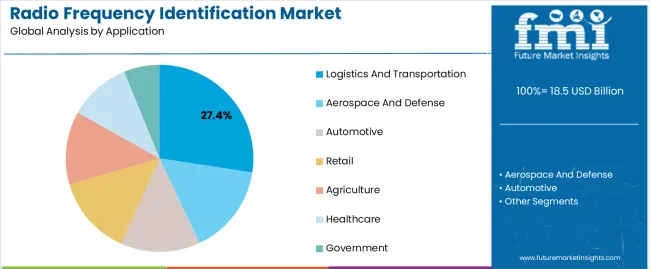
  • Logistics and Transportation
  • Aerospace and Defense
  • Automotive
  • Retail and Consumer Goods
  • Agriculture
  • Healthcare
  • Government

Region:

  • North America
  • Latin America
  • Europe
  • East Asia
  • South Asia
  • Oceania
  • Middle East & Africa

Frequently Asked Questions

The global radio frequency identification market is to grow at 16.8% during the forecast period.

The global radio frequency identification market is predicted to be valued at US$ 122.6 Billion by 2033.

The global radio frequency identification market was valued at US$ 22.6 Billion in 2022.

China accounts for the largest revenue share of the global radio frequency identification market

India is predicted to register a CAGR of 22.9% in the radio frequency identification market.

Table of Content

1. Executive Summary | Radio Frequency Identification Market

    1.1. Global Market Outlook

    1.2. Demand-side Trends

    1.3. Supply-side Trends

    1.4. Technology Roadmap Analysis

    1.5. Analysis and Recommendations

2. Market Overview

    2.1. Market Coverage / Taxonomy

    2.2. Market Definition / Scope / Limitations

3. Market Background

    3.1. Market Dynamics

        3.1.1. Drivers

        3.1.2. Restraints

        3.1.3. Opportunity

        3.1.4. Trends

    3.2. Scenario Forecast

        3.2.1. Demand in Optimistic Scenario

        3.2.2. Demand in Likely Scenario

        3.2.3. Demand in Conservative Scenario

    3.3. Opportunity Map Analysis

    3.4. Investment Feasibility Matrix

    3.5. PESTLE and Porter’s Analysis

    3.6. Regulatory Landscape

        3.6.1. By Key Regions

        3.6.2. By Key Countries

    3.7. Regional Parent Market Outlook

4. Global Market Analysis 2017 to 2022 and Forecast, 2023 to 2033

    4.1. Historical Market Size Value (US$ Billion) Analysis, 2017 to 2022

    4.2. Current and Future Market Size Value (US$ Billion) Projections, 2023 to 2033

        4.2.1. Y-o-Y Growth Trend Analysis

        4.2.2. Absolute $ Opportunity Analysis

5. Global Market Analysis 2017 to 2022 and Forecast 2023 to 2033, By Component

    5.1. Introduction / Key Findings

    5.2. Historical Market Size Value (US$ Billion) Analysis By Component, 2017 to 2022

    5.3. Current and Future Market Size Value (US$ Billion) Analysis and Forecast By Component, 2023 to 2033

        5.3.1. Tags

            5.3.1.1. Low Frequency

            5.3.1.2. High Frequency

            5.3.1.3. Ultra-High Frequency

            5.3.1.4. Microwave Frequency

            5.3.1.5. Ultra-Wideband

        5.3.2. Readers

        5.3.3. Software and Middleware

    5.4. Y-o-Y Growth Trend Analysis By Component, 2017 to 2022

    5.5. Absolute $ Opportunity Analysis By Component, 2023 to 2033

6. Global Market Analysis 2017 to 2022 and Forecast 2023 to 2033, By Applications

    6.1. Introduction / Key Findings

    6.2. Historical Market Size Value (US$ Billion) Analysis By Applications, 2017 to 2022

    6.3. Current and Future Market Size Value (US$ Billion) Analysis and Forecast By Applications, 2023 to 2033

        6.3.1. Logistics and Transportation

        6.3.2. Aerospace and Defense

        6.3.3. Automotive

        6.3.4. Retail and Consumer Goods

        6.3.5. Agriculture

        6.3.6. Healthcare

        6.3.7. Government

        6.3.8. Other Applications

    6.4. Y-o-Y Growth Trend Analysis By Applications, 2017 to 2022

    6.5. Absolute $ Opportunity Analysis By Applications, 2023 to 2033

7. Global Market Analysis 2017 to 2022 and Forecast 2023 to 2033, By Region

    7.1. Introduction

    7.2. Historical Market Size Value (US$ Billion) Analysis By Region, 2017 to 2022

    7.3. Current Market Size Value (US$ Billion) Analysis and Forecast By Region, 2023 to 2033

        7.3.1. North America

        7.3.2. Latin America

        7.3.3. Eastern Europe

        7.3.4. Western Europe

        7.3.5. Japan

        7.3.6. Middle East and Africa (MEA)

        7.3.7. Asia-Pacific excluding Japan (APEJ)

    7.4. Market Attractiveness Analysis By Region

8. North America Market Analysis 2017 to 2022 and Forecast 2023 to 2033, By Country

    8.1. Historical Market Size Value (US$ Billion) Trend Analysis By Market Taxonomy, 2017 to 2022

    8.2. Market Size Value (US$ Billion) Forecast By Market Taxonomy, 2023 to 2033

        8.2.1. By Country

            8.2.1.1. United States of America

            8.2.1.2. Canada

        8.2.2. By Component

        8.2.3. By Applications

    8.3. Market Attractiveness Analysis

        8.3.1. By Country

        8.3.2. By Component

        8.3.3. By Applications

    8.4. Key Takeaways

9. Latin America Market Analysis 2017 to 2022 and Forecast 2023 to 2033, By Country

    9.1. Historical Market Size Value (US$ Billion) Trend Analysis By Market Taxonomy, 2017 to 2022

    9.2. Market Size Value (US$ Billion) Forecast By Market Taxonomy, 2023 to 2033

        9.2.1. By Country

            9.2.1.1. Brazil

            9.2.1.2. Mexico

            9.2.1.3. Rest of Latin America

        9.2.2. By Component

        9.2.3. By Applications

    9.3. Market Attractiveness Analysis

        9.3.1. By Country

        9.3.2. By Component

        9.3.3. By Applications

    9.4. Key Takeaways

10. Eastern Europe Market Analysis 2017 to 2022 and Forecast 2023 to 2033, By Country

    10.1. Historical Market Size Value (US$ Billion) Trend Analysis By Market Taxonomy, 2017 to 2022

    10.2. Market Size Value (US$ Billion) Forecast By Market Taxonomy, 2023 to 2033

        10.2.1. By Country

            10.2.1.1. Poland

            10.2.1.2. Russia

            10.2.1.3. Rest of Eastern Europe

        10.2.2. By Component

        10.2.3. By Applications

    10.3. Market Attractiveness Analysis

        10.3.1. By Country

        10.3.2. By Component

        10.3.3. By Applications

    10.4. Key Takeaways

11. Western Europe Market Analysis 2017 to 2022 and Forecast 2023 to 2033, By Country

    11.1. Historical Market Size Value (US$ Billion) Trend Analysis By Market Taxonomy, 2017 to 2022

    11.2. Market Size Value (US$ Billion) Forecast By Market Taxonomy, 2023 to 2033

        11.2.1. By Country

            11.2.1.1. Germany

            11.2.1.2. Italy

            11.2.1.3. France

            11.2.1.4. United Kingdom

            11.2.1.5. Spain

            11.2.1.6. BENELUX

            11.2.1.7. Rest of Western Europe

        11.2.2. By Component

        11.2.3. By Applications

    11.3. Market Attractiveness Analysis

        11.3.1. By Country

        11.3.2. By Component

        11.3.3. By Applications

    11.4. Key Takeaways

12. Japan Market Analysis 2017 to 2022 and Forecast 2023 to 2033, By Country

    12.1. Historical Market Size Value (US$ Billion) Trend Analysis By Market Taxonomy, 2017 to 2022

    12.2. Market Size Value (US$ Billion) Forecast By Market Taxonomy, 2023 to 2033

        12.2.1. By Country

            12.2.1.1. Japan

        12.2.2. By Component

        12.2.3. By Applications

    12.3. Market Attractiveness Analysis

        12.3.1. By Country

        12.3.2. By Component

        12.3.3. By Applications

    12.4. Key Takeaways

13. MEA Market Analysis 2017 to 2022 and Forecast 2023 to 2033, By Country

    13.1. Historical Market Size Value (US$ Billion) Trend Analysis By Market Taxonomy, 2017 to 2022

    13.2. Market Size Value (US$ Billion) Forecast By Market Taxonomy, 2023 to 2033

        13.2.1. By Country

            13.2.1.1. GCC Countries

            13.2.1.2. Turkey

            13.2.1.3. Northern Africa

            13.2.1.4. South Africa

            13.2.1.5. Rest of MEA

        13.2.2. By Component

        13.2.3. By Applications

    13.3. Market Attractiveness Analysis

        13.3.1. By Country

        13.3.2. By Component

        13.3.3. By Applications

    13.4. Key Takeaways

14. APEJ Market Analysis 2017 to 2022 and Forecast 2023 to 2033, By Country

    14.1. Historical Market Size Value (US$ Billion) Trend Analysis By Market Taxonomy, 2017 to 2022

    14.2. Market Size Value (US$ Billion) Forecast By Market Taxonomy, 2023 to 2033

        14.2.1. By Country

            14.2.1.1. ASEAN

            14.2.1.2. Australia & New Zealand

            14.2.1.3. India

            14.2.1.4. China

            14.2.1.5. Rest of APEJ

        14.2.2. By Component

        14.2.3. By Applications

    14.3. Market Attractiveness Analysis

        14.3.1. By Country

        14.3.2. By Component

        14.3.3. By Applications

    14.4. Key Takeaways

15. Key Countries Market Analysis

    15.1. United States of America

        15.1.1. Pricing Analysis

        15.1.2. Market Share Analysis, 2022

            15.1.2.1. By Component

            15.1.2.2. By Applications

    15.2. Canada

        15.2.1. Pricing Analysis

        15.2.2. Market Share Analysis, 2022

            15.2.2.1. By Component

            15.2.2.2. By Applications

    15.3. Brazil

        15.3.1. Pricing Analysis

        15.3.2. Market Share Analysis, 2022

            15.3.2.1. By Component

            15.3.2.2. By Applications

    15.4. Mexico

        15.4.1. Pricing Analysis

        15.4.2. Market Share Analysis, 2022

            15.4.2.1. By Component

            15.4.2.2. By Applications

    15.5. Poland

        15.5.1. Pricing Analysis

        15.5.2. Market Share Analysis, 2022

            15.5.2.1. By Component

            15.5.2.2. By Applications

    15.6. Russia

        15.6.1. Pricing Analysis

        15.6.2. Market Share Analysis, 2022

            15.6.2.1. By Component

            15.6.2.2. By Applications

    15.7. Germany

        15.7.1. Pricing Analysis

        15.7.2. Market Share Analysis, 2022

            15.7.2.1. By Component

            15.7.2.2. By Applications

    15.8. Italy

        15.8.1. Pricing Analysis

        15.8.2. Market Share Analysis, 2022

            15.8.2.1. By Component

            15.8.2.2. By Applications

    15.9. France

        15.9.1. Pricing Analysis

        15.9.2. Market Share Analysis, 2022

            15.9.2.1. By Component

            15.9.2.2. By Applications

    15.10. United Kingdom

        15.10.1. Pricing Analysis

        15.10.2. Market Share Analysis, 2022

            15.10.2.1. By Component

            15.10.2.2. By Applications

    15.11. Spain

        15.11.1. Pricing Analysis

        15.11.2. Market Share Analysis, 2022

            15.11.2.1. By Component

            15.11.2.2. By Applications

    15.12. BENELUX

        15.12.1. Pricing Analysis

        15.12.2. Market Share Analysis, 2022

            15.12.2.1. By Component

            15.12.2.2. By Applications

    15.13. Japan

        15.13.1. Pricing Analysis

        15.13.2. Market Share Analysis, 2022

            15.13.2.1. By Component

            15.13.2.2. By Applications

    15.14. GCC Countries

        15.14.1. Pricing Analysis

        15.14.2. Market Share Analysis, 2022

            15.14.2.1. By Component

            15.14.2.2. By Applications

    15.15. Turkey

        15.15.1. Pricing Analysis

        15.15.2. Market Share Analysis, 2022

            15.15.2.1. By Component

            15.15.2.2. By Applications

    15.16. Northern Africa

        15.16.1. Pricing Analysis

        15.16.2. Market Share Analysis, 2022

            15.16.2.1. By Component

            15.16.2.2. By Applications

    15.17. South Africa

        15.17.1. Pricing Analysis

        15.17.2. Market Share Analysis, 2022

            15.17.2.1. By Component

            15.17.2.2. By Applications

    15.18. ASIAN

        15.18.1. Pricing Analysis

        15.18.2. Market Share Analysis, 2022

            15.18.2.1. By Component

            15.18.2.2. By Applications

    15.19. Australia & New Zealand

        15.19.1. Pricing Analysis

        15.19.2. Market Share Analysis, 2022

            15.19.2.1. By Component

            15.19.2.2. By Applications

    15.20. India

        15.20.1. Pricing Analysis

        15.20.2. Market Share Analysis, 2022

            15.20.2.1. By Component

            15.20.2.2. By Applications

    15.21. China

        15.21.1. Pricing Analysis

        15.21.2. Market Share Analysis, 2022

            15.21.2.1. By Component

            15.21.2.2. By Applications

16. Market Structure Analysis

    16.1. Competition Dashboard

    16.2. Competition Benchmarking

    16.3. Market Share Analysis of Top Players

        16.3.1. By Regional

        16.3.2. By Component

        16.3.3. By Applications

17. Competition Analysis

    17.1. Competition Deep Dive

        17.1.1. Zebra Technologies Corporation

            17.1.1.1. Overview

            17.1.1.2. Product Portfolio

            17.1.1.3. Profitability by Market Segments

            17.1.1.4. Sales Footprint

            17.1.1.5. Strategy Overview

                17.1.1.5.1. Marketing Strategy

        17.1.2. Invengo Information Technology Co. Ltd.

            17.1.2.1. Overview

            17.1.2.2. Product Portfolio

            17.1.2.3. Profitability by Market Segments

            17.1.2.4. Sales Footprint

            17.1.2.5. Strategy Overview

                17.1.2.5.1. Marketing Strategy

        17.1.3. Xerox Corporation

            17.1.3.1. Overview

            17.1.3.2. Product Portfolio

            17.1.3.3. Profitability by Market Segments

            17.1.3.4. Sales Footprint

            17.1.3.5. Strategy Overview

                17.1.3.5.1. Marketing Strategy

        17.1.4. Thin Film Electronics ASA

            17.1.4.1. Overview

            17.1.4.2. Product Portfolio

            17.1.4.3. Profitability by Market Segments

            17.1.4.4. Sales Footprint

            17.1.4.5. Strategy Overview

                17.1.4.5.1. Marketing Strategy

        17.1.5. HID Global Corporation

            17.1.5.1. Overview

            17.1.5.2. Product Portfolio

            17.1.5.3. Profitability by Market Segments

            17.1.5.4. Sales Footprint

            17.1.5.5. Strategy Overview

                17.1.5.5.1. Marketing Strategy

        17.1.6. GAO RFID Inc.

            17.1.6.1. Overview

            17.1.6.2. Product Portfolio

            17.1.6.3. Profitability by Market Segments

            17.1.6.4. Sales Footprint

            17.1.6.5. Strategy Overview

                17.1.6.5.1. Marketing Strategy

        17.1.7. Impinj, Inc.

            17.1.7.1. Overview

            17.1.7.2. Product Portfolio

            17.1.7.3. Profitability by Market Segments

            17.1.7.4. Sales Footprint

            17.1.7.5. Strategy Overview

                17.1.7.5.1. Marketing Strategy

        17.1.8. Alien Technology

            17.1.8.1. Overview

            17.1.8.2. Product Portfolio

            17.1.8.3. Profitability by Market Segments

            17.1.8.4. Sales Footprint

            17.1.8.5. Strategy Overview

                17.1.8.5.1. Marketing Strategy

        17.1.9. Omni-ID, Ltd.

            17.1.9.1. Overview

            17.1.9.2. Product Portfolio

            17.1.9.3. Profitability by Market Segments

            17.1.9.4. Sales Footprint

            17.1.9.5. Strategy Overview

                17.1.9.5.1. Marketing Strategy

        17.1.10. Molex Inc.

            17.1.10.1. Overview

            17.1.10.2. Product Portfolio

            17.1.10.3. Profitability by Market Segments

            17.1.10.4. Sales Footprint

            17.1.10.5. Strategy Overview

                17.1.10.5.1. Marketing Strategy

18. Assumptions & Acronyms Used

19. Research Methodology
Customize this Report

Let us know your requirement to get
100% FREE customization

List of Tables

Table 1: Global Market Value (US$ Billion) Forecast by Region, 2017 to 2033

Table 2: Global Market Value (US$ Billion) Forecast by Component, 2017 to 2033

Table 3: Global Market Value (US$ Billion) Forecast by Applications, 2017 to 2033

Table 4: North America Market Value (US$ Billion) Forecast by Country, 2017 to 2033

Table 5: North America Market Value (US$ Billion) Forecast by Component, 2017 to 2033

Table 6: North America Market Value (US$ Billion) Forecast by Applications, 2017 to 2033

Table 7: Latin America Market Value (US$ Billion) Forecast by Country, 2017 to 2033

Table 8: Latin America Market Value (US$ Billion) Forecast by Component, 2017 to 2033

Table 9: Latin America Market Value (US$ Billion) Forecast by Applications, 2017 to 2033

Table 10: Eastern Europe Market Value (US$ Billion) Forecast by Country, 2017 to 2033

Table 11: Eastern Europe Market Value (US$ Billion) Forecast by Component, 2017 to 2033

Table 12: Eastern Europe Market Value (US$ Billion) Forecast by Applications, 2017 to 2033

Table 13: Western Europe Market Value (US$ Billion) Forecast by Country, 2017 to 2033

Table 14: Western Europe Market Value (US$ Billion) Forecast by Component, 2017 to 2033

Table 15: Western Europe Market Value (US$ Billion) Forecast by Applications, 2017 to 2033

Table 16: Japan Market Value (US$ Billion) Forecast by Country, 2017 to 2033

Table 17: Japan Market Value (US$ Billion) Forecast by Component, 2017 to 2033

Table 18: Japan Market Value (US$ Billion) Forecast by Applications, 2017 to 2033

Table 19: MEA Market Value (US$ Billion) Forecast by Country, 2017 to 2033

Table 20: MEA Market Value (US$ Billion) Forecast by Component, 2017 to 2033

Table 21: MEA Market Value (US$ Billion) Forecast by Applications, 2017 to 2033

Table 22: APEJ Market Value (US$ Billion) Forecast by Country, 2017 to 2033

Table 23: APEJ Market Value (US$ Billion) Forecast by Component, 2017 to 2033

Table 24: APEJ Market Value (US$ Billion) Forecast by Applications, 2017 to 2033
Sudip Saha
Principal Consultant
LinkedIn
Talk to Analyst

Find your sweet spots for generating winning opportunities in this market.

Talk to Analyst

List of Charts

Figure 1: Global Market Value (US$ Billion) by Component, 2023 to 2033

Figure 2: Global Market Value (US$ Billion) by Applications, 2023 to 2033

Figure 3: Global Market Value (US$ Billion) by Region, 2023 to 2033

Figure 4: Global Market Value (US$ Billion) Analysis by Region, 2017 to 2033

Figure 5: Global Market Value Share (%) and BPS Analysis by Region, 2023 to 2033

Figure 6: Global Market Y-o-Y Growth (%) Projections by Region, 2023 to 2033

Figure 7: Global Market Value (US$ Billion) Analysis by Component, 2017 to 2033

Figure 8: Global Market Value Share (%) and BPS Analysis by Component, 2023 to 2033

Figure 9: Global Market Y-o-Y Growth (%) Projections by Component, 2023 to 2033

Figure 10: Global Market Value (US$ Billion) Analysis by Applications, 2017 to 2033

Figure 11: Global Market Value Share (%) and BPS Analysis by Applications, 2023 to 2033

Figure 12: Global Market Y-o-Y Growth (%) Projections by Applications, 2023 to 2033

Figure 13: Global Market Attractiveness by Component, 2023 to 2033

Figure 14: Global Market Attractiveness by Applications, 2023 to 2033

Figure 15: Global Market Attractiveness by Region, 2023 to 2033

Figure 16: North America Market Value (US$ Billion) by Component, 2023 to 2033

Figure 17: North America Market Value (US$ Billion) by Applications, 2023 to 2033

Figure 18: North America Market Value (US$ Billion) by Country, 2023 to 2033

Figure 19: North America Market Value (US$ Billion) Analysis by Country, 2017 to 2033

Figure 20: North America Market Value Share (%) and BPS Analysis by Country, 2023 to 2033

Figure 21: North America Market Y-o-Y Growth (%) Projections by Country, 2023 to 2033

Figure 22: North America Market Value (US$ Billion) Analysis by Component, 2017 to 2033

Figure 23: North America Market Value Share (%) and BPS Analysis by Component, 2023 to 2033

Figure 24: North America Market Y-o-Y Growth (%) Projections by Component, 2023 to 2033

Figure 25: North America Market Value (US$ Billion) Analysis by Applications, 2017 to 2033

Figure 26: North America Market Value Share (%) and BPS Analysis by Applications, 2023 to 2033

Figure 27: North America Market Y-o-Y Growth (%) Projections by Applications, 2023 to 2033

Figure 28: North America Market Attractiveness by Component, 2023 to 2033

Figure 29: North America Market Attractiveness by Applications, 2023 to 2033

Figure 30: North America Market Attractiveness by Country, 2023 to 2033

Figure 31: Latin America Market Value (US$ Billion) by Component, 2023 to 2033

Figure 32: Latin America Market Value (US$ Billion) by Applications, 2023 to 2033

Figure 33: Latin America Market Value (US$ Billion) by Country, 2023 to 2033

Figure 34: Latin America Market Value (US$ Billion) Analysis by Country, 2017 to 2033

Figure 35: Latin America Market Value Share (%) and BPS Analysis by Country, 2023 to 2033

Figure 36: Latin America Market Y-o-Y Growth (%) Projections by Country, 2023 to 2033

Figure 37: Latin America Market Value (US$ Billion) Analysis by Component, 2017 to 2033

Figure 38: Latin America Market Value Share (%) and BPS Analysis by Component, 2023 to 2033

Figure 39: Latin America Market Y-o-Y Growth (%) Projections by Component, 2023 to 2033

Figure 40: Latin America Market Value (US$ Billion) Analysis by Applications, 2017 to 2033

Figure 41: Latin America Market Value Share (%) and BPS Analysis by Applications, 2023 to 2033

Figure 42: Latin America Market Y-o-Y Growth (%) Projections by Applications, 2023 to 2033

Figure 43: Latin America Market Attractiveness by Component, 2023 to 2033

Figure 44: Latin America Market Attractiveness by Applications, 2023 to 2033

Figure 45: Latin America Market Attractiveness by Country, 2023 to 2033

Figure 46: Eastern Europe Market Value (US$ Billion) by Component, 2023 to 2033

Figure 47: Eastern Europe Market Value (US$ Billion) by Applications, 2023 to 2033

Figure 48: Eastern Europe Market Value (US$ Billion) by Country, 2023 to 2033

Figure 49: Eastern Europe Market Value (US$ Billion) Analysis by Country, 2017 to 2033

Figure 50: Eastern Europe Market Value Share (%) and BPS Analysis by Country, 2023 to 2033

Figure 51: Eastern Europe Market Y-o-Y Growth (%) Projections by Country, 2023 to 2033

Figure 52: Eastern Europe Market Value (US$ Billion) Analysis by Component, 2017 to 2033

Figure 53: Eastern Europe Market Value Share (%) and BPS Analysis by Component, 2023 to 2033

Figure 54: Eastern Europe Market Y-o-Y Growth (%) Projections by Component, 2023 to 2033

Figure 55: Eastern Europe Market Value (US$ Billion) Analysis by Applications, 2017 to 2033

Figure 56: Eastern Europe Market Value Share (%) and BPS Analysis by Applications, 2023 to 2033

Figure 57: Eastern Europe Market Y-o-Y Growth (%) Projections by Applications, 2023 to 2033

Figure 58: Eastern Europe Market Attractiveness by Component, 2023 to 2033

Figure 59: Eastern Europe Market Attractiveness by Applications, 2023 to 2033

Figure 60: Eastern Europe Market Attractiveness by Country, 2023 to 2033

Figure 61: Western Europe Market Value (US$ Billion) by Component, 2023 to 2033

Figure 62: Western Europe Market Value (US$ Billion) by Applications, 2023 to 2033

Figure 63: Western Europe Market Value (US$ Billion) by Country, 2023 to 2033

Figure 64: Western Europe Market Value (US$ Billion) Analysis by Country, 2017 to 2033

Figure 65: Western Europe Market Value Share (%) and BPS Analysis by Country, 2023 to 2033

Figure 66: Western Europe Market Y-o-Y Growth (%) Projections by Country, 2023 to 2033

Figure 67: Western Europe Market Value (US$ Billion) Analysis by Component, 2017 to 2033

Figure 68: Western Europe Market Value Share (%) and BPS Analysis by Component, 2023 to 2033

Figure 69: Western Europe Market Y-o-Y Growth (%) Projections by Component, 2023 to 2033

Figure 70: Western Europe Market Value (US$ Billion) Analysis by Applications, 2017 to 2033

Figure 71: Western Europe Market Value Share (%) and BPS Analysis by Applications, 2023 to 2033

Figure 72: Western Europe Market Y-o-Y Growth (%) Projections by Applications, 2023 to 2033

Figure 73: Western Europe Market Attractiveness by Component, 2023 to 2033

Figure 74: Western Europe Market Attractiveness by Applications, 2023 to 2033

Figure 75: Western Europe Market Attractiveness by Country, 2023 to 2033

Figure 76: Japan Market Value (US$ Billion) by Component, 2023 to 2033

Figure 77: Japan Market Value (US$ Billion) by Applications, 2023 to 2033

Figure 78: Japan Market Value (US$ Billion) by Country, 2023 to 2033

Figure 79: Japan Market Value (US$ Billion) Analysis by Country, 2017 to 2033

Figure 80: Japan Market Value Share (%) and BPS Analysis by Country, 2023 to 2033

Figure 81: Japan Market Y-o-Y Growth (%) Projections by Country, 2023 to 2033

Figure 82: Japan Market Value (US$ Billion) Analysis by Component, 2017 to 2033

Figure 83: Japan Market Value Share (%) and BPS Analysis by Component, 2023 to 2033

Figure 84: Japan Market Y-o-Y Growth (%) Projections by Component, 2023 to 2033

Figure 85: Japan Market Value (US$ Billion) Analysis by Applications, 2017 to 2033

Figure 86: Japan Market Value Share (%) and BPS Analysis by Applications, 2023 to 2033

Figure 87: Japan Market Y-o-Y Growth (%) Projections by Applications, 2023 to 2033

Figure 88: Japan Market Attractiveness by Component, 2023 to 2033

Figure 89: Japan Market Attractiveness by Applications, 2023 to 2033

Figure 90: Japan Market Attractiveness by Country, 2023 to 2033

Figure 91: MEA Market Value (US$ Billion) by Component, 2023 to 2033

Figure 92: MEA Market Value (US$ Billion) by Applications, 2023 to 2033

Figure 93: MEA Market Value (US$ Billion) by Country, 2023 to 2033

Figure 94: MEA Market Value (US$ Billion) Analysis by Country, 2017 to 2033

Figure 95: MEA Market Value Share (%) and BPS Analysis by Country, 2023 to 2033

Figure 96: MEA Market Y-o-Y Growth (%) Projections by Country, 2023 to 2033

Figure 97: MEA Market Value (US$ Billion) Analysis by Component, 2017 to 2033

Figure 98: MEA Market Value Share (%) and BPS Analysis by Component, 2023 to 2033

Figure 99: MEA Market Y-o-Y Growth (%) Projections by Component, 2023 to 2033

Figure 100: MEA Market Value (US$ Billion) Analysis by Applications, 2017 to 2033

Figure 101: MEA Market Value Share (%) and BPS Analysis by Applications, 2023 to 2033

Figure 102: MEA Market Y-o-Y Growth (%) Projections by Applications, 2023 to 2033

Figure 103: MEA Market Attractiveness by Component, 2023 to 2033

Figure 104: MEA Market Attractiveness by Applications, 2023 to 2033

Figure 105: MEA Market Attractiveness by Country, 2023 to 2033

Figure 106: APEJ Market Value (US$ Billion) by Component, 2023 to 2033

Figure 107: APEJ Market Value (US$ Billion) by Applications, 2023 to 2033

Figure 108: APEJ Market Value (US$ Billion) by Country, 2023 to 2033

Figure 109: APEJ Market Value (US$ Billion) Analysis by Country, 2017 to 2033

Figure 110: APEJ Market Value Share (%) and BPS Analysis by Country, 2023 to 2033

Figure 111: APEJ Market Y-o-Y Growth (%) Projections by Country, 2023 to 2033

Figure 112: APEJ Market Value (US$ Billion) Analysis by Component, 2017 to 2033

Figure 113: APEJ Market Value Share (%) and BPS Analysis by Component, 2023 to 2033

Figure 114: APEJ Market Y-o-Y Growth (%) Projections by Component, 2023 to 2033

Figure 115: APEJ Market Value (US$ Billion) Analysis by Applications, 2017 to 2033

Figure 116: APEJ Market Value Share (%) and BPS Analysis by Applications, 2023 to 2033

Figure 117: APEJ Market Y-o-Y Growth (%) Projections by Applications, 2023 to 2033

Figure 118: APEJ Market Attractiveness by Component, 2023 to 2033

Figure 119: APEJ Market Attractiveness by Applications, 2023 to 2033

Figure 120: APEJ Market Attractiveness by Country, 2023 to 2033

Need specific information?

Request Customization

Explore Technology Insights

View Reports

Recommendations

Technology

Radio Frequency Integrated Circuit (RFIC) Market

Published : June 2021

Healthcare

Radio Frequency Beauty Equipment Market

Published : December 2016

Google translate

Radio Frequency Identification Market