Radiography Test Equipment Market
Market Insights on Radiography Test Equipment covering sales outlook, demand forecast & up-to-date key trends
Radiography Test Equipment Market by Imaging Methods, Industry & Region - Forecast 2022 - 2032
Radiography Test Equipment Market Snapshot (2022-2032)
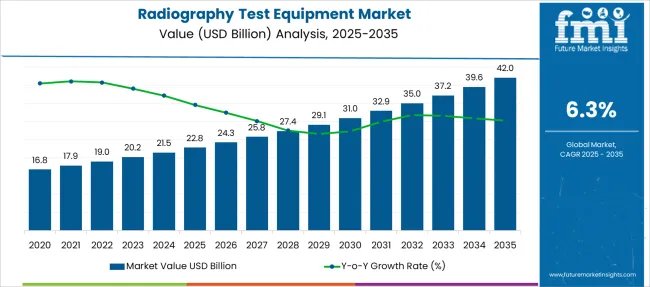
[300 Pages Report] Global radiography test equipment demand is anticipated to be valued at US$ 18 Billion in 2021, forecast to grow at a CAGR of 6.3% to be valued at US$ 35 Billion from 2022 to 2032. Growth is attributed to increasing growth in construction and manufacturing industries coupled with a rising demand for radiography testing equipment for material science research in both developed and developing economies.
Report Attribute |
Details |
Estimated Base Year Value (2021) |
US$ 18 Billion |
Expected Market Value (2022) |
US$ 19 Billion |
Anticipated Forecast Value (2032) |
US$ 35 Billion |
Projected Growth Rate (2022-2032) |
6.3% CAGR |
Radiography test equipment is employed in industrial radiography applications which is the primary driver to the market. With rise in investments in industrial infrastructure, growth is inevitable for radiography test equipment industry.
Radiography test equipment is employed to test material content used in cement, asphalt, bituminous rocks and others. Furthermore, this is considered a prerequisite before engaging in any construction activity. With rise in construction industries and material science labs to conduct testing operations, North America, Europe and Asia pacific is expanding. Radiography uses a safe technique to identify internal flaws such as fissures in the material. Technique involves subjecting the material to an ultrasonic wave passing through it and eliminating the requirement of intrusive destructive testing.
Aging infrastructure coupled with incendiary reactions causing fire eruptions in exploding pipelines and power plant leakages drive the market.
Though market is being pulled down because of high costs of the equipment, lack of experienced technicians and risks of high exposure to radiation have pulled the plugs on the radiography test equipment market.
Let us know your requirement to get
100% FREE customization
Which are Some Prominent Drivers Spearheading Radiography Test Equipment Market Growth?
Radiography test equipment growth lies in demand from aerospace and automotive sectors with safeguards prominent to industry growth. With prevalence of digitalization over analogue systems, the radiography test equipment market is remerging as a key industry in different verticals.
When a robust concrete structure shows anomalies in the grain direction and strength, the radiography test equipment market is a viable solution for detecting the variations likewise. Safeguards to electrical equipment is also exhibiting diverse growth in the market which adds to the market growth of radiography testing equipment market.
Swift development in the manufacturing industry in regional markets including Asia Pacific with countries such as India, China and Japan is driving the radiography test equipment market. The inherent use of radiography equipment in industries such as electronics, pulp and paper and semiconductor for testing equipment and complying with industrial regulations is driving the radiography test equipment market.
Some prominent industrial bodies such as Internal Organization for Standardization (ISO) and American Society of Mechanical Engineering (ASME) have made it mandatory to follow guidelines to maintain instrument safety which drives the growth prospects of radiography test equipment market.
What are the Challenges Faced by the Radiography Test Equipment industry?
The primary challenge the radiography test equipment industry faces is the health constraints associated with exposure to radiation. The other constraints include the dearth of skilled technicians and high cost of radiography test equipment which are major factors causing growth to backfire in the radiography test equipment market.
Find your sweet spots for generating winning opportunities in this market.
Talk to AnalystWhy is Asia Pacific Emerging as an Opportunistic Radiography Test Equipment Market?
Asia Pacific is witnessing overpowering industrial activity in the region with a boom in the manufacturing, energy and power sectors. This has created a rapid penetration in the Asia-Pacific market which is expected to grow at a high CAGR during the forecast period.
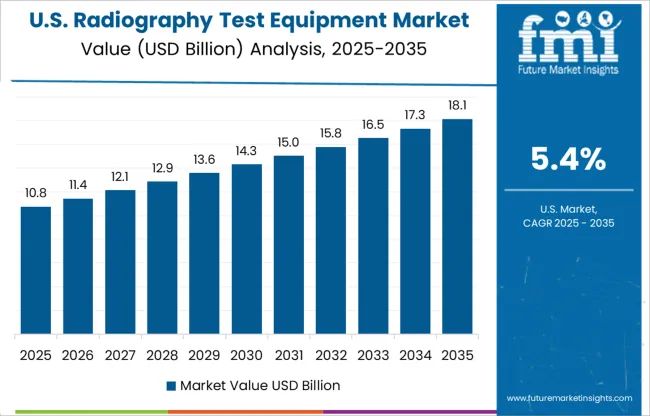
How is North America contributing to Growth of the Radiography Test Equipment Market?
According to Future Market Insights, North America is expected to hold a major market share in terms of value in the radiography test equipment market due to the rapid adoption of radiography test equipment and non-destructive testing technologies across various industries such as automotive and aerospace and defence. Furthermore, the radiography test equipment market in the region benefits from high access to skilled labour in the United States.

An unified Market Research Subscription Platform, built for today’s disparate research needs.
Market Competition
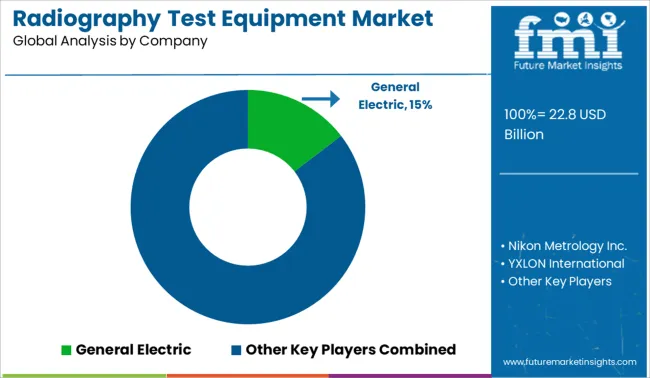
Some of the major players covered in the radiography test equipment market report are Siemens Healthcare GmbH, Jones X-Ray, Inc, Konica Minolta Business Solutions India Private Limited, Euroteck Systems, Multi, Inc, MXR Imaging Inc, Desert Health Imaging Technologies, LLC, FUJIFILM Corporation and Koninklijke Philips N.V, Johnson and Johnson Services, Inc., B. Braun Melsungen AG, MedicalTek Co., Ltd., and Solos Endoscopy, among other domestic and global players
Report Scope
Report Attribute |
Details |
Growth Rate |
CAGR of 6.3% from 2022 to 2032 |
Market Value in 2022 |
US$ 19 Billion |
Market Value in 2032 |
US$ 35 Billion |
Base Year for Estimation |
2021 |
Historical Data |
2015-2021 |
Forecast Period |
2022-2032 |
Quantitative Units |
Revenue in USD Billion, Volume in Kilotons and CAGR from 2022-2032 |
Report Coverage |
Revenue Forecast, Volume Forecast, Company Ranking, Competitive Landscape, Growth Factors, Trends and Pricing Analysis |
Segments Covered |
|
Regions Covered |
|
Key Countries Profiled |
|
Key Companies Profiled |
|
Customization |
Available Upon Request |
Key Segments Profiled in the Radiography Test Equipment Industry Survey
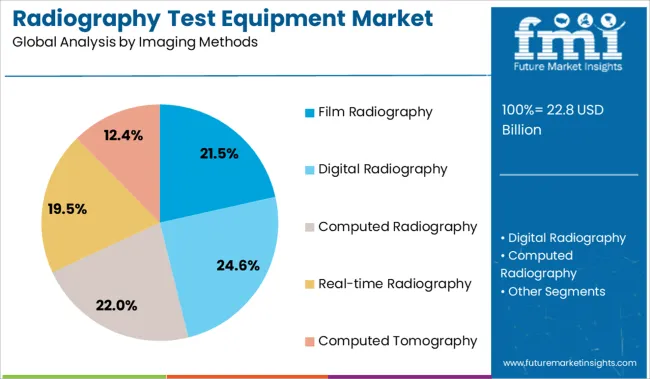
Radiography Test Equipment Market by Imaging Methods:
- Film Radiography Test Equipment
- Digital Radiography Test Equipment
- Computed Radiography Test Equipment
- Real-Time Radiography Test Equipment
- Computed Tomography Radiography Test Equipment
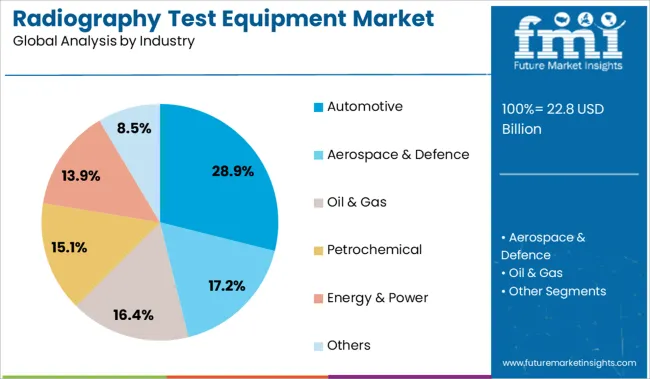
Radiography Test Equipment Market by Industry:
- Radiography Test Equipment for Automotive
- Radiography Test Equipment for Aerospace & Defence
- Radiography Test Equipment for Oil & Gas
- Radiography Test Equipment for Petrochemicals
- Radiography Test Equipment for Energy & Power
- Radiography Test Equipment for Other Industries
Radiography Test Equipment Market by Region:
- North America Radiography Test Equipment Market
- Latin America Radiography Test Equipment Market
- Europe Radiography Test Equipment Market
- East Asia Radiography Test Equipment Market
- South Asia & Pacific Radiography Test Equipment Market
- Middle East & Africa Radiography Test Equipment Market
Frequently Asked Questions
FMI projects the global radiography test equipment market to expand at a 6.3% value CAGR by 2032
Asia Pacific is expected to be the most opportunistic radiography test equipment market expanding at a CAGR
Siemens Healthcare GmbH, Jones X-Ray, Inc, Konica Minolta Business Solutions India Private Limited, Euroteck Systems, are some prominent radiography test equipment manufacturers
1. Executive Summary
1.1. Global Market Outlook
1.2. Demand-side Trends
1.3. Supply-side Trends
1.4. Technology Roadmap Analysis
1.5. Analysis and Recommendations
2. Market Overview
2.1. Market Coverage / Taxonomy
2.2. Market Definition / Scope / Limitations
3. Market Background
3.1. Market Dynamics
3.1.1. Drivers
3.1.2. Restraints
3.1.3. Opportunity
3.1.4. Trends
3.2. Scenario Forecast
3.2.1. Demand in Optimistic Scenario
3.2.2. Demand in Likely Scenario
3.2.3. Demand in Conservative Scenario
3.3. Opportunity Map Analysis
3.4. Product Life Cycle Analysis
3.5. Supply Chain Analysis
3.5.1. Supply Side Participants and their Roles
3.5.1.1. Producers
3.5.1.2. Mid-Level Participants (Traders/ Agents/ Brokers)
3.5.1.3. Wholesalers and Distributors
3.5.2. Value Added and Value Created at Node in the Supply Chain
3.5.3. List of Raw Material Suppliers
3.5.4. List of Existing and Potential Buyer’s
3.6. Investment Feasibility Matrix
3.7. Value Chain Analysis
3.7.1. Profit Margin Analysis
3.7.2. Wholesalers and Distributors
3.7.3. Retailers
3.8. PESTLE and Porter’s Analysis
3.9. Regulatory Landscape
3.9.1. By Key Regions
3.9.2. By Key Countries
3.10. Regional Parent Market Outlook
3.11. Production and Consumption Statistics
3.12. Import and Export Statistics
4. Global Radiography Test Equipment Market Analysis 2017-2021 and Forecast, 2022-2032
4.1. Historical Market Size Value (US$ Mn) & Volume (Units) Analysis, 2017-2021
4.2. Current and Future Market Size Value (US$ Mn) & Volume (Units) Projections, 2022-2032
4.2.1. Y-o-Y Growth Trend Analysis
4.2.2. Absolute $ Opportunity Analysis
5. Global Radiography Test Equipment Market Analysis 2017-2021 and Forecast 2022-2032, By Imaging Methods
5.1. Introduction / Key Findings
5.2. Historical Market Size Value (US$ Mn) & Volume (Units) Analysis By Imaging Methods, 2017-2021
5.3. Current and Future Market Size Value (US$ Mn) & Volume (Units) Analysis and Forecast By Imaging Methods, 2022-2032
5.3.1. Film Radiography
5.3.2. Digital Radiography
5.3.3. Computed Radiography
5.3.4. Real-time Radiography
5.3.5. Computed Tomography
5.4. Y-o-Y Growth Trend Analysis By Imaging Methods, 2017-2021
5.5. Absolute $ Opportunity Analysis By Imaging Methods, 2022-2032
6. Global Radiography Test Equipment Market Analysis 2017-2021 and Forecast 2022-2032, By Industry
6.1. Introduction / Key Findings
6.2. Historical Market Size Value (US$ Mn) & Volume (Units) Analysis By Industry, 2017-2021
6.3. Current and Future Market Size Value (US$ Mn) & Volume (Units) Analysis and Forecast By Industry, 2022-2032
6.3.1. Automotive
6.3.2. Aerospace & Defence
6.3.3. Oil & Gas
6.3.4. Petrochemical
6.3.5. Energy & Power
6.3.6. Others
6.4. Y-o-Y Growth Trend Analysis By Industry, 2017-2021
6.5. Absolute $ Opportunity Analysis By Industry, 2022-2032
7. Global Radiography Test Equipment Market Analysis 2017-2021 and Forecast 2022-2032, By Region
7.1. Introduction
7.2. Historical Market Size Value (US$ Mn) & Volume (Units) Analysis By Region, 2017-2021
7.3. Current Market Size Value (US$ Mn) & Volume (Units) Analysis and Forecast By Region, 2022-2032
7.3.1. North America
7.3.2. Latin America
7.3.3. Europe
7.3.4. East Asia
7.3.5. South Asia & Pacific
7.3.6. MEA
7.4. Market Attractiveness Analysis By Region
8. North America Radiography Test Equipment Market Analysis 2017-2021 and Forecast 2022-2032, By Country
8.1. Historical Market Size Value (US$ Mn) & Volume (Units) Trend Analysis By Market Taxonomy, 2017-2021
8.2. Market Size Value (US$ Mn) & Volume (Units) Forecast By Market Taxonomy, 2022-2032
8.2.1. By Country
8.2.1.1. U.S.
8.2.1.2. Canada
8.2.2. By Imaging Methods
8.2.3. By Industry
8.3. Market Attractiveness Analysis
8.3.1. By Country
8.3.2. By Imaging Methods
8.3.3. By Industry
8.4. Key Takeaways
9. Latin America Radiography Test Equipment Market Analysis 2017-2021 and Forecast 2022-2032, By Country
9.1. Historical Market Size Value (US$ Mn) & Volume (Units) Trend Analysis By Market Taxonomy, 2017-2021
9.2. Market Size Value (US$ Mn) & Volume (Units) Forecast By Market Taxonomy, 2022-2032
9.2.1. By Country
9.2.1.1. Mexico
9.2.1.2. Brazil
9.2.1.3. Rest of Latin America
9.2.2. By Imaging Methods
9.2.3. By Industry
9.3. Market Attractiveness Analysis
9.3.1. By Country
9.3.2. By Imaging Methods
9.3.3. By Industry
9.4. Key Takeaways
10. Europe Radiography Test Equipment Market Analysis 2017-2021 and Forecast 2022-2032, By Country
10.1. Historical Market Size Value (US$ Mn) & Volume (Units) Trend Analysis By Market Taxonomy, 2017-2021
10.2. Market Size Value (US$ Mn) & Volume (Units) Forecast By Market Taxonomy, 2022-2032
10.2.1. By Country
10.2.1.1. Germany
10.2.1.2. Italy
10.2.1.3. France
10.2.1.4. U.K.
10.2.1.5. Spain
10.2.1.6. BENELUX
10.2.1.7. Russia
10.2.1.8. Rest of Europe
10.2.2. By Imaging Methods
10.2.3. By Industry
10.3. Market Attractiveness Analysis
10.3.1. By Country
10.3.2. By Imaging Methods
10.3.3. By Industry
10.4. Key Takeaways
11. East Asia Radiography Test Equipment Market Analysis 2017-2021 and Forecast 2022-2032, By Country
11.1. Historical Market Size Value (US$ Mn) & Volume (Units) Trend Analysis By Market Taxonomy, 2017-2021
11.2. Market Size Value (US$ Mn) & Volume (Units) Forecast By Market Taxonomy, 2022-2032
11.2.1. By Country
11.2.1.1. China
11.2.1.2. Japan
11.2.1.3. South Korea
11.2.2. By Imaging Methods
11.2.3. By Industry
11.3. Market Attractiveness Analysis
11.3.1. By Country
11.3.2. By Imaging Methods
11.3.3. By Industry
11.4. Key Takeaways
12. South Asia & Pacific Radiography Test Equipment Market Analysis 2017-2021 and Forecast 2022-2032, By Country
12.1. Historical Market Size Value (US$ Mn) & Volume (Units) Trend Analysis By Market Taxonomy, 2017-2021
12.2. Market Size Value (US$ Mn) & Volume (Units) Forecast By Market Taxonomy, 2022-2032
12.2.1. By Country
12.2.1.1. India
12.2.1.2. ASEAN
12.2.1.3. Australia and New Zealand
12.2.1.4. Rest of South Asia & Pacific
12.2.2. By Imaging Methods
12.2.3. By Industry
12.3. Market Attractiveness Analysis
12.3.1. By Country
12.3.2. By Imaging Methods
12.3.3. By Industry
12.4. Key Takeaways
13. MEA Radiography Test Equipment Market Analysis 2017-2021 and Forecast 2022-2032, By Country
13.1. Historical Market Size Value (US$ Mn) & Volume (Units) Trend Analysis By Market Taxonomy, 2017-2021
13.2. Market Size Value (US$ Mn) & Volume (Units) Forecast By Market Taxonomy, 2022-2032
13.2.1. By Country
13.2.1.1. GCC Countries
13.2.1.2. Turkey
13.2.1.3. South Africa
13.2.1.4. Rest of MEA
13.2.2. By Imaging Methods
13.2.3. By Industry
13.3. Market Attractiveness Analysis
13.3.1. By Country
13.3.2. By Imaging Methods
13.3.3. By Industry
13.4. Key Takeaways
14. Key Countries Radiography Test Equipment Market Analysis
14.1. U.S.
14.1.1. Pricing Analysis
14.1.2. Market Share Analysis, 2021
14.1.2.1. By Imaging Methods
14.1.2.2. By Industry
14.2. Canada
14.2.1. Pricing Analysis
14.2.2. Market Share Analysis, 2021
14.2.2.1. By Imaging Methods
14.2.2.2. By Industry
14.3. Mexico
14.3.1. Pricing Analysis
14.3.2. Market Share Analysis, 2021
14.3.2.1. By Imaging Methods
14.3.2.2. By Industry
14.4. Brazil
14.4.1. Pricing Analysis
14.4.2. Market Share Analysis, 2021
14.4.2.1. By Imaging Methods
14.4.2.2. By Industry
14.5. Germany
14.5.1. Pricing Analysis
14.5.2. Market Share Analysis, 2021
14.5.2.1. By Imaging Methods
14.5.2.2. By Industry
14.6. Italy
14.6.1. Pricing Analysis
14.6.2. Market Share Analysis, 2021
14.6.2.1. By Imaging Methods
14.6.2.2. By Industry
14.7. France
14.7.1. Pricing Analysis
14.7.2. Market Share Analysis, 2021
14.7.2.1. By Imaging Methods
14.7.2.2. By Industry
14.8. U.K.
14.8.1. Pricing Analysis
14.8.2. Market Share Analysis, 2021
14.8.2.1. By Imaging Methods
14.8.2.2. By Industry
14.9. Spain
14.9.1. Pricing Analysis
14.9.2. Market Share Analysis, 2021
14.9.2.1. By Imaging Methods
14.9.2.2. By Industry
14.10. BENELUX
14.10.1. Pricing Analysis
14.10.2. Market Share Analysis, 2021
14.10.2.1. By Imaging Methods
14.10.2.2. By Industry
14.11. Russia
14.11.1. Pricing Analysis
14.11.2. Market Share Analysis, 2021
14.11.2.1. By Imaging Methods
14.11.2.2. By Industry
14.12. China
14.12.1. Pricing Analysis
14.12.2. Market Share Analysis, 2021
14.12.2.1. By Imaging Methods
14.12.2.2. By Industry
14.13. Japan
14.13.1. Pricing Analysis
14.13.2. Market Share Analysis, 2021
14.13.2.1. By Imaging Methods
14.13.2.2. By Industry
14.14. South Korea
14.14.1. Pricing Analysis
14.14.2. Market Share Analysis, 2021
14.14.2.1. By Imaging Methods
14.14.2.2. By Industry
14.15. India
14.15.1. Pricing Analysis
14.15.2. Market Share Analysis, 2021
14.15.2.1. By Imaging Methods
14.15.2.2. By Industry
14.16. ASEAN
14.16.1. Pricing Analysis
14.16.2. Market Share Analysis, 2021
14.16.2.1. By Imaging Methods
14.16.2.2. By Industry
14.17. Australia and New Zealand
14.17.1. Pricing Analysis
14.17.2. Market Share Analysis, 2021
14.17.2.1. By Imaging Methods
14.17.2.2. By Industry
14.18. GCC Countries
14.18.1. Pricing Analysis
14.18.2. Market Share Analysis, 2021
14.18.2.1. By Imaging Methods
14.18.2.2. By Industry
14.19. Turkey
14.19.1. Pricing Analysis
14.19.2. Market Share Analysis, 2021
14.19.2.1. By Imaging Methods
14.19.2.2. By Industry
14.20. South Africa
14.20.1. Pricing Analysis
14.20.2. Market Share Analysis, 2021
14.20.2.1. By Imaging Methods
14.20.2.2. By Industry
15. Market Structure Analysis
15.1. Competition Dashboard
15.2. Competition Benchmarking
15.3. Market Share Analysis of Top Players
15.3.1. By Regional
15.3.2. By Imaging Methods
15.3.3. By Industry
16. Competition Analysis
16.1. Competition Deep Dive
16.1.1. General Electric
16.1.1.1. Overview
16.1.1.2. Product Portfolio
16.1.1.3. Profitability by Market Segments
16.1.1.4. Sales Footprint
16.1.1.5. Strategy Overview
16.1.1.5.1. Marketing Strategy
16.1.1.5.2. Product Strategy
16.1.1.5.3. Channel Strategy
16.1.2. Nikon Metrology Inc.
16.1.2.1. Overview
16.1.2.2. Product Portfolio
16.1.2.3. Profitability by Market Segments
16.1.2.4. Sales Footprint
16.1.2.5. Strategy Overview
16.1.2.5.1. Marketing Strategy
16.1.2.5.2. Product Strategy
16.1.2.5.3. Channel Strategy
16.1.3. YXLON International
16.1.3.1. Overview
16.1.3.2. Product Portfolio
16.1.3.3. Profitability by Market Segments
16.1.3.4. Sales Footprint
16.1.3.5. Strategy Overview
16.1.3.5.1. Marketing Strategy
16.1.3.5.2. Product Strategy
16.1.3.5.3. Channel Strategy
16.1.4. Olympus Corporation
16.1.4.1. Overview
16.1.4.2. Product Portfolio
16.1.4.3. Profitability by Market Segments
16.1.4.4. Sales Footprint
16.1.4.5. Strategy Overview
16.1.4.5.1. Marketing Strategy
16.1.4.5.2. Product Strategy
16.1.4.5.3. Channel Strategy
16.1.5. Hitachi Ltd.
16.1.5.1. Overview
16.1.5.2. Product Portfolio
16.1.5.3. Profitability by Market Segments
16.1.5.4. Sales Footprint
16.1.5.5. Strategy Overview
16.1.5.5.1. Marketing Strategy
16.1.5.5.2. Product Strategy
16.1.5.5.3. Channel Strategy
16.1.6. Rigaku Corporation
16.1.6.1. Overview
16.1.6.2. Product Portfolio
16.1.6.3. Profitability by Market Segments
16.1.6.4. Sales Footprint
16.1.6.5. Strategy Overview
16.1.6.5.1. Marketing Strategy
16.1.6.5.2. Product Strategy
16.1.6.5.3. Channel Strategy
16.1.7. Carl Zeiss X-ray Technologies Srl
16.1.7.1. Overview
16.1.7.2. Product Portfolio
16.1.7.3. Profitability by Market Segments
16.1.7.4. Sales Footprint
16.1.7.5. Strategy Overview
16.1.7.5.1. Marketing Strategy
16.1.7.5.2. Product Strategy
16.1.7.5.3. Channel Strategy
16.1.8. Canon Inc.
16.1.8.1. Overview
16.1.8.2. Product Portfolio
16.1.8.3. Profitability by Market Segments
16.1.8.4. Sales Footprint
16.1.8.5. Strategy Overview
16.1.8.5.1. Marketing Strategy
16.1.8.5.2. Product Strategy
16.1.8.5.3. Channel Strategy
16.1.9. North Star Imaging Inc.
16.1.9.1. Overview
16.1.9.2. Product Portfolio
16.1.9.3. Profitability by Market Segments
16.1.9.4. Sales Footprint
16.1.9.5. Strategy Overview
16.1.9.5.1. Marketing Strategy
16.1.9.5.2. Product Strategy
16.1.9.5.3. Channel Strategy
16.1.10. Hamamatsu Photonics KK.
16.1.10.1. Overview
16.1.10.2. Product Portfolio
16.1.10.3. Profitability by Market Segments
16.1.10.4. Sales Footprint
16.1.10.5. Strategy Overview
16.1.10.5.1. Marketing Strategy
16.1.10.5.2. Product Strategy
16.1.10.5.3. Channel Strategy
17. Assumptions & Acronyms Used
18. Research Methodology
Let us know your requirement to get
100% FREE customization
Table 1: Global Radiography Test Equipment Market Value (US$ Mn) Forecast by Region, 2017-2032
Table 2: Global Radiography Test Equipment Market Volume (Units) Forecast by Region, 2017-2032
Table 3: Global Radiography Test Equipment Market Value (US$ Mn) Forecast by Imaging Methods, 2017-2032
Table 4: Global Radiography Test Equipment Market Volume (Units) Forecast by Imaging Methods, 2017-2032
Table 5: Global Radiography Test Equipment Market Value (US$ Mn) Forecast by Industry, 2017-2032
Table 6: Global Radiography Test Equipment Market Volume (Units) Forecast by Industry, 2017-2032
Table 7: North America Radiography Test Equipment Market Value (US$ Mn) Forecast by Country, 2017-2032
Table 8: North America Radiography Test Equipment Market Volume (Units) Forecast by Country, 2017-2032
Table 9: North America Radiography Test Equipment Market Value (US$ Mn) Forecast by Imaging Methods, 2017-2032
Table 10: North America Radiography Test Equipment Market Volume (Units) Forecast by Imaging Methods, 2017-2032
Table 11: North America Radiography Test Equipment Market Value (US$ Mn) Forecast by Industry, 2017-2032
Table 12: North America Radiography Test Equipment Market Volume (Units) Forecast by Industry, 2017-2032
Table 13: Latin America Radiography Test Equipment Market Value (US$ Mn) Forecast by Country, 2017-2032
Table 14: Latin America Radiography Test Equipment Market Volume (Units) Forecast by Country, 2017-2032
Table 15: Latin America Radiography Test Equipment Market Value (US$ Mn) Forecast by Imaging Methods, 2017-2032
Table 16: Latin America Radiography Test Equipment Market Volume (Units) Forecast by Imaging Methods, 2017-2032
Table 17: Latin America Radiography Test Equipment Market Value (US$ Mn) Forecast by Industry, 2017-2032
Table 18: Latin America Radiography Test Equipment Market Volume (Units) Forecast by Industry, 2017-2032
Table 19: Europe Radiography Test Equipment Market Value (US$ Mn) Forecast by Country, 2017-2032
Table 20: Europe Radiography Test Equipment Market Volume (Units) Forecast by Country, 2017-2032
Table 21: Europe Radiography Test Equipment Market Value (US$ Mn) Forecast by Imaging Methods, 2017-2032
Table 22: Europe Radiography Test Equipment Market Volume (Units) Forecast by Imaging Methods, 2017-2032
Table 23: Europe Radiography Test Equipment Market Value (US$ Mn) Forecast by Industry, 2017-2032
Table 24: Europe Radiography Test Equipment Market Volume (Units) Forecast by Industry, 2017-2032
Table 25: East Asia Radiography Test Equipment Market Value (US$ Mn) Forecast by Country, 2017-2032
Table 26: East Asia Radiography Test Equipment Market Volume (Units) Forecast by Country, 2017-2032
Table 27: East Asia Radiography Test Equipment Market Value (US$ Mn) Forecast by Imaging Methods, 2017-2032
Table 28: East Asia Radiography Test Equipment Market Volume (Units) Forecast by Imaging Methods, 2017-2032
Table 29: East Asia Radiography Test Equipment Market Value (US$ Mn) Forecast by Industry, 2017-2032
Table 30: East Asia Radiography Test Equipment Market Volume (Units) Forecast by Industry, 2017-2032
Table 31: South Asia & Pacific Radiography Test Equipment Market Value (US$ Mn) Forecast by Country, 2017-2032
Table 32: South Asia & Pacific Radiography Test Equipment Market Volume (Units) Forecast by Country, 2017-2032
Table 33: South Asia & Pacific Radiography Test Equipment Market Value (US$ Mn) Forecast by Imaging Methods, 2017-2032
Table 34: South Asia & Pacific Radiography Test Equipment Market Volume (Units) Forecast by Imaging Methods, 2017-2032
Table 35: South Asia & Pacific Radiography Test Equipment Market Value (US$ Mn) Forecast by Industry, 2017-2032
Table 36: South Asia & Pacific Radiography Test Equipment Market Volume (Units) Forecast by Industry, 2017-2032
Table 37: MEA Radiography Test Equipment Market Value (US$ Mn) Forecast by Country, 2017-2032
Table 38: MEA Radiography Test Equipment Market Volume (Units) Forecast by Country, 2017-2032
Table 39: MEA Radiography Test Equipment Market Value (US$ Mn) Forecast by Imaging Methods, 2017-2032
Table 40: MEA Radiography Test Equipment Market Volume (Units) Forecast by Imaging Methods, 2017-2032
Table 41: MEA Radiography Test Equipment Market Value (US$ Mn) Forecast by Industry, 2017-2032
Table 42: MEA Radiography Test Equipment Market Volume (Units) Forecast by Industry, 2017-2032
Find your sweet spots for generating winning opportunities in this market.
Talk to AnalystFigure 1: Global Radiography Test Equipment Market Value (US$ Mn) by Imaging Methods, 2022-2032
Figure 2: Global Radiography Test Equipment Market Value (US$ Mn) by Industry, 2022-2032
Figure 3: Global Radiography Test Equipment Market Value (US$ Mn) by Region, 2022-2032
Figure 4: Global Radiography Test Equipment Market Value (US$ Mn) Analysis by Region, 2017-2032
Figure 5: Global Radiography Test Equipment Market Volume (Units) Analysis by Region, 2017-2032
Figure 6: Global Radiography Test Equipment Market Value Share (%) and BPS Analysis by Region, 2022-2032
Figure 7: Global Radiography Test Equipment Market Y-o-Y Growth (%) Projections by Region, 2022-2032
Figure 8: Global Radiography Test Equipment Market Value (US$ Mn) Analysis by Imaging Methods, 2017-2032
Figure 9: Global Radiography Test Equipment Market Volume (Units) Analysis by Imaging Methods, 2017-2032
Figure 10: Global Radiography Test Equipment Market Value Share (%) and BPS Analysis by Imaging Methods, 2022-2032
Figure 11: Global Radiography Test Equipment Market Y-o-Y Growth (%) Projections by Imaging Methods, 2022-2032
Figure 12: Global Radiography Test Equipment Market Value (US$ Mn) Analysis by Industry, 2017-2032
Figure 13: Global Radiography Test Equipment Market Volume (Units) Analysis by Industry, 2017-2032
Figure 14: Global Radiography Test Equipment Market Value Share (%) and BPS Analysis by Industry, 2022-2032
Figure 15: Global Radiography Test Equipment Market Y-o-Y Growth (%) Projections by Industry, 2022-2032
Figure 16: Global Radiography Test Equipment Market Attractiveness by Imaging Methods, 2022-2032
Figure 17: Global Radiography Test Equipment Market Attractiveness by Industry, 2022-2032
Figure 18: Global Radiography Test Equipment Market Attractiveness by Region, 2022-2032
Figure 19: North America Radiography Test Equipment Market Value (US$ Mn) by Imaging Methods, 2022-2032
Figure 20: North America Radiography Test Equipment Market Value (US$ Mn) by Industry, 2022-2032
Figure 21: North America Radiography Test Equipment Market Value (US$ Mn) by Country, 2022-2032
Figure 22: North America Radiography Test Equipment Market Value (US$ Mn) Analysis by Country, 2017-2032
Figure 23: North America Radiography Test Equipment Market Volume (Units) Analysis by Country, 2017-2032
Figure 24: North America Radiography Test Equipment Market Value Share (%) and BPS Analysis by Country, 2022-2032
Figure 25: North America Radiography Test Equipment Market Y-o-Y Growth (%) Projections by Country, 2022-2032
Figure 26: North America Radiography Test Equipment Market Value (US$ Mn) Analysis by Imaging Methods, 2017-2032
Figure 27: North America Radiography Test Equipment Market Volume (Units) Analysis by Imaging Methods, 2017-2032
Figure 28: North America Radiography Test Equipment Market Value Share (%) and BPS Analysis by Imaging Methods, 2022-2032
Figure 29: North America Radiography Test Equipment Market Y-o-Y Growth (%) Projections by Imaging Methods, 2022-2032
Figure 30: North America Radiography Test Equipment Market Value (US$ Mn) Analysis by Industry, 2017-2032
Figure 31: North America Radiography Test Equipment Market Volume (Units) Analysis by Industry, 2017-2032
Figure 32: North America Radiography Test Equipment Market Value Share (%) and BPS Analysis by Industry, 2022-2032
Figure 33: North America Radiography Test Equipment Market Y-o-Y Growth (%) Projections by Industry, 2022-2032
Figure 34: North America Radiography Test Equipment Market Attractiveness by Imaging Methods, 2022-2032
Figure 35: North America Radiography Test Equipment Market Attractiveness by Industry, 2022-2032
Figure 36: North America Radiography Test Equipment Market Attractiveness by Country, 2022-2032
Figure 37: Latin America Radiography Test Equipment Market Value (US$ Mn) by Imaging Methods, 2022-2032
Figure 38: Latin America Radiography Test Equipment Market Value (US$ Mn) by Industry, 2022-2032
Figure 39: Latin America Radiography Test Equipment Market Value (US$ Mn) by Country, 2022-2032
Figure 40: Latin America Radiography Test Equipment Market Value (US$ Mn) Analysis by Country, 2017-2032
Figure 41: Latin America Radiography Test Equipment Market Volume (Units) Analysis by Country, 2017-2032
Figure 42: Latin America Radiography Test Equipment Market Value Share (%) and BPS Analysis by Country, 2022-2032
Figure 43: Latin America Radiography Test Equipment Market Y-o-Y Growth (%) Projections by Country, 2022-2032
Figure 44: Latin America Radiography Test Equipment Market Value (US$ Mn) Analysis by Imaging Methods, 2017-2032
Figure 45: Latin America Radiography Test Equipment Market Volume (Units) Analysis by Imaging Methods, 2017-2032
Figure 46: Latin America Radiography Test Equipment Market Value Share (%) and BPS Analysis by Imaging Methods, 2022-2032
Figure 47: Latin America Radiography Test Equipment Market Y-o-Y Growth (%) Projections by Imaging Methods, 2022-2032
Figure 48: Latin America Radiography Test Equipment Market Value (US$ Mn) Analysis by Industry, 2017-2032
Figure 49: Latin America Radiography Test Equipment Market Volume (Units) Analysis by Industry, 2017-2032
Figure 50: Latin America Radiography Test Equipment Market Value Share (%) and BPS Analysis by Industry, 2022-2032
Figure 51: Latin America Radiography Test Equipment Market Y-o-Y Growth (%) Projections by Industry, 2022-2032
Figure 52: Latin America Radiography Test Equipment Market Attractiveness by Imaging Methods, 2022-2032
Figure 53: Latin America Radiography Test Equipment Market Attractiveness by Industry, 2022-2032
Figure 54: Latin America Radiography Test Equipment Market Attractiveness by Country, 2022-2032
Figure 55: Europe Radiography Test Equipment Market Value (US$ Mn) by Imaging Methods, 2022-2032
Figure 56: Europe Radiography Test Equipment Market Value (US$ Mn) by Industry, 2022-2032
Figure 57: Europe Radiography Test Equipment Market Value (US$ Mn) by Country, 2022-2032
Figure 58: Europe Radiography Test Equipment Market Value (US$ Mn) Analysis by Country, 2017-2032
Figure 59: Europe Radiography Test Equipment Market Volume (Units) Analysis by Country, 2017-2032
Figure 60: Europe Radiography Test Equipment Market Value Share (%) and BPS Analysis by Country, 2022-2032
Figure 61: Europe Radiography Test Equipment Market Y-o-Y Growth (%) Projections by Country, 2022-2032
Figure 62: Europe Radiography Test Equipment Market Value (US$ Mn) Analysis by Imaging Methods, 2017-2032
Figure 63: Europe Radiography Test Equipment Market Volume (Units) Analysis by Imaging Methods, 2017-2032
Figure 64: Europe Radiography Test Equipment Market Value Share (%) and BPS Analysis by Imaging Methods, 2022-2032
Figure 65: Europe Radiography Test Equipment Market Y-o-Y Growth (%) Projections by Imaging Methods, 2022-2032
Figure 66: Europe Radiography Test Equipment Market Value (US$ Mn) Analysis by Industry, 2017-2032
Figure 67: Europe Radiography Test Equipment Market Volume (Units) Analysis by Industry, 2017-2032
Figure 68: Europe Radiography Test Equipment Market Value Share (%) and BPS Analysis by Industry, 2022-2032
Figure 69: Europe Radiography Test Equipment Market Y-o-Y Growth (%) Projections by Industry, 2022-2032
Figure 70: Europe Radiography Test Equipment Market Attractiveness by Imaging Methods, 2022-2032
Figure 71: Europe Radiography Test Equipment Market Attractiveness by Industry, 2022-2032
Figure 72: Europe Radiography Test Equipment Market Attractiveness by Country, 2022-2032
Figure 73: East Asia Radiography Test Equipment Market Value (US$ Mn) by Imaging Methods, 2022-2032
Figure 74: East Asia Radiography Test Equipment Market Value (US$ Mn) by Industry, 2022-2032
Figure 75: East Asia Radiography Test Equipment Market Value (US$ Mn) by Country, 2022-2032
Figure 76: East Asia Radiography Test Equipment Market Value (US$ Mn) Analysis by Country, 2017-2032
Figure 77: East Asia Radiography Test Equipment Market Volume (Units) Analysis by Country, 2017-2032
Figure 78: East Asia Radiography Test Equipment Market Value Share (%) and BPS Analysis by Country, 2022-2032
Figure 79: East Asia Radiography Test Equipment Market Y-o-Y Growth (%) Projections by Country, 2022-2032
Figure 80: East Asia Radiography Test Equipment Market Value (US$ Mn) Analysis by Imaging Methods, 2017-2032
Figure 81: East Asia Radiography Test Equipment Market Volume (Units) Analysis by Imaging Methods, 2017-2032
Figure 82: East Asia Radiography Test Equipment Market Value Share (%) and BPS Analysis by Imaging Methods, 2022-2032
Figure 83: East Asia Radiography Test Equipment Market Y-o-Y Growth (%) Projections by Imaging Methods, 2022-2032
Figure 84: East Asia Radiography Test Equipment Market Value (US$ Mn) Analysis by Industry, 2017-2032
Figure 85: East Asia Radiography Test Equipment Market Volume (Units) Analysis by Industry, 2017-2032
Figure 86: East Asia Radiography Test Equipment Market Value Share (%) and BPS Analysis by Industry, 2022-2032
Figure 87: East Asia Radiography Test Equipment Market Y-o-Y Growth (%) Projections by Industry, 2022-2032
Figure 88: East Asia Radiography Test Equipment Market Attractiveness by Imaging Methods, 2022-2032
Figure 89: East Asia Radiography Test Equipment Market Attractiveness by Industry, 2022-2032
Figure 90: East Asia Radiography Test Equipment Market Attractiveness by Country, 2022-2032
Figure 91: South Asia & Pacific Radiography Test Equipment Market Value (US$ Mn) by Imaging Methods, 2022-2032
Figure 92: South Asia & Pacific Radiography Test Equipment Market Value (US$ Mn) by Industry, 2022-2032
Figure 93: South Asia & Pacific Radiography Test Equipment Market Value (US$ Mn) by Country, 2022-2032
Figure 94: South Asia & Pacific Radiography Test Equipment Market Value (US$ Mn) Analysis by Country, 2017-2032
Figure 95: South Asia & Pacific Radiography Test Equipment Market Volume (Units) Analysis by Country, 2017-2032
Figure 96: South Asia & Pacific Radiography Test Equipment Market Value Share (%) and BPS Analysis by Country, 2022-2032
Figure 97: South Asia & Pacific Radiography Test Equipment Market Y-o-Y Growth (%) Projections by Country, 2022-2032
Figure 98: South Asia & Pacific Radiography Test Equipment Market Value (US$ Mn) Analysis by Imaging Methods, 2017-2032
Figure 99: South Asia & Pacific Radiography Test Equipment Market Volume (Units) Analysis by Imaging Methods, 2017-2032
Figure 100: South Asia & Pacific Radiography Test Equipment Market Value Share (%) and BPS Analysis by Imaging Methods, 2022-2032
Figure 101: South Asia & Pacific Radiography Test Equipment Market Y-o-Y Growth (%) Projections by Imaging Methods, 2022-2032
Figure 102: South Asia & Pacific Radiography Test Equipment Market Value (US$ Mn) Analysis by Industry, 2017-2032
Figure 103: South Asia & Pacific Radiography Test Equipment Market Volume (Units) Analysis by Industry, 2017-2032
Figure 104: South Asia & Pacific Radiography Test Equipment Market Value Share (%) and BPS Analysis by Industry, 2022-2032
Figure 105: South Asia & Pacific Radiography Test Equipment Market Y-o-Y Growth (%) Projections by Industry, 2022-2032
Figure 106: South Asia & Pacific Radiography Test Equipment Market Attractiveness by Imaging Methods, 2022-2032
Figure 107: South Asia & Pacific Radiography Test Equipment Market Attractiveness by Industry, 2022-2032
Figure 108: South Asia & Pacific Radiography Test Equipment Market Attractiveness by Country, 2022-2032
Figure 109: MEA Radiography Test Equipment Market Value (US$ Mn) by Imaging Methods, 2022-2032
Figure 110: MEA Radiography Test Equipment Market Value (US$ Mn) by Industry, 2022-2032
Figure 111: MEA Radiography Test Equipment Market Value (US$ Mn) by Country, 2022-2032
Figure 112: MEA Radiography Test Equipment Market Value (US$ Mn) Analysis by Country, 2017-2032
Figure 113: MEA Radiography Test Equipment Market Volume (Units) Analysis by Country, 2017-2032
Figure 114: MEA Radiography Test Equipment Market Value Share (%) and BPS Analysis by Country, 2022-2032
Figure 115: MEA Radiography Test Equipment Market Y-o-Y Growth (%) Projections by Country, 2022-2032
Figure 116: MEA Radiography Test Equipment Market Value (US$ Mn) Analysis by Imaging Methods, 2017-2032
Figure 117: MEA Radiography Test Equipment Market Volume (Units) Analysis by Imaging Methods, 2017-2032
Figure 118: MEA Radiography Test Equipment Market Value Share (%) and BPS Analysis by Imaging Methods, 2022-2032
Figure 119: MEA Radiography Test Equipment Market Y-o-Y Growth (%) Projections by Imaging Methods, 2022-2032
Figure 120: MEA Radiography Test Equipment Market Value (US$ Mn) Analysis by Industry, 2017-2032
Figure 121: MEA Radiography Test Equipment Market Volume (Units) Analysis by Industry, 2017-2032
Figure 122: MEA Radiography Test Equipment Market Value Share (%) and BPS Analysis by Industry, 2022-2032
Figure 123: MEA Radiography Test Equipment Market Y-o-Y Growth (%) Projections by Industry, 2022-2032
Figure 124: MEA Radiography Test Equipment Market Attractiveness by Imaging Methods, 2022-2032
Figure 125: MEA Radiography Test Equipment Market Attractiveness by Industry, 2022-2032
Figure 126: MEA Radiography Test Equipment Market Attractiveness by Country, 2022-2032
Need specific information?
Request CustomizationExplore Testing Equipment Insights
View Reports