The test and measurement equipment market is expected to grow from USD 37.7 billion in 2025 to USD 65 billion by 2035, representing substantial growth. As per Future Market Insights, Bronze Stevie Award winner for excellence in thought leadership, the market is demonstrating the accelerating adoption of advanced testing technology and measurement optimization across the telecommunications infrastructure, electronics manufacturing, and automotive sectors.
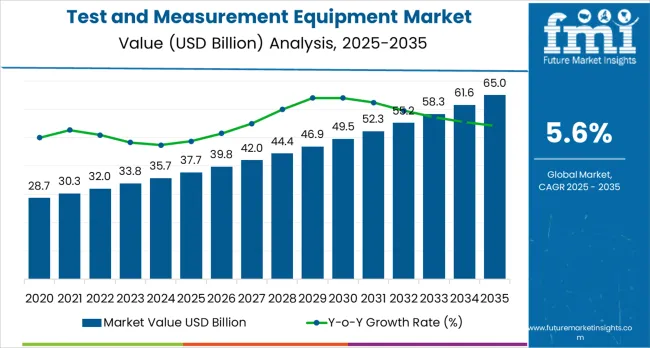
The first half of the decade (2025-2030) will witness the market climbing from USD 37.7 billion to approximately USD 49.2 billion, adding USD 11.5 billion in value, which constitutes 42% of the total forecast growth period. This phase will be characterized by the rapid adoption of general-purpose test equipment systems, driven by increasing 5G deployment volumes and the growing need for advanced precision testing solutions worldwide. Enhanced automation capabilities and AI-integrated performance systems will become standard expectations rather than premium options.
The latter half (2030-2035) will witness continued growth from USD 49.2 billion to USD 65.0 billion, representing an addition of USD 15.8 billion or 58% of the decade's expansion. This period will be defined by mass market penetration of wireless testing technologies, integration with comprehensive IoT platforms, and seamless compatibility with existing industrial infrastructure. The market trajectory signals fundamental shifts in how manufacturing facilities approach quality control optimization and precision measurement, with participants positioned to benefit from growing demand across multiple testing ranges and application segments.
The test and measurement equipment market demonstrates distinct growth phases with varying market characteristics and competitive dynamics. Between 2025 and 2030, the market progresses through its technology adoption phase, expanding from USD 37.7 billion to USD 49.2 billion with steady annual increments averaging 5.6% growth. This period showcases the transition from basic testing equipment to advanced general-purpose systems with enhanced precision capabilities and integrated data analysis becoming mainstream features.
The 2025-2030 phase adds USD 11.5 billion to market value, representing 42% of total decade expansion. Market maturation factors include standardization of testing protocols, declining component costs for specialized equipment, and increasing manufacturing industry awareness of measurement equipment benefits reaching 90-95% operational effectiveness in quality control applications. Competitive landscape evolution during this period features established technology companies like Keysight Technologies and Tektronix expanding their testing portfolios while specialty manufacturers focus on advanced technology development and enhanced precision capabilities.
From 2030 to 2035, market dynamics shift toward advanced AI integration and global industrial expansion, with growth continuing from USD 49.2 billion to USD 65.0 billion, adding USD 15.8 billion or 58% of total expansion. This phase transition centers on wireless testing systems, integration with automated manufacturing networks, and deployment across diverse electronics and telecommunications scenarios, becoming standard rather than specialized applications. The competitive environment matures with focus shifting from basic measurement capability to comprehensive quality assurance systems and integration with IoT monitoring platforms.
The market demonstrates strong fundamentals with general-purpose test equipment systems capturing a dominant share through advanced precision testing capabilities and quality assurance optimization. Electronics and semiconductor applications drive primary demand, supported by increasing manufacturing infrastructure development and telecommunications requirements.
Geographic expansion remains concentrated in developed markets with established industrial infrastructure, while emerging economies show accelerating adoption rates driven by digitalization initiatives and rising precision standards.
At-a-Glance Metrics
| Metric | Value |
|---|---|
| Market Value (2025) | USD 37.7 billion |
| Market Forecast (2035) | USD 65 billion |
| Growth Rate | 5.6% CAGR |
| Leading Technology | General Purpose Test Equipment |
| Primary Application | Electronics and Semiconductor Segment |
Market expansion rests on three fundamental shifts driving adoption across the electronics and telecommunications sectors.
1. 5G technology deployment creates compelling operational advantages through test equipment that provides immediate precision testing efficiency without measurement degradation, enabling manufacturing facilities to meet quality standards while maintaining production reliability and reducing testing complexity.
2. Electronics manufacturing modernization accelerates as facilities worldwide seek advanced systems that complement traditional testing methods, enabling precise measurement control and quality assurance that align with industry regulations and operational efficiency standards.
3. AI integration enhancement drives adoption from manufacturing facilities and telecommunications operations requiring effective testing solutions that minimize measurement error while maintaining operational performance during precision testing operations.
However, growth faces headwinds from equipment cost challenges that vary across industrial suppliers regarding the pricing of specialized testing equipment and measurement systems, which may limit adoption in budget-sensitive manufacturing environments. Technical limitations also persist regarding equipment capabilities and operational conditions that may reduce effectiveness in extreme precision ranges or challenging industrial environments, which affect testing performance and measurement consistency.
The test and measurement equipment market represents a specialized yet critical opportunity driven by expanding 5G infrastructure, manufacturing modernization, and the adoption of AI and automation platforms. The market will expand from USD 37.7B in 2025 to USD 65.0B by 2035, adding USD 27.3B in new value. Growth opportunities are concentrated around advanced general-purpose equipment, calibration services, precision testing optimization, and smart integration capabilities.
Primary Classification: The market segments by service into calibration services and after-sales services, representing the evolution from basic maintenance support to specialized precision solutions for comprehensive testing optimization.
Secondary Classification: Product type segmentation divides the market into general-purpose test equipment and mechanical test equipment, reflecting distinct requirements for operational performance, precision compliance, and system efficiency standards.
Tertiary Classification: Vertical segmentation covers healthcare, electronics and semiconductor, IT and telecommunication, aerospace and defense, automobile and transportation, and education and government applications.
Regional Classification: Geographic distribution covers North America, Latin America, Europe, Asia Pacific, and Middle East &Africa, with developed markets leading adoption while emerging economies show accelerating growth patterns driven by industrial expansion programs.
The segmentation structure reveals technology progression from standard testing equipment toward specialized precision systems with enhanced measurement capabilities and automation features, while application diversity spans from electronics manufacturing to telecommunications infrastructure requiring precise quality control solutions.
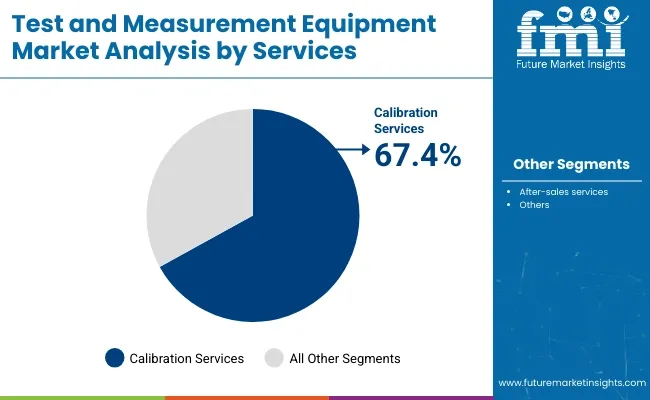
Market Position: Calibration services command the leading position in the test and measurement equipment market with 67.4% market share through advanced precision features, including superior accuracy capability, operational reliability, and quality optimization that enable manufacturing facilities to achieve optimal testing performance across diverse industrial and electronics environments.
Value Drivers: The segment benefits from manufacturing facility preference for reliable calibration systems that provide consistent measurement performance, reduced testing error, and operational efficiency optimization without requiring significant infrastructure modifications. Advanced service features enable automated quality control, precision consistency, and integration with existing testing equipment, where measurement performance and system reliability represent critical facility requirements.
Competitive Advantages: Calibration services differentiate through proven operational stability, consistent precision characteristics, and integration with automated testing systems that enhance facility effectiveness while maintaining optimal quality standards suitable for diverse manufacturing and electronics applications.
Key market characteristics:
After-sales services maintain a complementary market position in the test and measurement equipment market due to their specialized support properties and operational advantages. These services appeal to facilities requiring comprehensive maintenance characteristics with competitive performance for equipment lifecycle and technical support applications. Market growth is driven by equipment complexity emphasis, highlighting reliable service solutions and operational effectiveness through optimized support designs.
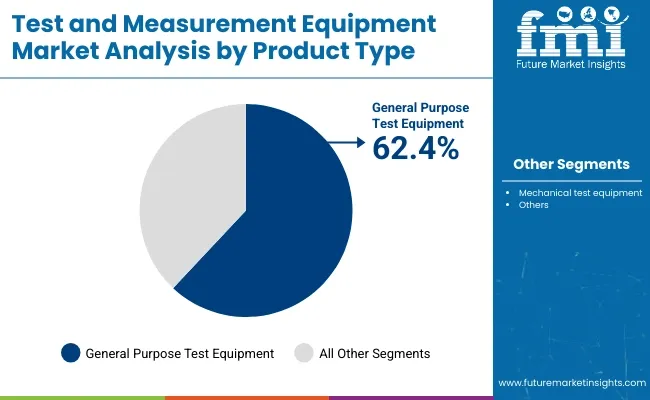
Market Context: General-purpose test equipment demonstrates the highest market share with 62.4% due to widespread adoption of versatile testing systems and increasing focus on manufacturing optimization, operational performance enhancement, and industrial applications that maximize precision efficiency while maintaining quality standards.
Appeal Factors: General-purpose equipment operators prioritize system reliability, measurement optimization, and integration with existing manufacturing infrastructure that enables coordinated testing across multiple industrial operations. The segment benefits from substantial manufacturing investment and modernization programs that emphasize the acquisition of versatile systems for performance enhancement and quality efficiency applications.
Growth Drivers: Manufacturing automation programs incorporate general-purpose equipment as standard equipment for industrial operations, while electronics facility growth increases demand for advanced testing capabilities that comply with performance standards and minimize operational complexity.
Market Challenges: Varying testing technology standards and equipment infrastructure differences may limit system standardization across different facilities or operational scenarios.
Application dynamics include:
Mechanical test equipment captures complementary market share through specialized testing requirements in automotive manufacturing facilities, aerospace operations, and precision materials applications. These facilities demand mechanical systems capable of operating in demanding environments while providing effective testing and operational reliability capabilities.
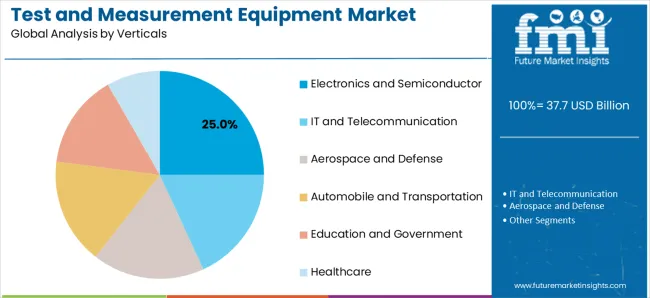
Market Position: Electronics and semiconductor applications lead the market with 25% share, representing the largest industry vertical segment due to extensive manufacturing infrastructure development and precision testing requirements.
Growth Drivers: Electronics sector expansion, technology modernization projects, and quality control enforcement drive consistent demand for testing solutions across manufacturing facilities, semiconductor production, and component testing projects.
Application Scope: Electronics applications span component testing, quality control, manufacturing optimization, and facility upgrade projects requiring diverse testing capabilities and precision measurement features.
Growth Accelerators: 5G technology infrastructure development drives primary adoption as test equipment provides precision measurement efficiency capabilities that enable telecommunications facilities to meet quality standards without excessive testing complexity, supporting manufacturing operations and technology missions that require advanced measurement applications.
Industrial automation demand accelerates market expansion as facilities seek effective systems that minimize measurement error while maintaining operational effectiveness during quality control and testing scenarios. Electronics technology spending increases worldwide, creating continued demand for testing systems that complement traditional manufacturing methods and provide operational flexibility in complex industrial environments.
Growth Inhibitors: Equipment cost challenges vary across industrial suppliers regarding the pricing of specialized testing systems and measurement equipment, which may limit operational flexibility and market penetration in regions with budget constraints or cost-sensitive manufacturing operations.
Technical performance limitations persist regarding equipment capabilities and operational conditions that may reduce effectiveness in extreme precision ranges, environmental interference, or facility conditions, affecting testing performance and measurement consistency. Market fragmentation across multiple manufacturing specifications and testing standards creates compatibility concerns between different equipment suppliers and existing industrial infrastructure.
Market Evolution Patterns: Adoption accelerates in electronics and telecommunications sectors where performance requirements justify testing system costs, with geographic concentration in developed markets transitioning toward mainstream adoption in emerging economies driven by industrialization initiatives and quality control development.
Technology development focuses on enhanced testing capabilities, improved precision efficiency, and integration with automated monitoring systems that optimize measurement performance and manufacturing effectiveness. The market could face disruption if alternative testing technologies or measurement standards significantly limit the deployment of traditional testing equipment in manufacturing or electronics applications.
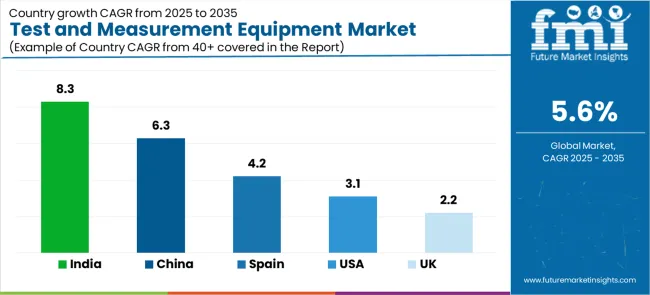
| Country | Growth Rate (2025-2035) |
|---|---|
| India | 8.3% |
| China | 6.3% |
| Spain | 4.2% |
| United States | 3.1% |
| United Kingdom | 2.2% |
The test and measurement equipment market demonstrates varied regional dynamics with Growth Leaders including India (8.3% growth rate) and China (6.3% growth rate) driving expansion through manufacturing initiatives and electronics development.
Steady Performers encompass Spain (4.2% growth rate), United States (3.1% growth rate), and developed regions, benefiting from established industrial industries and advanced equipment adoption. Emerging Markets feature United Kingdom (2.2% growth rate) and developing regions, where technology initiatives and manufacturing modernization support consistent growth patterns.
Regional synthesis reveals Asian markets leading adoption through manufacturing expansion and electronics development, while North American countries maintain steady expansion supported by industrial technology advancement and quality standardization requirements. European markets show moderate growth driven by telecommunications applications and precision testing integration trends.
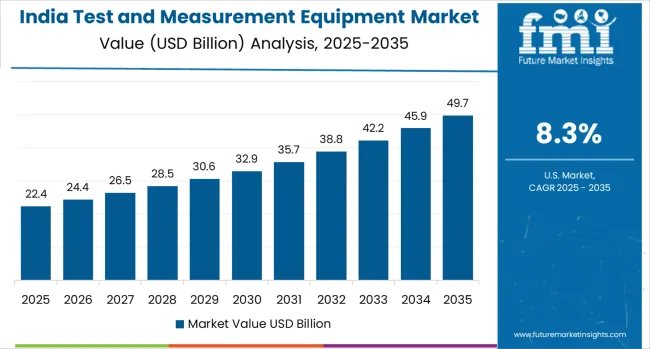
India establishes fastest market growth through aggressive manufacturing programs and comprehensive electronics development, integrating advanced test equipment as standard components in industrial infrastructure and technology installations. The country's 8.3% growth rate reflects government initiatives promoting industrial technology and domestic manufacturing capabilities that mandate the use of advanced testing systems in electronics and manufacturing facilities. Growth concentrates in major industrial centers, including Mumbai, Delhi, and Bangalore, where technology development showcases integrated testing systems that appeal to manufacturing operators seeking advanced facility optimization capabilities and quality control applications.
Indian manufacturers are developing cost-effective testing solutions that combine domestic production advantages with advanced operational features, including automated measurement control and enhanced precision capabilities. Distribution channels through industrial suppliers and equipment distributors expand market access, while government support for manufacturing infrastructure development supports adoption across diverse electronics and industrial segments.
Strategic Market Indicators:
In Beijing, Shanghai, and Shenzhen, manufacturing facilities and electronics operations are implementing advanced test equipment as standard equipment for quality control optimization and precision testing applications, driven by increasing government manufacturing investment and technology modernization programs that emphasize the importance of testing capabilities.
The market holds a 6.3% growth rate, supported by government industrial initiatives and electronics development programs that promote advanced testing systems for manufacturing and technology facilities. Chinese operators are adopting testing systems that provide consistent operational performance and measurement features, particularly appealing in industrial regions where precision efficiency and quality standards represent critical operational requirements.
Market expansion benefits from growing manufacturing technology capabilities and technology transfer agreements that enable domestic production of advanced testing systems for electronics and industrial applications. Technology adoption follows patterns established in manufacturing equipment, where reliability and performance drive procurement decisions and operational deployment.
Market Intelligence Brief:
United States establishes market leadership through comprehensive industrial programs and advanced manufacturing infrastructure development, integrating test equipment across electronics and telecommunications applications.
The country's 3.1% growth rate reflects established industrial relationships and mature testing technology adoption that supports widespread use of precision measurement systems in manufacturing and technology facilities. Growth concentrates in major technology centers, including California, Texas, and New York, where industrial technology showcases mature equipment deployment that appeals to manufacturing operators seeking proven testing capabilities and operational efficiency applications.
American equipment providers leverage established distribution networks and comprehensive service capabilities, including technical support programs and performance optimization that create customer relationships and operational advantages. The market benefits from mature quality regulations and testing standards that mandate equipment use while supporting technology advancement and operational optimization.
Market Intelligence Brief:
The advanced industrial technology market in Spain demonstrates sophisticated test equipment deployment with documented operational effectiveness in manufacturing applications and electronics operations through integration with existing industrial systems and manufacturing infrastructure. The country leverages engineering expertise in industrial technology and quality control integration to maintain a 4.2% growth rate.
Technology centers, including Madrid, Barcelona, and Valencia, showcase premium installations where testing systems integrate with comprehensive manufacturing platforms and facility management systems to optimize quality control operations and measurement effectiveness.
Spanish manufacturers prioritize system reliability and performance compliance in testing equipment development, creating demand for premium systems with advanced features, including facility monitoring integration and automated quality control. The market benefits from established industrial technology infrastructure and a willingness to invest in advanced testing technologies that provide long-term operational benefits and compliance with international manufacturing standards.
Market Intelligence Brief:
The United Kingdom's market expansion benefits from diverse industrial demand, including manufacturing infrastructure modernization in London and Manchester, technology facility upgrades, and government innovation programs that increasingly incorporate testing solutions for quality optimization applications. The country maintains a 2.2% growth rate, driven by rising industrial activity and increasing recognition of testing technology benefits, including precise measurement control and reduced quality interference.
Market dynamics focus on cost-effective testing solutions that balance advanced operational performance with affordability considerations important to British manufacturing operators. Growing industrial modernization creates continued demand for modern testing systems in new facility infrastructure and manufacturing modernization projects.
Strategic Market Considerations:
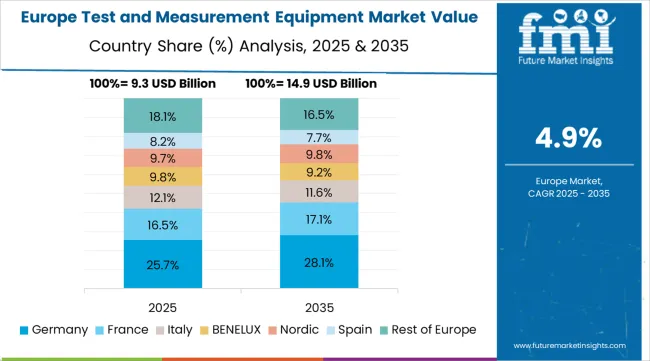
The European test and measurement equipment market is projected to grow from USD 11.3 billion in 2025 to USD 18.7 billion by 2035, registering a CAGR of 5.1% over the forecast period. Germany is expected to maintain its leadership position with a 26.4% market share in 2025, supported by its advanced industrial technology infrastructure and major manufacturing centers.
United Kingdom follows with a 20.8% share in 2025, driven by comprehensive technology programs and industrial development initiatives. France holds a 17.3% share through specialized manufacturing applications and quality control requirements. Italy commands a 13.9% share, while Spain accounts for 10.2% in 2025.
Poland maintains an 8.1% share, while Russia accounts for 3.3% of the European market in 2025. The Rest of Europe region is anticipated to gain momentum, expanding its collective share from 7.5% to 8.2% by 2035, attributed to increasing industrial adoption in Nordic countries and emerging manufacturing facilities implementing technology modernization programs.
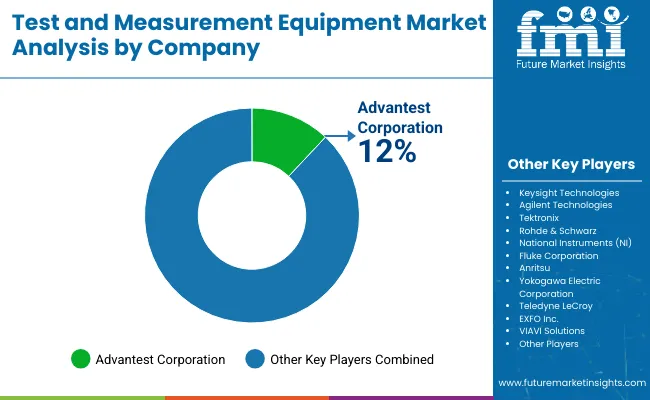
The test and measurement equipment market operates with moderate concentration, featuring approximately 20-25 meaningful participants, where leading companies control roughly 35-40% of the global market share through established industrial relationships and comprehensive testing portfolios. Competition emphasizes advanced precision capabilities, system reliability, and manufacturing integration rather than price-based rivalry.
Market Leaders encompass Keysight Technologies, Agilent Technologies, and Tektronix, which maintain competitive advantages through extensive industrial technology expertise, global manufacturing contractor networks, and comprehensive system integration capabilities that create customer switching costs and support premium pricing. These companies leverage decades of testing technology experience and ongoing research investments to develop advanced measurement systems with precision operational control and quality monitoring features.
Technology Innovators include Rohde &Schwarz, National Instruments, and Fluke Corporation, which compete through specialized testing technology focus and innovative operational interfaces that appeal to manufacturing operators seeking advanced precision capabilities and operational flexibility. These companies differentiate through rapid technology development cycles and specialized electronics application focus.
Regional Specialists feature companies like Anritsu, Yokogawa Electric Corporation, and VIAVI Solutions, which focus on specific geographic markets and specialized applications, including wireless testing systems and integrated manufacturing solutions. Market dynamics favor participants that combine reliable testing capabilities with advanced operational software, including precision measurement control and automatic performance optimization capabilities. Competitive pressure intensifies as traditional industrial contractors expand into testing systems, while specialized manufacturing companies challenge established players through innovative testing solutions and cost-effective systems targeting specialized electronics segments.
| Items | Values |
|---|---|
| Quantitative Units | USD 37.7 billion |
| Services | Calibration Services, After-sales Services |
| Product Type | General-purpose Test Equipment, Mechanical Test Equipment |
| Verticals | Healthcare, Electronics and Semiconductor, IT and Telecommunication, Aerospace and Defense, Automobile and Transportation, Education and Government |
| Regions Covered | North America, Latin America, Europe, Asia Pacific, Middle East &Africa |
| Countries Covered | United States, China, Germany, India, United Kingdom, Japan, Canada, Brazil, France, Australia, and 25+ additional countries |
| Key Companies Profiled | Keysight Technologies, Agilent Technologies, Tektronix, Rohde &Schwarz, National Instruments, Fluke Corporation, Anritsu, Yokogawa Electric Corporation, Teledyne LeCroy, Advantest Corporation |
| Additional Attributes | Dollar sales by service and product type categories, regional adoption trends across Asia Pacific, North America, and Europe, competitive landscape with technology manufacturers and industrial suppliers, manufacturing operator preferences for precision measurement control and system reliability. |
The global test and measurement equipment market is estimated to be valued at USD 37.7 billion in 2025.
The market size for the test and measurement equipment market is projected to reach USD 65.0 billion by 2035.
The test and measurement equipment market is expected to grow at a 5.6% CAGR between 2025 and 2035.
The key product types in test and measurement equipment market are calibration services and after-sales services.
In terms of product type, general-purpose test equipment segment to command 62.4% share in the test and measurement equipment market in 2025.


Full Research Suite comprises of:
Market outlook & trends analysis
Interviews & case studies
Strategic recommendations
Vendor profiles & capabilities analysis
5-year forecasts
8 regions and 60+ country-level data splits
Market segment data splits
12 months of continuous data updates
DELIVERED AS:
PDF EXCEL ONLINE
Testosterone Test Market Size and Share Forecast Outlook 2025 to 2035
Test rig Market Size and Share Forecast Outlook 2025 to 2035
Testing, Inspection & Certification Market Growth – Trends & Forecast 2025 to 2035
Testosterone Booster Industry Analysis by Component, Source, Distribution Channels and Regions 2025 to 2035
Testosterone Injectable Market
Test Tube Market
Testliner Market
Testicular Cancer Treatment Market
Test and Measurement Sensors Market Size and Share Forecast Outlook 2025 to 2035
Intestinal Health Pet Dietary Supplement Market Size and Share Forecast Outlook 2025 to 2035
Intestinal Fistula Treatment Market Growth - Demand & Innovations 2025 to 2035
Intestinal Pseudo-Obstruction Treatment Market - Trends, Growth & Forecast 2025 to 2035
5G Testing Market Size and Share Forecast Outlook 2025 to 2035
AB Testing Software Market Size and Share Forecast Outlook 2025 to 2035
5G Tester Market Growth – Trends & Forecast 2019-2027
RF Tester Market Growth – Trends & Forecast 2019-2027
RF Test Equipment Market Size and Share Forecast Outlook 2025 to 2035
5G Testing Equipment Market Analysis - Size, Growth, and Forecast 2025 to 2035
V2X Test Scenario Editor Market Size and Share Forecast Outlook 2025 to 2035
LAN tester Market Size and Share Forecast Outlook 2025 to 2035

Thank you!
You will receive an email from our Business Development Manager. Please be sure to check your SPAM/JUNK folder too.
Chat With
MaRIA