
- Market Size (2026)
- USD 44.1 Bn
- Forecast (2036)
- USD 62.2 Bn
- CAGR (2026 to 2036)
- 3.5%
How big is Testliner Market in 2026?
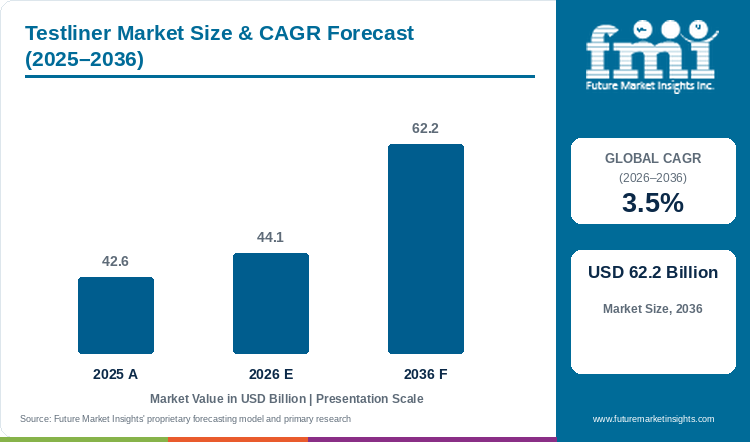
With a valuation of USD 42.6 billion in 2025 and moving to USD 44.1 billion in 2026, the testliner market is positioned to attain USD 62.2 billion by 2036, exhibiting a CAGR of 3.5%.
Recycled fiber furnish economics govern mill operating rates across the global testliner market, where global valuation stood at USD 42.6 billion in 2025 and reached USD 44.1 billion in 2026. FMI research shows that total market value is slated to hit USD 62.2 billion by 2036, reflecting a 3.5% CAGR across the 10-year forecast horizon. Uncoated Brown Testliner Grades 1 through 3 hold 57.8% of 2026 liner grade demand because size-press starch surface treatments match virgin linerboard burst resistance at a 15% to 22% lower reel cost. Mill-level furnish economics separate recycled linerboard reels from the downstream corrugated boxes market at 5.1% CAGR, since box converters capture printing and die-cutting markups while paper mills absorb recovered-paper and energy swings. In July 2026, Cepi reported that European paper and board production reached 77.4 million tonnes in 2025 supported by a 76.4% recycling rate across containerboard grades [1]. Integrated containerboard groups are converting legacy graphic-paper machines to lock in lightweight reel supply. Mondi started up its EUR 200 million converted Duino mill in September 2025 with 420000 tonnes of annual recycled containerboard capacity [2], while Smurfit Westrock processed 13.1 million tons of recovered fiber across 25 recycled paper mills during 2025 [3]. Box plants renew annual reel contracts when mills maintain short-span compression strength across lightweight 90 gsm to 135 gsm grades.
Key Market Trends & Insights
- By liner grade: Uncoated Brown Testliner Grades 1 through 3 hold an estimated 57.8% share in 2026 because two-ply headbox forming and starch sizing satisfy standard edge-crush box specifications.
- By basis weight grammage: 115 gsm to 150 gsm Standard E-Commerce Weight represents 46.4% in 2026 as parcel carriers penalize overweight outer shippers.
- By fiber furnish: 100% Old Corrugated Containers OCC Recycled Fiber accounts for 81.2% in 2026 because supermarket baling systems supply low-cost secondary cellulose.
- By end-use application: E-Commerce Parcel and Retail Shipping Boxes secure 41.6% in 2026 owing to right-sized automated fulfillment cartons.
- By sales channel: Integrated Corrugated Box Plant Transfers command 63.4% in 2026 through internal mill-to-corrugator reel allocations.
Regional Highlights
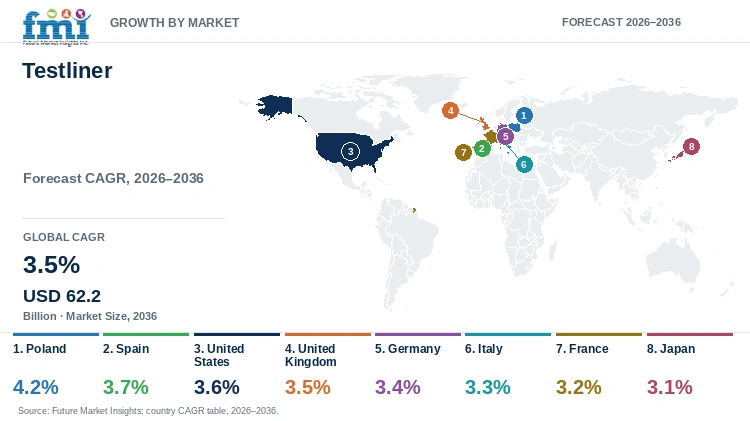
- Top national expansion: Poland paces European and global country growth with a 4.2% CAGR through 2036 under near-shored European e-commerce fulfillment and high-speed wide-web paper machines.
- Broader country progression: Spain posts a 3.7% CAGR before the United States at 3.6% and the United Kingdom at 3.5%, while Germany expands at 3.4%.
Market Size & Forecast
Table 1: Market Size and Forecast for the Testliner Market (USD billion and CAGR percentage), 2025 to 2036
| Metric | Value |
|---|---|
| 2025 Market Size | USD 42.6 billion |
| Estimated Market Size in 2026 | USD 44.1 billion |
| Projected Market Size by 2036 | USD 62.2 billion |
| CAGR, 2026 to 2036 | 3.5% |
| Added Value, 2026 to 2036 | USD 18.1 billion |
Omnichannel grocery and consumer goods brands are pressuring corrugated converters to cut virgin wood-pulp costs without risking box collapse in humid cold-storage warehouses. Standard recycled cellulose fibers absorb atmospheric moisture during refrigerated transit, which softens untreated testliner facings and causes stacked pallets to lean. A June 2026 materials engineering study in Small demonstrated that incorporating 5% to 40% kraft lignin into cellulosic paper furnishings followed by 160 degrees Celsius hot-pressing boosts dry tensile strength to 82 to 189 MPa and cuts water vapor transmission by 67% [4]. Sheet feeders blend these moisture-stabilized recycled testliners with complementary containerboard grades to deliver high-compression transit cartons at lower basis weights.
Recycled Linerboard Tonnage and Corrugator Reel Sizing
Table 2: Recycled Linerboard Tonnage and Reel Sizing for the Testliner Market (USD billion and operational ranges), 2025 to 2036
| Metric | 2025 | 2026 | 2036 |
|---|---|---|---|
| Market size (USD billion) | 42.6 | 44.1 | 62.2 |
| Global testliner & recycled linerboard production (million metric tons) | 66.5 to 71.2 | 68.5 to 73.4 | 93.0 to 99.8 |
| Recovered OCC & mixed paper furnish consumed (million metric tons) | 73.8 to 79.0 | 76.0 to 81.5 | 103.2 to 110.8 |
| Average ex-mill testliner reel realization per metric ton (USD) | 598.0 to 640.0 | 601.0 to 644.0 | 623.0 to 668.0 |
Operational note on reel sizing applies standard 90 gsm to 175 gsm recycled linerboard facings across single-wall and double-wall corrugated board.
Fiber shortening after five to seven mechanical repulping cycles limits how much secondary wastepaper a mill can run without losing burst and ring-crush strength. Every time old corrugated containers pass through mill refiners and dryer cans, cellulose fibrils hornify and lose natural inter-fiber hydrogen bonding. A September 2025 pulp and paper fiber study in Polymers reported that global containerboard demand is climbing from 185 million tons in 2023 toward 220 million tons by 2030 as recycled fibers supply over 71% of paper furnish in emerging manufacturing hubs [5]. Containerboard mills therefore apply enzymatic refining and film-press cationic starch to narrow the performance gap between recycled testliner and virgin kraftliner reels.
Per Capita & Corrugator Line Allocation Sizing
Table 3: Per Capita and Corrugator Line Allocation Indicators for the Testliner Market (USD), 2025 to 2036
| Metric | 2025 | 2026 | 2036 |
|---|---|---|---|
| World population (billion) | 8.2 | 8.3 | 9.0 |
| Valuation per 1,000 people (USD) | 5,195.1 | 5,313.3 | 6,911.1 |
| Annual testliner reel allocation per corrugator plant (USD million) | 11.2 to 12.6 | 11.6 to 13.0 | 15.8 to 17.6 |
| 100% OCC recycled furnish share (%) | 80.8% to 81.0% | 81.2% | 83.5% to 85.0% |
Table 4: Containerboard Mill & Channel Allocation Indicators for the Testliner Market (USD and percentages), 2026
| Metric | Value | Institutional Reference Basis |
|---|---|---|
| Market size, 2026 | USD 44.1 billion | 2026 global market value baseline |
| Active commercial corrugated box & sheet plants | 3,800 plants | Global single-wall, double-wall & sheet feeder plants |
| Market allocation per corrugator plant | USD 11.6 million | Annualized testliner reel procurement baseline |
| Integrated Corrugated Box Plant Transfers value, 2026 | USD 28.0 billion | 63.4% sales channel allocation |
Retail recyclability mandates are forcing paper mills to eliminate extruded polyethylene film coatings from moisture-resistant white-top and brown testliners. Plastic-laminated linerboards leave unrepulpable film rejects inside mill hydrapulpers and fail strict European fiber-recovery grading rules. An April 2026 barrier coating study in Chem and Bio Engineering proved that applying a 6 grams per square meter cellulose nanofibril bilayer onto an 80 grams per square meter paper substrate cuts Cobb60 water absorption from 290 down to 50 grams per square meter while preserving 98% fiber recovery during repulping [6]. Box plants specify these repulpable barrier liners across recycled paper packaging to satisfy supermarket circularity audits.
Analyst Perspective
"Containerboard buyers no longer treat testliner as a low-strength discount substitute for virgin kraftliner. Modern Voith and Valmet gap formers running film-press starch sizing and nano-cellulose surface barriers allow 115 gsm recycled testliner to run at 400 meters per minute on high-speed corrugators while meeting mandatory 2026 EU packaging circularity rules."
- Nandini Roy Choudhury, Principal Analyst at Future Market Insights
How is the testliner market segmented?
The testliner market is segmented by liner grade, basis weight grammage, fiber furnish, end-use application, and sales channel. In 2026, Uncoated Brown Testliner 1, 2, and 3 is projected at 57.8%, 115 gsm to 150 gsm Standard E-Commerce Weight at 46.4%, 100% Old Corrugated Containers OCC Recycled Fiber at 81.2%, E-Commerce Parcel and Retail Shipping Boxes at 41.6%, and Integrated Corrugated Box Plant Transfers at 63.4%.
By liner grade: Uncoated Brown Testliner 1, 2, and 3, White Top Uncoated and Coated Testliner, and Mottled and Color-Dyed Testliner.
By basis weight grammage: 115 gsm to 150 gsm Standard E-Commerce Weight, Below 115 gsm Lightweight Micro-Flute Liner, and Above 150 gsm Heavy-Duty Industrial Liner.
By fiber furnish: 100% Old Corrugated Containers OCC Recycled Fiber and OCC Blended with Virgin Kraft Top-Ply.
By end-use application: E-Commerce Parcel and Retail Shipping Boxes, Food and Beverage Secondary Transit Cartons, and Industrial and Consumer Durables Packaging.
By sales channel: Integrated Corrugated Box Plant Transfers, Independent Sheet Feeder and Converter Contracts, and Wholesale Paperboard Merchants.
Why does Uncoated Brown Testliner 1, 2, and 3 lead the liner grade category?
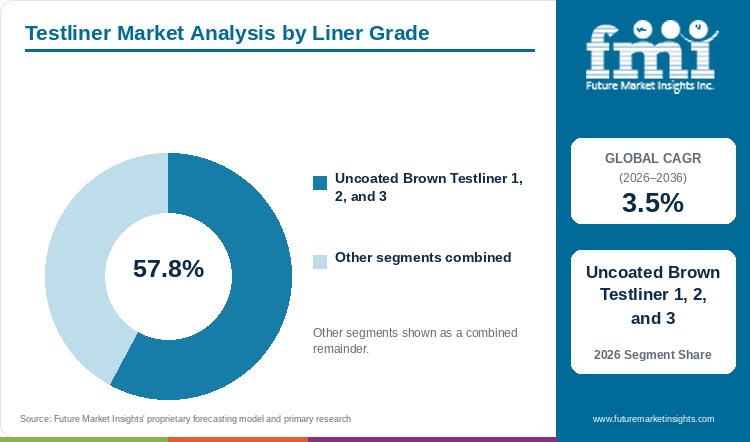
Uncoated Brown Testliner 1, 2, and 3 holds an estimated 57.8% of liner grade demand in 2026, anchored by film-press starch sizing and cost-effective transit box burst strength.
Table 5: Liner Grade Share for the Testliner Market (percentage share), 2026
| Liner Grade | Share (2026) |
|---|---|
| Uncoated Brown Testliner 1, 2, and 3 | 57.8% |
| Other Segments Combined | 42.2%* |
| Total | 100.0% |
*Note that remaining liner grade categories account for the balance of 2026 global testliner demand.
Table 6: Liner Grade Leadership and Market Growth for the Testliner Market (segment and CAGR percentage), 2026 to 2036
| Metric | Value |
|---|---|
| Global CAGR (2026 to 2036) | 3.5% |
| Leading Segment | Uncoated Brown Testliner 1, 2, and 3 |
Box plant buyers select linerboard grades by matching burst index and short-span compression ratings against the stacking height of the finished shipping case. Uncoated brown testliner grades 1 through 3 capture the majority of mill reel shipments because natural unbleached recycled furnish avoids optical brightening chemical costs and prints crisp black-ink barcodes. A February 2026 coating and repulping study in ACS Omega verified that surface-treated packaging paper at 7 grams per square meter achieves 86.93% fiber recovery during hydrapulping while maintaining 11.4 kilonewtons per meter sheet tensile strength [7]. High-turn dry grocery shippers routinely substitute Testliner 2 and Testliner 3 for unbleached kraft paperboard across climate-controlled warehouse loops.
- Uncoated Brown Testliner Grades 1 through 3 hold 57.8% of liner grade market value in 2026 because automated fulfillment centers prioritize low-cost brown shippers with black-ink flexo barcode contrast.
- An August 2025 paper surface chemistry study in Polymers confirmed that increasing recycled fiber content alters sheet surface free energy and two-sidedness due to higher residual lignin and extractives, requiring calibrated starch sizing on the paper machine [8].
What sustains 115 gsm to 150 gsm Standard E-Commerce Weight leadership in basis weight grammage?
115 gsm to 150 gsm Standard E-Commerce Weight represents 46.4% of the basis weight category in 2026, supported by high-speed corrugator runnability and parcel tare-weight optimization.
Parcel carrier dimensional-weight tariffs and automated box-erecting speeds explain why mid-grammage 115 gsm to 150 gsm reels dominate corrugator schedules. Heavier 175 gsm to 200 gsm liners add unnecessary tare weight to single-item e-commerce parcels, whereas ultra-thin 80 gsm papers require specialized tension controls to prevent web breaks on 400-meter-per-minute corrugators. Sheet plant standardization on 120 gsm to 135 gsm starch-sized testliner allows sheet plants to run high-speed B-flute and E-flute orders without frequent roll changes. Fulfillment centers specify these mid-grammage reels across retail e-commerce packaging to balance vertical crush protection against postal freight charges.
- 115 gsm to 150 gsm Standard E-Commerce Weight represents 46.4% of the basis weight segment in 2026 as high-speed corrugators standardize on 120 gsm to 135 gsm outer facings.
- Saica Paper unveiled its updated 2025-2026 recycled containerboard catalogue on 26 June 2025 featuring lightweight and mid-grammage brown and white-top testliners engineered for e-commerce and retail shelf-ready boxes [9].
How does 100% Old Corrugated Containers OCC Recycled Fiber lead the fiber furnish category?
100% Old Corrugated Containers OCC Recycled Fiber accounts for 81.2% of fiber furnish volume in 2026, driven by closed-loop retail bale recovery and lower mill capital intensity.
Mill capital intensity and urban wastepaper logistics give 100% old corrugated container furnish a decisive cost advantage over virgin wood-pulp linerboard. Recycled testliner mills locate on the outskirts of major metropolitan consumption centers to haul baled supermarket cardboard short distances and return finished reels to the same retail distribution hubs. Elimination of chemical kraft digesters and lime kilns cuts mill construction costs by more than a third per annual ton of capacity. Automated fulfillment warehouses feed 100% OCC testliner boards directly into corrugated fanfold systems that score and fold custom-length mailers around individual orders.
- 100% Old Corrugated Containers OCC Recycled Fiber accounts for 81.2% of fiber furnish demand in 2026 because municipal and supermarket bale collection provides abundant domestic feedstock.
- A February 2025 circular-economy modeling study in Scientific Reports analyzing nonlinear corrugated waste networks demonstrated that closed-loop old-corrugated-container collection and reprocessing significantly reduce virgin pulp dependence and landfill routing [10].
Why do E-Commerce Parcel and Retail Shipping Boxes lead the end-use application category?
E-Commerce Parcel and Retail Shipping Boxes secure 41.6% of end-use application value in 2026, supported by automated right-sized fulfillment cartons and plastic mailer replacement.
E-commerce parcel shipping and retail replenishment cartons anchor testliner demand because every online order requires an individual protective outer box that survives automated sortation chutes. In addition, regulatory limits on empty package void space are pushing fulfillment centers toward right-sized corrugated cartons.
- E-Commerce Parcel and Retail Shipping Boxes represent 41.6% of total end-use application valuation in 2026 as right-sized automated box-making machines replace plastic mailers with lightweight recycled corrugated cartons.
- On 11 August 2026, the European Commission confirmed that the Packaging and Packaging Waste Regulation (EU) 2025/40 enters into application on 12 August 2026 and enforces maximum 50% empty-space ratios across e-commerce transport packaging [11].
What gives Integrated Corrugated Box Plant Transfers the leading position in sales channel?
Integrated Corrugated Box Plant Transfers command 63.4% of sales channel share in 2026, anchored by internal mill-to-corrugator reel allocations and baseload machine scheduling.
Vertical integration between recycled paper mills and corrugated box plants determines which producers stay profitable when old corrugated container bale prices surge. Integrated packaging groups transfer 60% to 85% of their testliner reels internally to captive box plants, which guarantees baseload paper-machine utilization above 92% and insulates earnings from spot-market reel discounting.
- Integrated Corrugated Box Plant Transfers account for 63.4% of global sales channel demand in 2026 since internal reel transfers eliminate third-party merchant commissions and stabilize mill scheduling.
- Prinzhorn Group announced on 21 April 2026 that its Dunapack Packaging division signed an agreement to acquire Stora Enso's packaging plants in Germany generating EUR 74 million in 2025 turnover to increase Hamburger Containerboard integration [12].
What are the drivers, restraints, and opportunities in the testliner market?
In the testliner market, mandatory EU PPWR circularity rules and e-commerce parcel expansion are projected to drive adoption whereas OCC bale price swings and fiber hornification restrain unintegrated mills and graphic-paper machine conversions unlock lightweight capacity.
- Driver: Mandatory European Union PPWR e-commerce void-reduction rules and corporate plastic-to-fiber substitution accelerate demand for lightweight 90 gsm to 140 gsm recycled testliner.
- Restraint: Old corrugated container bale price volatility and cellulose fiber shortening across repeated recycling loops constrain unintegrated mill margins.
- Opportunity: Graphic-paper machine conversions to wide-web lightweight testliner and bio-based lignin or nano-cellulose barrier coatings unlock cold-chain and high-graphics kraftliner replacement.
Growth Analysis and Future Potential: Qualitative Demand Catalysts
Cross-border consolidation among containerboard megagroups is accelerating the standardization of lightweight recycled testliner across Europe and North America retail accounts. Multinational food and consumer-goods brands prefer packaging suppliers that can deliver identical box compression and print fidelity across dozens of regional fulfillment centers. International Paper completed its strategic combination with DS Smith on 31 January 2025 to unite North America containerboard scale with European recycled testliner and box converting networks [13]. Converters across these combined networks run 115 gsm to 135 gsm testliner into multi-depth corrugated boxes that eliminate plastic void fill.
Risk Assessment of the Testliner Market: Operational and Formulation Friction
High mill steam and electricity costs with structural overcapacity in older narrow-web machines force containerboard producers to rationalize high-cost assets. Paper machines narrower than 5 meters struggle to match the per-ton conversion economics of modern 8.5-meter to 10.5-meter gap formers equipped with anaerobic biogas boilers. On 3 December 2025, Packaging Corporation of America announced the reconfiguration of its Wallula containerboard mill to 400000 tons per year of high-performance linerboard to lower production costs by USD 125 per ton [14]. Producers across the paper and paperboard packaging industry continue to retire uncompetitive pulp lines in favor of shoe-press recycled machines.
Commercial Opportunity Analysis: Formulation Differentiation and Value-Add Formats
Mills unlock USD 120 to USD 180 per ton price premiums over standard brown testliner by engineering high-stiffness white-top and multi-layer recycled grades for retail display and structural applications. An October 2025 mechanical compression and life-cycle assessment study in Sustainability demonstrated that alternating flute orientation in recycled corrugated boards mitigates orthotropic buckling under vertical compressive loads while maintaining low environmental impact [15]. Sheet plants laminate or post-print these bright recycled outer liners to capture point-of-sale display contracts from folding carton and paperboard packaging.
Testliner Market by Country (2026 to 2036)
FMI country modeling indicates that Poland leads testliner expansion at a 4.2% CAGR through 2036, while Japan advances at 3.1% under mature lightweighting and carbon-footprint standards.
Table 7: Country CAGR and Primary Growth Levers for the Testliner Market (CAGR percentage and operational drivers), 2026 to 2036
| Country | CAGR (2026 to 2036) | Primary Growth Lever |
|---|---|---|
| Poland | 4.2% | Near-shored Central Europe e-commerce logistics and wide-web recycled paper machines |
| Spain | 3.7% | Fresh produce export cartons and Saica lightweight recycled linerboard R&D |
| United States | 3.6% | Structural shift toward 100% OCC linerboard and mill cost reconfigurations |
| United Kingdom | 3.5% | 100% recovered-fiber mill reliance and online grocery and shelf-ready retail boxes |
| Germany | 3.4% | 85%+ OCC recovery loop and downstream corrugated plant acquisitions |
| Italy | 3.3% | Mondi 420,000-tonne Duino mill conversion and food, wine, and industrial exports |
| France | 3.2% | National anti-waste plastic produce bans and August 2026 EU PPWR application |
| Japan | 3.1% | METI corrugated carbon-footprint rules and high-stiffness lightweight C-liner grades |
Source: Future Market Insights analysis
Poland Testliner Market Outlook (2026 to 2036)
Near-shored industrial manufacturing and e-commerce parcel fulfillment hubs make Poland the fastest-growing testliner market at a 4.2% CAGR through 2036. As Western European retailers relocate parcel distribution warehouses and appliance assembly lines into Silesia and central Poland, local corrugated box plants require steady domestic deliveries of 90 gsm to 135 gsm recycled linerboard reels. Wide-web paper machines in Swiecie and Ostroleka give Poland a modern, low-cost recycled containerboard base that exports surplus reels into neighboring Germany and the Czech Republic. Industrial output figures released by Statistics Poland in February 2026 confirmed sustained expansion across domestic paper and corrugated paperboard manufacturing supporting Central European export supply chains [16].
Key takeaway: In Poland, near-shored Central Europe e-commerce fulfillment and wide-web recycled containerboard machines sustain a 4.2% CAGR through 2036.
Spain Testliner Market Outlook (2026 to 2036)
Counter-seasonal fruit and vegetable exports anchor testliner demand in Spain, where containerboard reel consumption expands at a 3.7% annual clip from 2026 through 2036 across major agricultural packing hubs in Zaragoza and Valencia. Agricultural cooperatives shipping tomatoes and citrus to Northern European supermarkets are replacing single-use plastic crates and wooden trays with ventilated corrugated trays faced in moisture-resistant white-top testliner. Domestic mills led by Zaragoza-headquartered Saica specialize in ultra-lightweight 100% recycled linerboard that withstands high-humidity cold rooms while displaying high-contrast supermarket promotional graphics during refrigerated transit. National Statistics Institute industrial production tracking in March 2026 confirmed steady corrugated paperboard output across food and beverage export corridors in Spain [17].
Key takeaway: In Spain, fresh produce export cartons and domestic lightweight recycled linerboard innovation led by Saica are expected to sustain a 3.7% CAGR.
United States Testliner Market Outlook (2026 to 2036)
Mill furnish diversification from virgin kraftliner toward 100% recycled linerboard shapes the United States market, driving a 3.6% CAGR through 2036. While southern pine kraftliner historically dominated United States box specifications, greenfield and converted recycled paper machines in the Midwest and Northeast are capturing a growing share of domestic e-commerce parcel and dry-grocery shippers. According to U.S. Environmental Protection Agency sustainable materials management records updated in November 2025, corrugated boxes represent the single largest recovered paper stream in the United States and provide abundant domestic OCC feedstock [18]. Independent sheet feeders actively blend 100% OCC testliner inner facings with virgin outer liners to cut box cost without sacrificing edge-crush ratings.
Key takeaway: In the United States, structural shifts from virgin kraftliner toward 100% OCC recycled linerboard and high-speed e-commerce box plants are forecast to drive a 3.6% CAGR.
United Kingdom Testliner Market Outlook (2026 to 2036)
Near-total reliance on recovered fiber and high online grocery penetration define the United Kingdom market, where demand for recycled testliner advances at a 3.5% yearly pace across the 2026 to 2036 period. Because the United Kingdom lacks large commercial softwood kraft pulp mills, domestic containerboard machines in Kemsley and Manchester run almost exclusively on supermarket and municipal old corrugated container bales. DS Smith updated its recycled testliner and circular corrugated portfolio documentation in October 2025 to supply lightweight brown and white-top reels tailored for automated retail shelf-ready trays [19]. Supermarket chains across the United Kingdom specify coated white-top testliner to combine aisle branding with 100% curbside recycling.
Key takeaway: In the United Kingdom, 100% recovered-fiber mill reliance and supermarket shelf-ready and online grocery packaging are anticipated to support a 3.5% CAGR.
Germany Testliner Market Outlook (2026 to 2036)
Closed-loop wastepaper recovery and heavy industrial export shipping govern the testliner market in Germany, where recycled linerboard consumption progresses at a 3.4% CAGR through 2036. Automotive component and machinery logistics centers across North Rhine-Westphalia and Bavaria demand high-burst Testliner 1 and Testliner 2 grades that survive high-speed automated warehouse conveyors and multi-tier pallet racking. Federal Environment Agency packaging waste records published in December 2025 confirm that domestic paper and cardboard recovery in Germany consistently exceeds 85% and supplies clean secondary fiber to gap-former machines [20]. High industrial electricity and gas tariffs in Germany are simultaneously accelerating downstream box-plant acquisitions as recycled mill groups lock in captive reel off-take.
Key takeaway: In Germany, closed-loop OCC collection exceeding 85% and vertical integration between recycled mills and corrugated plants are estimated to drive a 3.4% CAGR.
Italy Testliner Market Outlook (2026 to 2036)
Newsprint-to-containerboard machine conversions and specialty food and fashion export cartons drive the market in Italy, where testliner valuation expands at a 3.3% yearly clip over the 10-year forecast period. Northern converting clusters in Lombardy and Veneto consume large volumes of white-top and brown testliner for wine shippers and ceramic tile boxes as well as luxury apparel parcels. Mondi expanded its ProVantage brown and white containerboard portfolio in November 2025 following the start-up of its converted recycled containerboard machine in Duino near Trieste [21]. Domestic substitution of imported Central European reels with local 90 gsm to 140 gsm recycled linerboard shortens lead times for sheet feeders across Italy.
Key takeaway: In Italy, Mondi's 420,000-tonne Duino mill conversion and food and industrial export cartons are projected to sustain a 3.3% CAGR.
France Testliner Market Outlook (2026 to 2036)
National anti-waste legislation and fresh-produce plastic bans propel testliner adoption in France, where sheet-feeder and integrated demand rises at a 3.2% CAGR through 2036. Supermarkets and dairy and produce packers in France have phased out shrink-film multipacks and plastic punnets in favor of micro-flute and B-flute corrugated trays faced with printable recycled testliner. On 25 February 2026, the European Commission issued updated secondary transport packaging guidance under the EU Packaging and Packaging Waste Regulation that reinforces recyclable fiberboard shippers across European logistics chains [22]. Integrated mills in northeastern and southwestern France are upgrading film-press starch sizing to supply moisture-resistant recycled liners for chilled agricultural crates and retail display cases.
Key takeaway: In France, national plastic-produce-wrap bans and EU PPWR enforcement from August 2026 are forecast to support a 3.2% CAGR for recycled testliner.
Japan Testliner Market Outlook (2026 to 2036)
Mandatory lifecycle carbon accounting and ultra-clean C-liner surface standards distinguish the market in Japan, where C-liner and testliner valuation climbs at a 3.1% yearly rate across the 10-year forecast horizon. Beverage and parcel couriers in Japan demand spotless outer liner surfaces with zero visible asphalt or ink specks and high ring-crush stiffness to survive humid summer storage and seismic warehouse racking. On 16 April 2025, Japan's Ministry of Economy and Industry published official Product Category Rules for calculating carbon footprints across corrugated board and containerboard [23]. Standardized carbon-footprint reporting encourages domestic brand owners in Japan to substitute lightweight recycled C-liner for higher-emission imported virgin kraftliner facings.
Key takeaway: In Japan, METI corrugated carbon-footprint calculation rules and high-stiffness lightweight C-liner engineering by domestic mills are predicted to sustain a 3.1% CAGR.
Full report country CAGRs cover North America, Latin America, Western Europe, Eastern Europe, East Asia, South Asia and Pacific, and Middle East and Africa.
Who are the notable companies in the testliner market?
Smurfit Westrock plc, International Paper Company, Mondi plc, DS Smith Plc, Packaging Corporation of America, Stora Enso Oyj, SAICA Group, Prinzhorn Holding GmbH, Nine Dragons Paper (Holdings) Limited, and Oji Holdings Corporation are the notable companies in the testliner market.
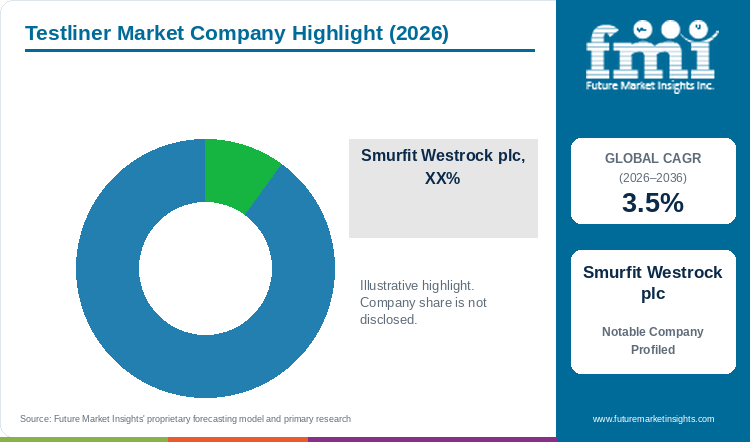
Competitive positioning in the testliner industry separates global multi-continent containerboard and corrugated megagroups from European 100% recycled containerboard specialists and Asian high-volume recycled linerboard producers.
- Global Multi-Continent Containerboard and Corrugated Leaders: Smurfit Westrock plc, International Paper Company, DS Smith Plc, and Mondi plc operate multi-continent recycled and virgin containerboard mills integrated with hundreds of box plants.
- Europe and North America Integrated Linerboard Producers: SAICA Group, Prinzhorn Holding GmbH, Stora Enso Oyj, and Packaging Corporation of America run wide-web gap-former machines and captive regional sheet plants.
- Asia High-Volume Recycled Linerboard and C-Liner Leaders: Nine Dragons Paper (Holdings) Limited and Oji Holdings Corporation operate mega-scale recycled testliner and C-liner complexes across East and Southeast Asia.
Competitive Benchmarking: Testliner Market
Table 8: Competitive Benchmarking for the Testliner Market (qualitative capability ratings), 2026
| Company | Recycled OCC Mill Scale | Lightweight & White-Top Grade Depth | Box Plant Integration Ratio | Geographic Corrugator Reach |
|---|---|---|---|---|
| Smurfit Westrock plc | High | High | High | Global multi-continent network; 25 recycled paper mills consuming 13.1M tons of fiber in 2025 |
| International Paper Company | High | High | High | North America and Europe footprint; completed DS Smith combination in January 2025 |
| Mondi plc | High | High | High | Europe recycled containerboard leader; started up 420k tpa Duino mill in September 2025 |
| DS Smith Plc | High | High | High | Europe circular packaging and Kemsley recycled mill network within International Paper |
| Packaging Corporation of America | High | Medium | High | US containerboard network; reconfigured Wallula mill in Dec 2025 to cut cost by USD 125/ton |
| Stora Enso Oyj | High | High | Medium | Ostroleka and Langerbrugge recycled containerboard mills; divested Germany box plants in Apr 2026 |
| SAICA Group | High | High | High | Spain and Europe 100% recycled lightweight testliner leader; 2025-2026 Saica Paper catalog |
| Prinzhorn Holding GmbH | High | High | High | Hamburger Containerboard mills; acquired Stora Enso Germany packaging plants in April 2026 |
| Nine Dragons Paper (Holdings) Limited | High | Medium | Medium | Mega-scale East Asia and ASEAN recycled testliner and high-performance linerboard mills |
| Oji Holdings Corporation | High | High | High | Japan and Southeast Asia C-liner and recycled containerboard integrated network |
Scoring basis: Recycled OCC Mill Scale evaluates annual recycled containerboard tonnage and wide-web machine speed, Lightweight & White-Top Grade Depth assesses 90 gsm to 115 gsm and coated white-top capabilities, Box Plant Integration Ratio measures captive internal reel off-take, and Geographic Corrugator Reach reflects multi-region converting presence.
Key Developments in the Testliner Market
- Smurfit Westrock reported on 30 April 2026 that first-quarter 2026 net sales reached USD 7712 million with Adjusted EBITDA of USD 1076 million across its global containerboard and corrugated packaging network [24].
- Packaging Corporation of America reported higher first-quarter 2026 corrugated products shipments and containerboard production on 22 April 2026 following its Western mill portfolio optimization [25].
- Stora Enso published its 2025 Annual Report in February 2026 detailing operational efficiency gains across its Ostroleka and Langerbrugge recycled containerboard machines [26].
Key Players in the Testliner Market
Global Multi-Continent Containerboard and Corrugated Leaders
- Smurfit Westrock plc
- International Paper Company
- DS Smith Plc
- Mondi plc
Europe and North America Integrated Linerboard Producers
- SAICA Group
- Prinzhorn Holding GmbH
- Stora Enso Oyj
- Packaging Corporation of America
Asia High-Volume Recycled Linerboard and C-Liner Leaders
- Nine Dragons Paper (Holdings) Limited
- Oji Holdings Corporation
Testliner Market - Report Scope
Table 9: Report Scope for the Testliner Market (coverage fields and definitions), 2026 to 2036
| Coverage field | Report scope |
|---|---|
| Market breakdown | Liner Grade; Basis Weight Grammage; Fiber Furnish; End-Use Application; Sales Channel |
| Quantitative Units | USD Billion |
| Market Definition | Includes commercial ex-mill and integrated transfer valuation of recycled linerboard (Uncoated Brown Testliner 1, 2, and 3, White Top Uncoated and Coated Testliner, Mottled and Color-Dyed Testliner, and Asian C-liner grades) manufactured predominantly from Old Corrugated Containers (OCC) and mixed recovered paper for corrugated board facings. Category Scope Note: Excludes unbleached and bleached virgin kraftliner (>80% virgin sulfate pulp), corrugating medium/fluting, and solid bleached sulfate folding boxboard. |
| Regions Covered | North America; Latin America; Western Europe; Eastern Europe; East Asia; South Asia and Pacific; Middle East and Africa |
| Countries Covered | Poland, Spain, United States, United Kingdom, Germany, Italy, France, Japan, and additional countries in the full report |
| Key Companies Covered | Smurfit Westrock plc, International Paper Company, Mondi plc, DS Smith Plc, Packaging Corporation of America, Stora Enso Oyj, SAICA Group, Prinzhorn Holding GmbH, Nine Dragons Paper (Holdings) Limited, Oji Holdings Corporation |
| Forecast Period | 2026 to 2036 |
| Approach | Primary and secondary research with top-down and bottom-up market triangulation. |
Testliner Market - Research Methodology
Table 10: Research Methodology for the Testliner Market (research methods and approach), 2026 edition
| Method | Approach |
|---|---|
| Primary Research | Structured interviews with recycled containerboard mill managers, corrugated box plant procurement directors, OCC waste-paper baling merchants, and paper machine sizing chemists to verify reel pricing and basis-weight shifts. |
| Secondary Research | Analysis of Cepi Key Statistics 2025 (published July 2026), European Commission Regulation (EU) 2025/40 PPWR mandates, PMC cellulose and lignin barrier studies, METI Japan CFP rules, and corporate filings. |
| Market Sizing and Forecasting | Top-down global containerboard production baselines reconciled against bottom-up recycled testliner tonnage (68.5M to 73.4M metric tons in 2026) and white-top/lightweight grade price realizations from 2026 to 2036. |
| Country Forecasting Model | Econometric country projections weight national corrugated box shipments, OCC collection rates, newsprint-to-testliner machine conversions, and e-commerce parcel volumes across eight national markets. |
| Operational Benchmark Traceability | Recycled linerboard tonnage and corrugator plant indicators in Tables 2, 3, and 4 trace to Cepi 76.4% recycling rate statistics, Smurfit Westrock 25-mill fiber disclosures, and Mondi Duino machine specifications. |
| Data Triangulation and Validation | Valuation estimates isolate recycled-furnish linerboard facings (testliner and C-liner) while strictly excluding virgin kraftliner reels, Wellenstoff/semichemical fluting medium, and downstream box converting value-add. |
Testliner Market by Segments
Testliner Market segmented by Liner Grade:
- Uncoated Brown Testliner 1, 2, and 3
- White Top Uncoated and Coated Testliner
- Mottled and Color-Dyed Testliner
- Water-Resistant and Barrier-Coated Testliner
Testliner Market segmented by Basis Weight Grammage:
- 115 gsm to 150 gsm Standard E-Commerce Weight
- Below 115 gsm Lightweight Micro-Flute Liner
- Above 150 gsm Heavy-Duty Industrial Liner
- Ultra-Lightweight Below 95 gsm Retail Liner
Testliner Market segmented by Fiber Furnish:
- 100% Old Corrugated Containers OCC Recycled Fiber
- OCC Blended with Virgin Kraft Top-Ply
- Mixed Recovered Paper and Deinked White Top Furnish
- Lignin and Nano-Cellulose Reinforced Recycled Furnish
- Agricultural Residue Blended Recycled Furnish
Testliner Market segmented by End-Use Application:
- E-Commerce Parcel and Retail Shipping Boxes
- Food and Beverage Secondary Transit Cartons
- Industrial and Consumer Durables Packaging
- Point-of-Sale Displays and Shelf-Ready Packaging
Testliner Market segmented by Sales Channel:
- Integrated Corrugated Box Plant Transfers
- Independent Sheet Feeder and Converter Contracts
- Wholesale Paperboard Merchants
- Export Containerboard Trading Channels
Testliner Market by Region
- North America
- United States
- Canada
- Latin America
- Brazil
- Mexico
- Argentina
- Chile
- Western Europe
- Germany
- France
- United Kingdom
- Italy
- Spain
- Benelux
- Nordics
- Eastern Europe
- Poland
- Czech Republic
- Romania
- Hungary
- East Asia
- China
- Japan
- South Korea
- South Asia and Pacific
- India
- ASEAN
- Australia and New Zealand
- Middle East and Africa
- GCC Countries
- South Africa
- Türkiye
- Israel
Research Sources and Bibliography
- [1] Confederation of European Paper Industries. (2026, July 14). Cepi Key Statistics 2025: European Pulp and Paper Industry Production and Recycling Rates. Cepi Brussels Statistical Annual.
- [2] Mondi plc. (2025, September 22). Mondi Duino marks start-up of recycled containerboard mill with international customers in Italy. Mondi Group News and Insight.
- [3] Smurfit Westrock plc. (2026, April 28). Smurfit Westrock 2025 Sustainability Report: Recycled Fiber Mills and Circular Packaging. Smurfit Westrock Corporate Publications.
- [4] Huang, W., Hu, X., Li, J., Hu, M., Qing, X., Wang, Q., Niu, Y., Zhu, X., & Wen, Y. (2026, June 2). Bridging the Performance Gap: High-Strength Lignin-Reinforced Cellulose Papers With Plastic-Like Barrier Properties. Small, 22(41), e12715 (PMCID PMC13392702).
- [5] NagarajaGanesh, B., Rekha, B., Krishna, M. G., & Ferozdheen, S. I. S. M. (2025, September 30). Ascertaining the Anatomical Parameters and Chemical Composition of Luffa cylindrica Cellulosic Fibers for Their Plausibility in Pulp and Paper Production. Polymers, 17(19), 2643 (PMCID PMC12526746).
- [6] Wu, R., Li, J., Ji, Z., Han, X., Zhang, D., Lim, K. H., Li, Z., Abitbol, T., Wang, W.-J., & Yang, X. (2026, April 29). Nanoengineered All-Cellulose Bilayer Barrier Papers for High-Performance and Recyclable Food Packaging. Chem & Bio Engineering, 3(6), 619-632 (PMCID PMC13312226).
- [7] Wei, B., Wang, M., Su, Y., & You, H. (2026, February 3). Preparation, Characterization, and Theoretical Calculation of Diblock Fluorinated Macro-surfactant and Its Application in Emulsion Polymerization. ACS Omega, 11(6), 9902-9914 (PMCID PMC12917666).
- [8] Stiegler, M., & Kandelbauer, A. (2025, August 8). Wettability of Kraft Paper with Biobased Impregnation Resins for Sustainable Packaging and Laminates. Polymers, 17(16), 2190 (PMCID PMC12368696).
- [9] SAICA Group. (2025, June 26). Saica Paper unveils its new 2025-2026 Products and Services Catalogue for Recycled Containerboard. SAICA Group Corporate Newsroom.
- [10] Chaudhary, S., Saha, A. K., & Sharma, M. K. (2025, February 27). A circular economy based nonlinear corrugated waste management system using Fermatean bipolar hesitant fuzzy logic. Scientific Reports, 15, 7012 (PMCID PMC11868656).
- [11] European Commission Directorate-General for Environment. (2026, August 11). New EU rules on packaging enter into application under Regulation (EU) 2025/40. European Commission Official Newsroom.
- [12] Prinzhorn Holding GmbH. (2026, April 21). Prinzhorn Group's Dunapack Packaging enters into an agreement with Stora Enso to take over its German packaging plants. Prinzhorn Group Holding Press Office.
- [13] International Paper Company. (2025, January 31). International Paper completes combination with DS Smith to create global sustainable packaging leader. International Paper Investor Relations.
- [14] Packaging Corporation of America. (2025, December 3). Packaging Corporation of America Announces Reconfiguration of Wallula Containerboard Mill. PCA Investor Relations News Releases.
- [15] Secchi, S., Cellai, G., & Nannipieri, E. (2025, October 1). Preliminary studies on recycling cardboard packaging into building panels: orthotropic compression and life cycle assessment. Sustainability, 17(19), 8642 (PMCID PMC12489104).
- [16] Glowny Urzad Statystyczny. (2026, February 24). Production of Major Industrial Products in Poland: Paper and Corrugated Paperboard. Statistics Poland GUS Industry Department.
- [17] Instituto Nacional de Estadistica. (2026, March 18). Industrial Production Index and Paperboard Packaging Output in Spain. Government of Spain INE Industrial Statistics.
- [18] U.S. Environmental Protection Agency. (2025, November 19). Sustainable Materials Management: Paper and Paperboard Recovery and Corrugated Box Recycling. U.S. EPA Resource Conservation and Sustainability.
- [19] DS Smith Plc. (2025, October 15). DS Smith Packaging and Paper Division: Recycled Testliner and Circular Corrugated Solutions. DS Smith Corporate Sustainability and Paper Division.
- [20] Umweltbundesamt. (2025, December 10). Packaging Consumption and Old Corrugated Container Recovery Rates in Germany. Federal Republic of Germany Environment Agency UBA.
- [21] Mondi plc. (2025, November 12). Mondi's Containerboard Portfolio Ready to Meet the Rising Demand for Sustainable High-Performance Packaging. Mondi Group News and Insight.
- [22] European Commission Directorate-General for Environment. (2026, February 25). Secondary Transport Packaging and Corrugated Box Circularity Rules under EU PPWR. European Commission Environment Newsroom.
- [23] Ministry of Economy, Trade and Industry. (2025, April 16). Carbon Footprint Product Category Rules for Corrugated Board and Containerboard. Government of Japan METI Energy and Environment Bureau.
- [24] Smurfit Westrock plc. (2026, April 30). Smurfit Westrock Reports First Quarter 2026 Financial Results. Smurfit Westrock Regulatory News.
- [25] Packaging Corporation of America. (2026, April 22). Packaging Corporation of America Reports First Quarter 2026 Results. PCA Investor Relations News Releases.
- [26] Stora Enso Oyj. (2026, February 12). Stora Enso Annual Report 2025: Packaging Materials and Containerboard Operations. Stora Enso Investor Download Center.
- [27] Smurfit Westrock plc. (2026, March 15). Smurfit Westrock 2025 Annual Report: Global Containerboard and Corrugated Operations. Smurfit Westrock Financial Reports.
- [28] Stora Enso Oyj. (2025, October 24). Avant Family Containerboard Brochure: Recycled Testliner and Fluting Specifications. Stora Enso Packaging Materials.
This bibliography is provided for reader reference and is not exhaustive. The full report contains the complete reference list and detailed source annotations.
This Report Answers
- How large is the testliner market in 2026 and what is forecast for 2036?
- Which e-commerce void-reduction rules and recycled-content mandates support demand for testliner?
- Why do Uncoated Brown Testliner Grades 1 through 3 lead the liner grade category?
- Why does 115 gsm to 150 gsm Standard E-Commerce Weight lead the basis weight category globally?
- How do growth rates differ between Poland and Spain as well as the United States and Germany?
- Which leading companies operate vertically integrated recycled mills versus independent reel sales today?
- What limits repeated OCC fiber repulping or narrow-web mill economics in the testliner market?
- What should corrugated converters evaluate before substituting lightweight testliner for virgin kraftliner?
Table of Content
Table of Content
- Key Takeaways
- Market Size and CAGR
- Top Growth Driver
- Fastest Growing Segment
- Leading Region
- Key Companies
- Emerging Opportunities
- Executive Summary
- Global Market Outlook
- Demand-side Trends
- Supply-side Trends
- Technology Roadmap Analysis
- Analysis and Recommendations
- Analyst Perspective (What is happening? Why now? What should investors know?)
- Key Questions Answered
- How large is the market?
- What is the CAGR?
- What are key trends?
- Which region dominates?
- Who are the leaders?
Read More...
- Market Overview
- Market Coverage / Taxonomy
- Market Definition / Scope / Limitations
- Research Methodology
- Chapter Orientation
- Analytical Lens and Working Hypotheses
- Market Structure, Signals, and Trend Drivers
- Benchmarking and Cross-market Comparability
- Market Sizing, Forecasting, and Opportunity Mapping
- Research Design and Evidence Framework
- Desk Research Programme (Secondary Evidence)
- Expert Input and Fieldwork (Primary Evidence)
- Tooling, Models, and Reference Databases
- Data Engineering and Model Build
- Quality Assurance and Audit Trail
- Market Background
- Market Dynamics (Drivers, Restraints, Opportunity, Trends)
- Scenario Forecast (Optimistic, Likely, Conservative)
- Impact Analysis
- AI Impact
- Sustainability Impact
- Regulatory Impact
- Technology Impact
- Consumer / Buyer Analysis
- Purchase Drivers
- Adoption Barriers
- Buyer Journey
- Opportunity Map Analysis
- Product Life Cycle Analysis
- Supply Chain Analysis
- Investment Feasibility Matrix
- Value Chain Analysis
- PESTLE and Porter's Analysis
- Regulatory Landscape
- Regional Parent Market Outlook
- Production and Consumption Statistics
- Import and Export Statistics
- Global Market Analysis and Forecast, 2021 to 2036
- Historical Market Size Value (USD Billion) Analysis, 2021 to 2025
- Current and Future Market Size Value (USD Billion) Projections, 2026 to 2036
- Y-o-Y Growth Trend Analysis
- Absolute $ Opportunity Analysis
- Global Market Pricing Analysis, 2021 to 2036
- Global Market Analysis and Forecast, By Liner Grade, 2021 to 2036
- Introduction / Key Findings
- Historical Market Size Value (USD Billion) Analysis By Liner Grade, 2021 to 2025
- Current and Future Market Size Value (USD Billion) Analysis and Forecast By Liner Grade, 2026 to 2036
- Uncoated Brown Testliner 1, 2, and 3
- White Top Uncoated and Coated Testliner
- Mottled and Color-Dyed Testliner
- Water-Resistant and Barrier-Coated Testliner
- Y-o-Y Growth Trend Analysis By Liner Grade, 2021 to 2025
- Absolute $ Opportunity Analysis By Liner Grade, 2026 to 2036
- Global Market Analysis and Forecast, By Basis Weight Grammage, 2021 to 2036
- Introduction / Key Findings
- Historical Market Size Value (USD Billion) Analysis By Basis Weight Grammage, 2021 to 2025
- Current and Future Market Size Value (USD Billion) Analysis and Forecast By Basis Weight Grammage, 2026 to 2036
- 115 gsm to 150 gsm Standard E-Commerce Weight
- Below 115 gsm Lightweight Micro-Flute Liner
- Above 150 gsm Heavy-Duty Industrial Liner
- Ultra-Lightweight Below 95 gsm Retail Liner
- Y-o-Y Growth Trend Analysis By Basis Weight Grammage, 2021 to 2025
- Absolute $ Opportunity Analysis By Basis Weight Grammage, 2026 to 2036
- Global Market Analysis and Forecast, By Fiber Furnish, 2021 to 2036
- Introduction / Key Findings
- Historical Market Size Value (USD Billion) Analysis By Fiber Furnish, 2021 to 2025
- Current and Future Market Size Value (USD Billion) Analysis and Forecast By Fiber Furnish, 2026 to 2036
- 100% Old Corrugated Containers OCC Recycled Fiber
- OCC Blended with Virgin Kraft Top-Ply
- Mixed Recovered Paper and Deinked White Top Furnish
- Lignin and Nano-Cellulose Reinforced Recycled Furnish
- Agricultural Residue Blended Recycled Furnish
- Y-o-Y Growth Trend Analysis By Fiber Furnish, 2021 to 2025
- Absolute $ Opportunity Analysis By Fiber Furnish, 2026 to 2036
- Global Market Analysis and Forecast, By End-Use Application, 2021 to 2036
- Introduction / Key Findings
- Historical Market Size Value (USD Billion) Analysis By End-Use Application, 2021 to 2025
- Current and Future Market Size Value (USD Billion) Analysis and Forecast By End-Use Application, 2026 to 2036
- E-Commerce Parcel and Retail Shipping Boxes
- Food and Beverage Secondary Transit Cartons
- Industrial and Consumer Durables Packaging
- Point-of-Sale Displays and Shelf-Ready Packaging
- Y-o-Y Growth Trend Analysis By End-Use Application, 2021 to 2025
- Absolute $ Opportunity Analysis By End-Use Application, 2026 to 2036
- Global Market Analysis and Forecast, By Sales Channel, 2021 to 2036
- Introduction / Key Findings
- Historical Market Size Value (USD Billion) Analysis By Sales Channel, 2021 to 2025
- Current and Future Market Size Value (USD Billion) Analysis and Forecast By Sales Channel, 2026 to 2036
- Integrated Corrugated Box Plant Transfers
- Independent Sheet Feeder and Converter Contracts
- Wholesale Paperboard Merchants
- Export Containerboard Trading Channels
- Y-o-Y Growth Trend Analysis By Sales Channel, 2021 to 2025
- Absolute $ Opportunity Analysis By Sales Channel, 2026 to 2036
- Global Market Analysis and Forecast, By Region, 2021 to 2036
- Introduction
- Historical Market Size Value (USD Billion) Analysis By Region, 2021 to 2025
- Current Market Size Value (USD Billion) Analysis and Forecast By Region, 2026 to 2036
- North America
- Latin America
- Western Europe
- Eastern Europe
- East Asia
- South Asia and Pacific
- Middle East and Africa
- Market Attractiveness Analysis By Region
- North America Market Analysis and Forecast, By Country, 2021 to 2036
- Historical Market Size Value (USD Billion) Trend Analysis By Market Taxonomy, 2021 to 2025
- Market Size Value (USD Billion) Forecast By Market Taxonomy, 2026 to 2036
- By Country
- United States
- Canada
- By Liner Grade
- By Basis Weight Grammage
- By Fiber Furnish
- By End-Use Application
- By Sales Channel
- By Country
- Market Attractiveness Analysis
- By Country
- By Liner Grade
- By Basis Weight Grammage
- By Fiber Furnish
- By End-Use Application
- By Sales Channel
- Key Takeaways
- Latin America Market Analysis and Forecast, By Country
- Historical Market Size Value (USD Billion) Trend Analysis By Market Taxonomy, 2021 to 2025
- Market Size Value (USD Billion) Forecast By Market Taxonomy, 2026 to 2036
- By Country
- Brazil
- Mexico
- Argentina
- Chile
- By Liner Grade
- By Basis Weight Grammage
- By Fiber Furnish
- By End-Use Application
- By Sales Channel
- By Country
- Market Attractiveness Analysis
- By Country
- By Liner Grade
- By Basis Weight Grammage
- By Fiber Furnish
- By End-Use Application
- By Sales Channel
- Key Takeaways
- Western Europe Market Analysis and Forecast, By Country
- Historical Market Size Value (USD Billion) Trend Analysis By Market Taxonomy, 2021 to 2025
- Market Size Value (USD Billion) Forecast By Market Taxonomy, 2026 to 2036
- By Country
- Germany
- France
- United Kingdom
- Italy
- Spain
- Benelux
- Nordics
- By Liner Grade
- By Basis Weight Grammage
- By Fiber Furnish
- By End-Use Application
- By Sales Channel
- By Country
- Market Attractiveness Analysis
- By Country
- By Liner Grade
- By Basis Weight Grammage
- By Fiber Furnish
- By End-Use Application
- By Sales Channel
- Key Takeaways
- Eastern Europe Market Analysis and Forecast, By Country
- Historical Market Size Value (USD Billion) Trend Analysis By Market Taxonomy, 2021 to 2025
- Market Size Value (USD Billion) Forecast By Market Taxonomy, 2026 to 2036
- By Country
- Poland
- Czech Republic
- Romania
- Hungary
- By Liner Grade
- By Basis Weight Grammage
- By Fiber Furnish
- By End-Use Application
- By Sales Channel
- By Country
- Market Attractiveness Analysis
- By Country
- By Liner Grade
- By Basis Weight Grammage
- By Fiber Furnish
- By End-Use Application
- By Sales Channel
- Key Takeaways
- East Asia Market Analysis and Forecast, By Country
- Historical Market Size Value (USD Billion) Trend Analysis By Market Taxonomy, 2021 to 2025
- Market Size Value (USD Billion) Forecast By Market Taxonomy, 2026 to 2036
- By Country
- China
- Japan
- South Korea
- By Liner Grade
- By Basis Weight Grammage
- By Fiber Furnish
- By End-Use Application
- By Sales Channel
- By Country
- Market Attractiveness Analysis
- By Country
- By Liner Grade
- By Basis Weight Grammage
- By Fiber Furnish
- By End-Use Application
- By Sales Channel
- Key Takeaways
- South Asia and Pacific Market Analysis and Forecast, By Country
- Historical Market Size Value (USD Billion) Trend Analysis By Market Taxonomy, 2021 to 2025
- Market Size Value (USD Billion) Forecast By Market Taxonomy, 2026 to 2036
- By Country
- India
- ASEAN
- Australia and New Zealand
- By Liner Grade
- By Basis Weight Grammage
- By Fiber Furnish
- By End-Use Application
- By Sales Channel
- By Country
- Market Attractiveness Analysis
- By Country
- By Liner Grade
- By Basis Weight Grammage
- By Fiber Furnish
- By End-Use Application
- By Sales Channel
- Key Takeaways
- Middle East and Africa Market Analysis and Forecast, By Country
- Historical Market Size Value (USD Billion) Trend Analysis By Market Taxonomy, 2021 to 2025
- Market Size Value (USD Billion) Forecast By Market Taxonomy, 2026 to 2036
- By Country
- GCC Countries
- South Africa
- Türkiye
- Israel
- By Liner Grade
- By Basis Weight Grammage
- By Fiber Furnish
- By End-Use Application
- By Sales Channel
- By Country
- Market Attractiveness Analysis
- By Country
- By Liner Grade
- By Basis Weight Grammage
- By Fiber Furnish
- By End-Use Application
- By Sales Channel
- Key Takeaways
- Key Countries Market Analysis
- United States
- Pricing Analysis
- Market Share Analysis, 2025
- By Liner Grade
- By Basis Weight Grammage
- By Fiber Furnish
- By End-Use Application
- By Sales Channel
- Canada
- Pricing Analysis
- Market Share Analysis, 2025
- By Liner Grade
- By Basis Weight Grammage
- By Fiber Furnish
- By End-Use Application
- By Sales Channel
- Mexico
- Pricing Analysis
- Market Share Analysis, 2025
- By Liner Grade
- By Basis Weight Grammage
- By Fiber Furnish
- By End-Use Application
- By Sales Channel
- Brazil
- Pricing Analysis
- Market Share Analysis, 2025
- By Liner Grade
- By Basis Weight Grammage
- By Fiber Furnish
- By End-Use Application
- By Sales Channel
- Chile
- Pricing Analysis
- Market Share Analysis, 2025
- By Liner Grade
- By Basis Weight Grammage
- By Fiber Furnish
- By End-Use Application
- By Sales Channel
- Germany
- Pricing Analysis
- Market Share Analysis, 2025
- By Liner Grade
- By Basis Weight Grammage
- By Fiber Furnish
- By End-Use Application
- By Sales Channel
- United Kingdom
- Pricing Analysis
- Market Share Analysis, 2025
- By Liner Grade
- By Basis Weight Grammage
- By Fiber Furnish
- By End-Use Application
- By Sales Channel
- Italy
- Pricing Analysis
- Market Share Analysis, 2025
- By Liner Grade
- By Basis Weight Grammage
- By Fiber Furnish
- By End-Use Application
- By Sales Channel
- Spain
- Pricing Analysis
- Market Share Analysis, 2025
- By Liner Grade
- By Basis Weight Grammage
- By Fiber Furnish
- By End-Use Application
- By Sales Channel
- France
- Pricing Analysis
- Market Share Analysis, 2025
- By Liner Grade
- By Basis Weight Grammage
- By Fiber Furnish
- By End-Use Application
- By Sales Channel
- India
- Pricing Analysis
- Market Share Analysis, 2025
- By Liner Grade
- By Basis Weight Grammage
- By Fiber Furnish
- By End-Use Application
- By Sales Channel
- ASEAN
- Pricing Analysis
- Market Share Analysis, 2025
- By Liner Grade
- By Basis Weight Grammage
- By Fiber Furnish
- By End-Use Application
- By Sales Channel
- Australia and New Zealand
- Pricing Analysis
- Market Share Analysis, 2025
- By Liner Grade
- By Basis Weight Grammage
- By Fiber Furnish
- By End-Use Application
- By Sales Channel
- China
- Pricing Analysis
- Market Share Analysis, 2025
- By Liner Grade
- By Basis Weight Grammage
- By Fiber Furnish
- By End-Use Application
- By Sales Channel
- Japan
- Pricing Analysis
- Market Share Analysis, 2025
- By Liner Grade
- By Basis Weight Grammage
- By Fiber Furnish
- By End-Use Application
- By Sales Channel
- South Korea
- Pricing Analysis
- Market Share Analysis, 2025
- By Liner Grade
- By Basis Weight Grammage
- By Fiber Furnish
- By End-Use Application
- By Sales Channel
- Poland
- Pricing Analysis
- Market Share Analysis, 2025
- By Liner Grade
- By Basis Weight Grammage
- By Fiber Furnish
- By End-Use Application
- By Sales Channel
- Hungary
- Pricing Analysis
- Market Share Analysis, 2025
- By Liner Grade
- By Basis Weight Grammage
- By Fiber Furnish
- By End-Use Application
- By Sales Channel
- Türkiye
- Pricing Analysis
- Market Share Analysis, 2025
- By Liner Grade
- By Basis Weight Grammage
- By Fiber Furnish
- By End-Use Application
- By Sales Channel
- South Africa
- Pricing Analysis
- Market Share Analysis, 2025
- By Liner Grade
- By Basis Weight Grammage
- By Fiber Furnish
- By End-Use Application
- By Sales Channel
- United States
- Market Structure Analysis
- Competition Dashboard
- Competition Benchmarking
- Market Share Analysis of Top Players
- By Regional
- By Liner Grade
- By Basis Weight Grammage
- By Fiber Furnish
- By End-Use Application
- By Sales Channel
- Emerging Startups
- Innovation Benchmarking
- Competition Analysis
- Competition Deep Dive
- Smurfit Westrock plc
- Overview
- Product Portfolio
- Profitability by Market Segments
- Sales Footprint
- Strategy Overview
- Marketing Strategy
- Product Strategy
- Channel Strategy
- International Paper Company
- Mondi plc
- DS Smith Plc
- Packaging Corporation of America
- Stora Enso Oyj
- SAICA Group
- Prinzhorn Holding GmbH
- Nine Dragons Paper (Holdings) Limited
- Oji Holdings Corporation
- Smurfit Westrock plc
- Case Studies
- Success Stories
- Recent Developments
- Competition Deep Dive
- Assumptions & Acronyms Used
List of Tables
- Table 1: Global Market Value (USD Billion) Forecast by Region, 2021 to 2036
- Table 2: Global Market Value (USD Billion) Forecast by Liner Grade, 2021 to 2036
- Table 3: Global Market Value (USD Billion) Forecast by Basis Weight Grammage, 2021 to 2036
- Table 4: Global Market Value (USD Billion) Forecast by Fiber Furnish, 2021 to 2036
- Table 5: Global Market Value (USD Billion) Forecast by End-Use Application, 2021 to 2036
- Table 6: Global Market Value (USD Billion) Forecast by Sales Channel, 2021 to 2036
- Table 7: North America Market Value (USD Billion) Forecast by Country, 2021 to 2036
- Table 8: North America Market Value (USD Billion) Forecast by Liner Grade, 2021 to 2036
- Table 9: North America Market Value (USD Billion) Forecast by Basis Weight Grammage, 2021 to 2036
- Table 10: North America Market Value (USD Billion) Forecast by Fiber Furnish, 2021 to 2036
- Table 11: North America Market Value (USD Billion) Forecast by End-Use Application, 2021 to 2036
- Table 12: North America Market Value (USD Billion) Forecast by Sales Channel, 2021 to 2036
- Table 13: Latin America Market Value (USD Billion) Forecast by Country, 2021 to 2036
- Table 14: Latin America Market Value (USD Billion) Forecast by Liner Grade, 2021 to 2036
- Table 15: Latin America Market Value (USD Billion) Forecast by Basis Weight Grammage, 2021 to 2036
- Table 16: Latin America Market Value (USD Billion) Forecast by Fiber Furnish, 2021 to 2036
- Table 17: Latin America Market Value (USD Billion) Forecast by End-Use Application, 2021 to 2036
- Table 18: Latin America Market Value (USD Billion) Forecast by Sales Channel, 2021 to 2036
- Table 19: Western Europe Market Value (USD Billion) Forecast by Country, 2021 to 2036
- Table 20: Western Europe Market Value (USD Billion) Forecast by Liner Grade, 2021 to 2036
- Table 21: Western Europe Market Value (USD Billion) Forecast by Basis Weight Grammage, 2021 to 2036
- Table 22: Western Europe Market Value (USD Billion) Forecast by Fiber Furnish, 2021 to 2036
- Table 23: Western Europe Market Value (USD Billion) Forecast by End-Use Application, 2021 to 2036
- Table 24: Western Europe Market Value (USD Billion) Forecast by Sales Channel, 2021 to 2036
- Table 25: Eastern Europe Market Value (USD Billion) Forecast by Country, 2021 to 2036
- Table 26: Eastern Europe Market Value (USD Billion) Forecast by Liner Grade, 2021 to 2036
- Table 27: Eastern Europe Market Value (USD Billion) Forecast by Basis Weight Grammage, 2021 to 2036
- Table 28: Eastern Europe Market Value (USD Billion) Forecast by Fiber Furnish, 2021 to 2036
- Table 29: Eastern Europe Market Value (USD Billion) Forecast by End-Use Application, 2021 to 2036
- Table 30: Eastern Europe Market Value (USD Billion) Forecast by Sales Channel, 2021 to 2036
- Table 31: East Asia Market Value (USD Billion) Forecast by Country, 2021 to 2036
- Table 32: East Asia Market Value (USD Billion) Forecast by Liner Grade, 2021 to 2036
- Table 33: East Asia Market Value (USD Billion) Forecast by Basis Weight Grammage, 2021 to 2036
- Table 34: East Asia Market Value (USD Billion) Forecast by Fiber Furnish, 2021 to 2036
- Table 35: East Asia Market Value (USD Billion) Forecast by End-Use Application, 2021 to 2036
- Table 36: East Asia Market Value (USD Billion) Forecast by Sales Channel, 2021 to 2036
- Table 37: South Asia and Pacific Market Value (USD Billion) Forecast by Country, 2021 to 2036
- Table 38: South Asia and Pacific Market Value (USD Billion) Forecast by Liner Grade, 2021 to 2036
- Table 39: South Asia and Pacific Market Value (USD Billion) Forecast by Basis Weight Grammage, 2021 to 2036
- Table 40: South Asia and Pacific Market Value (USD Billion) Forecast by Fiber Furnish, 2021 to 2036
- Table 41: South Asia and Pacific Market Value (USD Billion) Forecast by End-Use Application, 2021 to 2036
- Table 42: South Asia and Pacific Market Value (USD Billion) Forecast by Sales Channel, 2021 to 2036
- Table 43: Middle East and Africa Market Value (USD Billion) Forecast by Country, 2021 to 2036
- Table 44: Middle East and Africa Market Value (USD Billion) Forecast by Liner Grade, 2021 to 2036
- Table 45: Middle East and Africa Market Value (USD Billion) Forecast by Basis Weight Grammage, 2021 to 2036
- Table 46: Middle East and Africa Market Value (USD Billion) Forecast by Fiber Furnish, 2021 to 2036
- Table 47: Middle East and Africa Market Value (USD Billion) Forecast by End-Use Application, 2021 to 2036
- Table 48: Middle East and Africa Market Value (USD Billion) Forecast by Sales Channel, 2021 to 2036
List of Figures
- Figure 1: Global Market Pricing Analysis
- Figure 2: Global Market Value (USD Billion) Forecast 2021-2036
- Figure 3: Global Market Value Share and BPS Analysis by Liner Grade, 2026 and 2036
- Figure 4: Global Market Y-o-Y Growth Comparison by Liner Grade, 2026-2036
- Figure 5: Global Market Attractiveness Analysis by Liner Grade
- Figure 6: Global Market Value Share and BPS Analysis by Basis Weight Grammage, 2026 and 2036
- Figure 7: Global Market Y-o-Y Growth Comparison by Basis Weight Grammage, 2026-2036
- Figure 8: Global Market Attractiveness Analysis by Basis Weight Grammage
- Figure 9: Global Market Value Share and BPS Analysis by Fiber Furnish, 2026 and 2036
- Figure 10: Global Market Y-o-Y Growth Comparison by Fiber Furnish, 2026-2036
- Figure 11: Global Market Attractiveness Analysis by Fiber Furnish
- Figure 12: Global Market Value Share and BPS Analysis by End-Use Application, 2026 and 2036
- Figure 13: Global Market Y-o-Y Growth Comparison by End-Use Application, 2026-2036
- Figure 14: Global Market Attractiveness Analysis by End-Use Application
- Figure 15: Global Market Value Share and BPS Analysis by Sales Channel, 2026 and 2036
- Figure 16: Global Market Y-o-Y Growth Comparison by Sales Channel, 2026-2036
- Figure 17: Global Market Attractiveness Analysis by Sales Channel
- Figure 18: Global Market Value (USD Billion) Share and BPS Analysis by Region, 2026 and 2036
- Figure 19: Global Market Y-o-Y Growth Comparison by Region, 2026-2036
- Figure 20: Global Market Attractiveness Analysis by Region
- Figure 21: North America Market Incremental Dollar Opportunity, 2026-2036
- Figure 22: Latin America Market Incremental Dollar Opportunity, 2026-2036
- Figure 23: Western Europe Market Incremental Dollar Opportunity, 2026-2036
- Figure 24: Eastern Europe Market Incremental Dollar Opportunity, 2026-2036
- Figure 25: East Asia Market Incremental Dollar Opportunity, 2026-2036
- Figure 26: South Asia and Pacific Market Incremental Dollar Opportunity, 2026-2036
- Figure 27: Middle East and Africa Market Incremental Dollar Opportunity, 2026-2036
- Figure 28: North America Market Value Share and BPS Analysis by Country, 2026 and 2036
- Figure 29: North America Market Value Share and BPS Analysis by Liner Grade, 2026 and 2036
- Figure 30: North America Market Y-o-Y Growth Comparison by Liner Grade, 2026-2036
- Figure 31: North America Market Attractiveness Analysis by Liner Grade
- Figure 32: North America Market Value Share and BPS Analysis by Basis Weight Grammage, 2026 and 2036
- Figure 33: North America Market Y-o-Y Growth Comparison by Basis Weight Grammage, 2026-2036
- Figure 34: North America Market Attractiveness Analysis by Basis Weight Grammage
- Figure 35: North America Market Value Share and BPS Analysis by Fiber Furnish, 2026 and 2036
- Figure 36: North America Market Y-o-Y Growth Comparison by Fiber Furnish, 2026-2036
- Figure 37: North America Market Attractiveness Analysis by Fiber Furnish
- Figure 38: North America Market Value Share and BPS Analysis by End-Use Application, 2026 and 2036
- Figure 39: North America Market Y-o-Y Growth Comparison by End-Use Application, 2026-2036
- Figure 40: North America Market Attractiveness Analysis by End-Use Application
- Figure 41: North America Market Value Share and BPS Analysis by Sales Channel, 2026 and 2036
- Figure 42: North America Market Y-o-Y Growth Comparison by Sales Channel, 2026-2036
- Figure 43: North America Market Attractiveness Analysis by Sales Channel
- Figure 44: Latin America Market Value Share and BPS Analysis by Country, 2026 and 2036
- Figure 45: Latin America Market Value Share and BPS Analysis by Liner Grade, 2026 and 2036
- Figure 46: Latin America Market Y-o-Y Growth Comparison by Liner Grade, 2026-2036
- Figure 47: Latin America Market Attractiveness Analysis by Liner Grade
- Figure 48: Latin America Market Value Share and BPS Analysis by Basis Weight Grammage, 2026 and 2036
- Figure 49: Latin America Market Y-o-Y Growth Comparison by Basis Weight Grammage, 2026-2036
- Figure 50: Latin America Market Attractiveness Analysis by Basis Weight Grammage
- Figure 51: Latin America Market Value Share and BPS Analysis by Fiber Furnish, 2026 and 2036
- Figure 52: Latin America Market Y-o-Y Growth Comparison by Fiber Furnish, 2026-2036
- Figure 53: Latin America Market Attractiveness Analysis by Fiber Furnish
- Figure 54: Latin America Market Value Share and BPS Analysis by End-Use Application, 2026 and 2036
- Figure 55: Latin America Market Y-o-Y Growth Comparison by End-Use Application, 2026-2036
- Figure 56: Latin America Market Attractiveness Analysis by End-Use Application
- Figure 57: Latin America Market Value Share and BPS Analysis by Sales Channel, 2026 and 2036
- Figure 58: Latin America Market Y-o-Y Growth Comparison by Sales Channel, 2026-2036
- Figure 59: Latin America Market Attractiveness Analysis by Sales Channel
- Figure 60: Western Europe Market Value Share and BPS Analysis by Country, 2026 and 2036
- Figure 61: Western Europe Market Value Share and BPS Analysis by Liner Grade, 2026 and 2036
- Figure 62: Western Europe Market Y-o-Y Growth Comparison by Liner Grade, 2026-2036
- Figure 63: Western Europe Market Attractiveness Analysis by Liner Grade
- Figure 64: Western Europe Market Value Share and BPS Analysis by Basis Weight Grammage, 2026 and 2036
- Figure 65: Western Europe Market Y-o-Y Growth Comparison by Basis Weight Grammage, 2026-2036
- Figure 66: Western Europe Market Attractiveness Analysis by Basis Weight Grammage
- Figure 67: Western Europe Market Value Share and BPS Analysis by Fiber Furnish, 2026 and 2036
- Figure 68: Western Europe Market Y-o-Y Growth Comparison by Fiber Furnish, 2026-2036
- Figure 69: Western Europe Market Attractiveness Analysis by Fiber Furnish
- Figure 70: Western Europe Market Value Share and BPS Analysis by End-Use Application, 2026 and 2036
- Figure 71: Western Europe Market Y-o-Y Growth Comparison by End-Use Application, 2026-2036
- Figure 72: Western Europe Market Attractiveness Analysis by End-Use Application
- Figure 73: Western Europe Market Value Share and BPS Analysis by Sales Channel, 2026 and 2036
- Figure 74: Western Europe Market Y-o-Y Growth Comparison by Sales Channel, 2026-2036
- Figure 75: Western Europe Market Attractiveness Analysis by Sales Channel
- Figure 76: Eastern Europe Market Value Share and BPS Analysis by Country, 2026 and 2036
- Figure 77: Eastern Europe Market Value Share and BPS Analysis by Liner Grade, 2026 and 2036
- Figure 78: Eastern Europe Market Y-o-Y Growth Comparison by Liner Grade, 2026-2036
- Figure 79: Eastern Europe Market Attractiveness Analysis by Liner Grade
- Figure 80: Eastern Europe Market Value Share and BPS Analysis by Basis Weight Grammage, 2026 and 2036
- Figure 81: Eastern Europe Market Y-o-Y Growth Comparison by Basis Weight Grammage, 2026-2036
- Figure 82: Eastern Europe Market Attractiveness Analysis by Basis Weight Grammage
- Figure 83: Eastern Europe Market Value Share and BPS Analysis by Fiber Furnish, 2026 and 2036
- Figure 84: Eastern Europe Market Y-o-Y Growth Comparison by Fiber Furnish, 2026-2036
- Figure 85: Eastern Europe Market Attractiveness Analysis by Fiber Furnish
- Figure 86: Eastern Europe Market Value Share and BPS Analysis by End-Use Application, 2026 and 2036
- Figure 87: Eastern Europe Market Y-o-Y Growth Comparison by End-Use Application, 2026-2036
- Figure 88: Eastern Europe Market Attractiveness Analysis by End-Use Application
- Figure 89: Eastern Europe Market Value Share and BPS Analysis by Sales Channel, 2026 and 2036
- Figure 90: Eastern Europe Market Y-o-Y Growth Comparison by Sales Channel, 2026-2036
- Figure 91: Eastern Europe Market Attractiveness Analysis by Sales Channel
- Figure 92: East Asia Market Value Share and BPS Analysis by Country, 2026 and 2036
- Figure 93: East Asia Market Value Share and BPS Analysis by Liner Grade, 2026 and 2036
- Figure 94: East Asia Market Y-o-Y Growth Comparison by Liner Grade, 2026-2036
- Figure 95: East Asia Market Attractiveness Analysis by Liner Grade
- Figure 96: East Asia Market Value Share and BPS Analysis by Basis Weight Grammage, 2026 and 2036
- Figure 97: East Asia Market Y-o-Y Growth Comparison by Basis Weight Grammage, 2026-2036
- Figure 98: East Asia Market Attractiveness Analysis by Basis Weight Grammage
- Figure 99: East Asia Market Value Share and BPS Analysis by Fiber Furnish, 2026 and 2036
- Figure 100: East Asia Market Y-o-Y Growth Comparison by Fiber Furnish, 2026-2036
- Figure 101: East Asia Market Attractiveness Analysis by Fiber Furnish
- Figure 102: East Asia Market Value Share and BPS Analysis by End-Use Application, 2026 and 2036
- Figure 103: East Asia Market Y-o-Y Growth Comparison by End-Use Application, 2026-2036
- Figure 104: East Asia Market Attractiveness Analysis by End-Use Application
- Figure 105: East Asia Market Value Share and BPS Analysis by Sales Channel, 2026 and 2036
- Figure 106: East Asia Market Y-o-Y Growth Comparison by Sales Channel, 2026-2036
- Figure 107: East Asia Market Attractiveness Analysis by Sales Channel
- Figure 108: South Asia and Pacific Market Value Share and BPS Analysis by Country, 2026 and 2036
- Figure 109: South Asia and Pacific Market Value Share and BPS Analysis by Liner Grade, 2026 and 2036
- Figure 110: South Asia and Pacific Market Y-o-Y Growth Comparison by Liner Grade, 2026-2036
- Figure 111: South Asia and Pacific Market Attractiveness Analysis by Liner Grade
- Figure 112: South Asia and Pacific Market Value Share and BPS Analysis by Basis Weight Grammage, 2026 and 2036
- Figure 113: South Asia and Pacific Market Y-o-Y Growth Comparison by Basis Weight Grammage, 2026-2036
- Figure 114: South Asia and Pacific Market Attractiveness Analysis by Basis Weight Grammage
- Figure 115: South Asia and Pacific Market Value Share and BPS Analysis by Fiber Furnish, 2026 and 2036
- Figure 116: South Asia and Pacific Market Y-o-Y Growth Comparison by Fiber Furnish, 2026-2036
- Figure 117: South Asia and Pacific Market Attractiveness Analysis by Fiber Furnish
- Figure 118: South Asia and Pacific Market Value Share and BPS Analysis by End-Use Application, 2026 and 2036
- Figure 119: South Asia and Pacific Market Y-o-Y Growth Comparison by End-Use Application, 2026-2036
- Figure 120: South Asia and Pacific Market Attractiveness Analysis by End-Use Application
- Figure 121: South Asia and Pacific Market Value Share and BPS Analysis by Sales Channel, 2026 and 2036
- Figure 122: South Asia and Pacific Market Y-o-Y Growth Comparison by Sales Channel, 2026-2036
- Figure 123: South Asia and Pacific Market Attractiveness Analysis by Sales Channel
- Figure 124: Middle East and Africa Market Value Share and BPS Analysis by Country, 2026 and 2036
- Figure 125: Middle East and Africa Market Value Share and BPS Analysis by Liner Grade, 2026 and 2036
- Figure 126: Middle East and Africa Market Y-o-Y Growth Comparison by Liner Grade, 2026-2036
- Figure 127: Middle East and Africa Market Attractiveness Analysis by Liner Grade
- Figure 128: Middle East and Africa Market Value Share and BPS Analysis by Basis Weight Grammage, 2026 and 2036
- Figure 129: Middle East and Africa Market Y-o-Y Growth Comparison by Basis Weight Grammage, 2026-2036
- Figure 130: Middle East and Africa Market Attractiveness Analysis by Basis Weight Grammage
- Figure 131: Middle East and Africa Market Value Share and BPS Analysis by Fiber Furnish, 2026 and 2036
- Figure 132: Middle East and Africa Market Y-o-Y Growth Comparison by Fiber Furnish, 2026-2036
- Figure 133: Middle East and Africa Market Attractiveness Analysis by Fiber Furnish
- Figure 134: Middle East and Africa Market Value Share and BPS Analysis by End-Use Application, 2026 and 2036
- Figure 135: Middle East and Africa Market Y-o-Y Growth Comparison by End-Use Application, 2026-2036
- Figure 136: Middle East and Africa Market Attractiveness Analysis by End-Use Application
- Figure 137: Middle East and Africa Market Value Share and BPS Analysis by Sales Channel, 2026 and 2036
- Figure 138: Middle East and Africa Market Y-o-Y Growth Comparison by Sales Channel, 2026-2036
- Figure 139: Middle East and Africa Market Attractiveness Analysis by Sales Channel
- Figure 140: Global Market - Tier Structure Analysis
- Figure 141: Global Market - Company Share Analysis
Frequently Asked Questions
How big is the testliner market in 2026, and what is forecast for 2036?
Total testliner market size progressed from USD 42.6 billion in 2025 to an estimated USD 44.1 billion in 2026 and is slated to reach USD 62.2 billion by 2036.
What is the CAGR for the testliner market from 2026 to 2036?
Recycled testliner valuation grows at a 3.5% CAGR from 2026 through 2036, creating USD 18.1 billion in new containerboard market value.
Which liner grade segment leads the testliner market?
Uncoated Brown Testliner Grades 1 through 3 hold 57.8% of liner grade demand in 2026 because starch surface sizing delivers cost-effective burst and ring-crush strength for standard shipping boxes.
Which basis weight segment leads the testliner market?
115 gsm to 150 gsm Standard E-Commerce Weight represents 46.4% of the basis weight category in 2026 as fulfillment centers optimize box stacking strength against parcel weight tariffs.
Which country has a notable growth outlook during the assessment period?
Poland achieves the fastest national growth rate at a 4.2% CAGR through 2036 on the strength of Central Europe e-commerce fulfillment and high-speed wide-web recycled paper machines.
Who are the key players in the market?
Smurfit Westrock plc, International Paper Company, Mondi plc, DS Smith Plc, Packaging Corporation of America, Stora Enso Oyj, SAICA Group, Prinzhorn Holding GmbH, Nine Dragons Paper (Holdings) Limited, and Oji Holdings Corporation lead commercial supply.
Preview the report firsthand - request a free sample
Get SampleGet the brochure for pricing and purchase details.
Get PDF
