Reports

- Global Locations -

Headquarters

Future Market Insights, Inc.

Christiana Corporate, 200
Continental Drive, Suite 401,
Newark, Delaware - 19713,
United States

T: +1-845-579-5705

Americas

Future Market Insights, Inc.

616 Corporate Way, Suite 2-9018,
Valley Cottage, NY 10989, United States

T: +1-347-918-3531

MEA

Future Market Insights

1602-6 Jumeirah Bay X2 Tower, Plot No: JLT-PH2-X2A,
Jumeirah Lakes Towers, Dubai,
United Arab Emirates

Europe

Future Market Insights

3rd Floor, 207 Regent Street,
W1B 3HH London
United Kingdom

T: + 44 (0) 20 8123 9659
D: +44 (0) 20 3287 4268

Asia Pacific

Future Market Insights

IndiaLand Global Tech Park, Unit UG-1, Behind Grand HighStreet, Phase 1, Hinjawadi, MH, Pune – 411057, India

Corrugated Fanfold Market Outlook (2023 to 2033)

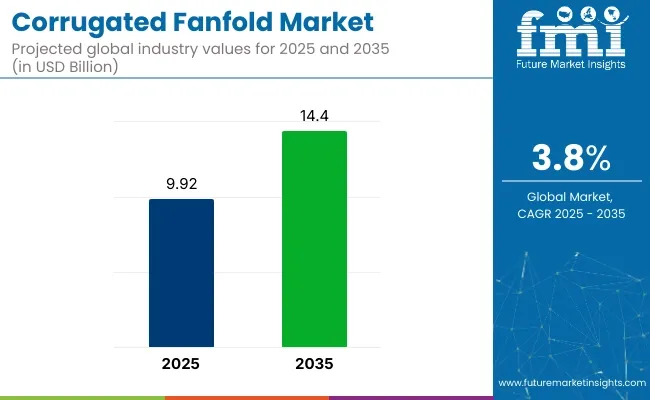
The global corrugated fanfold market size is expected to surge at a CAGR of 5.68% in the assessment period from 2023 to 2033. The market value is projected to increase from US$ 9,423.9 million in 2023 to US$ 16,370.5 million by 2033. It was valued at US$ 8,955.6 million at the end of 2022 and is anticipated to exhibit a y-o-y growth of 5.2% in 2023.

According to a recent forecast, sales are expected to increase from 2023 to 2033, presenting an appealing opportunity for incremental growth of US$ 7,414.89 million. Additionally, the projection suggests that the market will expand by 1.7 times its current value during the specified review period.

In recent years, there has been a growing emphasis on sustainability and environmental responsibility in packaging solutions. Corrugated fanfold is favored for its recyclability and biodegradability.

It is set to make it an attractive choice for companies looking to reduce their carbon footprint and meet eco-conscious consumer demands. As environmental concerns continue to gain momentum, demand for eco-friendly packaging materials such as corrugated fanfold is expected to surge.

The rapid expansion of e-commerce has had a significant impact on the packaging sector. With the rise of online shopping, businesses are seeking efficient, cost-effective, and adaptable packaging solutions that can safeguard products during transit.

Corrugated fanfold provides the versatility needed to protect a wide range of goods, from electronics to consumer goods. This is anticipated to position it as a top choice for e-commerce companies seeking reliable packaging options.

As markets become more competitive, companies are increasingly focusing on enhancing their brand identity through innovative packaging designs. The corrugated fanfold offers ample space for customization.

It allows businesses to create unique packaging that showcases their brand's personality and enhances the unboxing experience. This trend is anticipated to fuel demand for corrugated fanfold, especially among consumer-facing sectors.

The efficiency of supply chains is also crucial for businesses to stay competitive in a globalized marketplace. The corrugated fanfold's design facilitates easy handling, stacking, and storage.

It is projected to make it a practical choice for optimizing supply chain processes. Its ability to be used in automated packaging lines and its cost-effectiveness might contribute to its increasing adoption across sectors, further boosting its global demand.

Governments worldwide are implementing stricter regulations concerning packaging materials to ensure consumer safety and minimize environmental impact. Corrugated fanfold aligns with these evolving regulations.

It can help in meeting safety and quality standards. As businesses seek to comply with these requirements, corrugated fanfold demand as a trusted and compliant packaging solution is projected to rise.

Attributes Key Insights
Corrugated Fanfold Market Estimated Size (2023E) US$ 9,423.9 million
Projected Market Valuation (2033F) US$ 16,370.5 million
Value-based CAGR (2023 to 2033) 5.68%
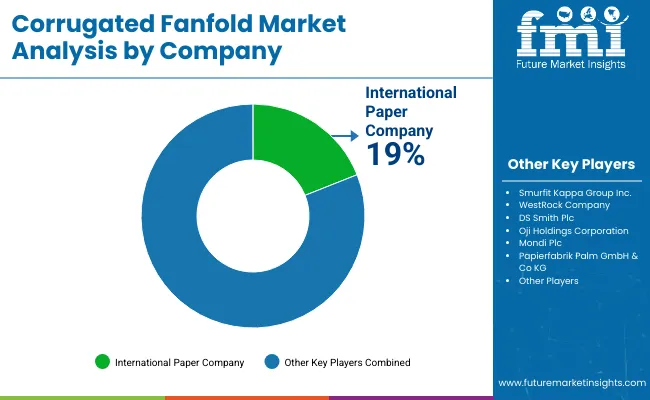
Collective Value Share: Top 5 Companies (2022A) 10 to 15%

Don't pay for what you don't need

Customize your report by selecting specific countries or regions and save 30%!

Historical Performance of the Corrugated Fanfold Market

The global corrugated fanfold market exhibited a CAGR of 3.46% during the historical period from 2018 to 2022. It expanded at a decent valuation of US$ 8,955.6 million in 2022 from US$ 7,816.4 million in 2018.

The global corrugated fanfold industry is experiencing robust growth, driven by increasing demand for efficient and sustainable packaging solutions. As consumers and businesses become more conscious of their ecological impact, there has been an increasing demand for eco-friendly packaging materials.

Corrugated fanfold's recyclability and biodegradability have made it an attractive choice for companies looking to align with environmentally friendly practices. This is projected to push its popularity upwards.

Rapid growth of e-commerce has also played a significant role in boosting the demand for corrugated fanfold. With the increasing prevalence of online shopping, businesses require efficient and adaptable packaging solutions to protect products during transit.

Corrugated fanfold's versatility and ability to safeguard a wide range of goods have made it a preferred option for e-commerce companies seeking reliable packaging materials. As online shopping continues to expand, so does the need for reliable and practical packaging solutions. It is likely to further drive the demand for corrugated fanfold.

Corrugated fanfold also offers ample space for branding and customization. As markets become more competitive, companies are increasingly focusing on enhancing their brand identity through innovative packaging designs.

Corrugated fanfold provides an ideal canvas for creative packaging solutions, allowing businesses to showcase their brand's personality. It might also help to create a memorable unboxing experience for customers. Growing emphasis on unique branding and customization might hence contribute to the rising corrugated fanfold sales.

Factors Expected to Propel Corrugated Fanfold Sales

  • Implementation of Smart Packaging to Influence Corrugated Fanfold Demand

Smart packaging represents a burgeoning trend driving continued corrugated fanfold market expansion. This upward trend is fueled by the seamless integration of smart technologies such as radio frequency identification tags, QR codes, and near-field communication tags.

Novel advances might provide stakeholders with valuable capabilities such as comprehensive product traceability, robust authenticity verification mechanisms, and engaging interactive consumer experiences. The inclusion of temperature indicators into corrugated packaging might provide peace of mind about the quality and safety of products. Hence, this type of packaging solution is set to be demanded by perishables and pharmaceuticals manufacturers.

  • Growth of E-commerce to Propel Demand for Efficient and Reliable Packaging Solutions

The rise of e-commerce has seen a surge in terms of online ordering and delivery. As a result, there is a growing need for packaging materials that can handle increased transportation volumes. Endless corrugated packaging offers a versatile and efficient solution to meet the packaging needs of various products in the e-commerce supply chain.

The growing popularity of home delivery services has increased the need for cardboard folding packaging. Such services require the product to be securely packaged to protect it from damage in transit. Corrugated cardboard is set to be the perfect solution for this purpose as its strength and durability can effectively protect the product from damage.

Ismail Sutaria
Ismail Sutaria

Principal Consultant

Talk to Analyst

Find your sweet spots for generating winning opportunities in this market.

Comparative View of Adjacent Corrugated Fanfold Market

Corrugated Fanfold Market:

Attributes Corrugated Fanfold Market
CAGR (2023 to 2033) 5.68%
Market Value (2023) US$ 9,423.9 million
Growth Factor Increasing awareness and concern about sustainability & safety is set to push the demand for reliable and sustainable packaging materials, including corrugated fanfold.
Key Trend Effective branding is crucial for corrugated fanfold packaging companies as it enables them to distinguish their products from those offered by their competitors.

Corrugated Box Market:

Attributes Corrugated Box Market
CAGR (2023 to 2033) 4.3%
Market Value (2023) US$ 140.4 billion
Growth Factor Demand for corrugated boxes is steadily increasing due to the growth of e-commerce and expansion of the retail sector.
Key Trend The emergence of digitization and the launch of graphic designs customized for each client might create new opportunities.

Corrugated Plastic Trays Market:

Attributes Corrugated Plastic Trays Market
CAGR (2023 to 2033) 5.1%
Market Value (2023) US$ 665.3 million
Growth Factor Growing demand for sustainable and reusable packaging solutions would help support the market.
Key Trend Rising demand for sustainable and reusable packaging solutions is likely to be a key trend.

Country-wise Insights

Countries Market Share (2033)
USA 12.0%
China 9.2%
India 8.4%
Japan 8.8%
ASEAN 7.1%
Canada 4.8%
South Korea 5.1%
Australia & New Zealand 4.9%

Increasing Demand for Paper in India to Propel Fanfold Packaging Sales

According to the India Brand Equity Foundation (IBEF), India is one of the emerging markets for corrugated fanfold due to the rapid industrialization in the country. The packaging sector in India uses paper as a leading source.

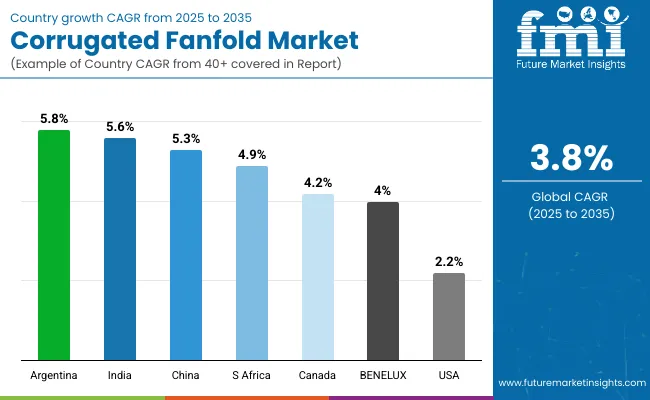
It is expected that demand for paper will rise continuously for ready-to-eat food and fast-moving consumer goods (FMCG) products. Growth in the paper packaging sector is projected to positively impact the Indian corrugated fanfold market by 2033. India is anticipated to generate 46.8% of market share in 2023, advancing at a 5.79% CAGR during the forecast years.

Growth of Online Shoppers in Germany to Push Demand for Fan Fold Boxes

As per the International Trade Administration, the market for e-commerce in Germany is blooming. Penetration of the internet and the rising number of e-commerce consumers are set to contribute to growth.

Total sales of e-commerce in the country were US$ 127.5 billion in 2021, which is around 24% growth, as compared to 2020. Number of online consumers in Europe is expected to increase to 68.4 million in 2025.

The rising penetration of e-commerce in Germany was 77% in 2021, which might directly increase the demand for corrugated fanfold in the review period. Germany is set to create an incremental opportunity worth US$ 106.73 million and expand at a CAGR of 2.83% through 2033.

Get the data you need at a Fraction of the cost

Personalize your report by choosing insights you need
and save 40%!

Category-wise Insights

C Flute to be Highly Popular among Fanfold Cardboard Sheets Manufacturers

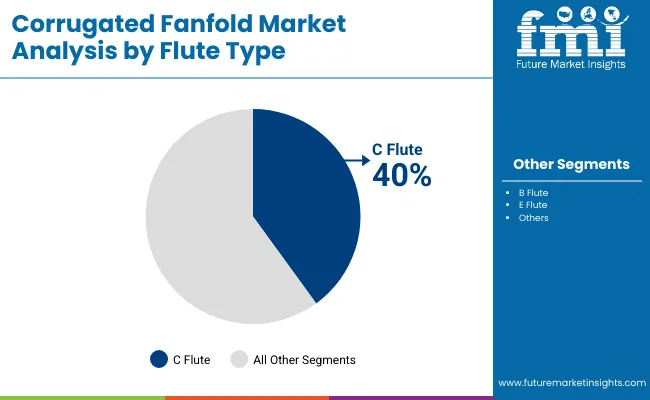
C flute has a good balance of strength and thickness for proper cushioning & product protection during transport and handling. It withstands moderate compression and impact, as well as ensures the integrity of packaged goods.

C-flute cardboard folding packaging also allows for easy customization and greater size flexibility. A continuous web of corrugated paperboard can be folded to form a stack of interconnected panels. It can then be unrolled and cut to the desired size and shape.

High adaptability might make it ideal for packaging products of various sizes. As a result, the C flute is the leading flute type segment. It is likely to generate a corrugated fanfold market share of more than 33.3% in 2023. It is expected to create an incremental opportunity worth US$ 839.31 million during the assessment period.

Corrugated Fanfold Bales to Witness High Demand from the Shipping Sector

Cardboard folding packaging can be easily customized to fit different product sizes and shapes. This versatility is very important in the shipping and logistics sector, where packages come in numerous different sizes.

The ability to cut and fold continuous sheets to the desired length & shape enables customized packaging solutions that optimize space utilization and protect goods during transit. Hence, the shipping & logistics segment is set to generate a market share of more than 24.7% in 2023. Furthermore, it is expected to rise with a CAGR of 2.85% over the review period.

Competitive Landscape

Exceptional customer service can be a differentiating factor in a competitive market. Corrugated fanfold manufacturers are focusing on building strong relationships with their customers. They are providing responsive support and actively seeking feedback to continually improve their products & and services.

Embracing digital technologies such as automation, data analytics, and AI-driven solutions can streamline operations and improve efficiency. Digital transformation would enable manufacturers to respond quickly to market changes, reduce errors, and improve production capabilities.

Forming alliances with suppliers, distributors, and other market stakeholders can offer manufacturers access to new sectors & resources. Collaborations can also enable them to expand their reach, gain valuable market insights, and access complementary technologies.

For instance,

  • In 2023, DS Smith plc invested US$ 71.1 million in its Viana, Portugal kraft paper mill. This included the installation of advanced paper-making machinery, reconstruction of the paper machine, and a significant reduction in CO2 emissions.
  • In January 2023, Mondi Plc announced that it had completed the acquisition of the Duino mill situated in Trieste (Italy) from the Burgo Group.
  • In December 2022, WestRock Company announced the complete acquisition of Grupo Gondi. This includes nine corrugated packaging plants, four paper mills, and six high graphic plants in Mexico. This strategic move strengthens WestRock's presence in the region and expands its sustainable packaging offerings.

Scope of the Report

Attribute Details
Estimated Market Size (2023) US$ 9,423.9 million
Projected Market Valuation (2033) US$ 16,370.5 million
Value-based CAGR (2023 to 2033) 5.68%
Historical Data 2018 to 2022
Forecast Period 2023 to 2033
Quantitative Units Value (US$ million) and volume (tons)
Segments Covered
  • Wall Type
  • Flute Type
  • Width
  • Printing Technology
  • End Use
  • Region
Key Countries Covered
  • North America
  • Latin America
  • East Asia
  • South Asia & Pacific
  • Western Europe
  • Eastern Europe
  • Central Asia
  • Russia & Belarus
  • Balkan Countries & Baltic Countries
  • Middle East & Africa
Key Companies Profiled
  • Smurfit Kappa Group
  • International Paper Company
  • WestRock Company
  • DS Smith plc
  • Oji Holdings Corp.
  • Mondi plc
  • Papierfabrik Palm GmbH & Co KG
  • Menasha Packaging Company, LLC
  • Rondo Ganahl AG
  • Ribble Packaging Ltd.
  • Come Sure Group (Holdings) Limited.
  • Nine Dragons Paper (Holdings) Limited

Corrugated Fanfold Market Outlook by Category

By Wall Type:

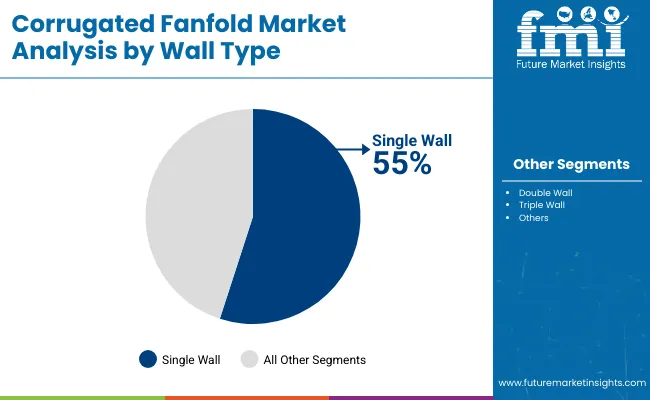
  • Single Wall
  • Double Wall
  • Triple Wall

By Flute Type:

  • B Flute
  • C Flute
  • E Flute
  • Others

By Width:

  • Below 500 mm
  • 501 to 1,000 mm
  • 1,001 to 1,500 mm
  • Above 1,500 mm

By Printing Technology:

  • Digital Printing
  • Flexographic Printing
  • Lithographic Printing

By End Use:

  • Shipping & Logistics
  • E-commerce
  • Electronics & Home Width Types
  • Pharmaceutical
  • Personal Care & Cosmetics
  • Furniture
  • Food & Beverage
  • Other Consumer Goods

By Region:

  • North America
  • Latin America
  • East Asia
  • South Asia & Pacific
  • Western Europe
  • Eastern Europe
  • Central Asia
  • Russia & Belarus
  • Balkan & Baltic Countries
  • Middle East & Africa

Frequently Asked Questions

What was the global corrugated fanfold market size reported for 2022?

In 2022, the global corrugated fanfold industry was valued at US$ 8,955.6 million.

What size is the global corrugated fanfold industry estimated to reach in 2023?

The global corrugated fanfold industry is anticipated to reach US$ 9,423.9 million in 2023.

What is the global corrugated fanfold industry valuation expected for 2033?

The global corrugated fanfold industry valuation is expected to reach US$ 16,370.5 million in 2033.

What value CAGR did global corrugated fanfold industry exhibit over the last 4 years?

The global corrugated fanfold industry exhibited a CAGR of 3.46% over the last 4 years.

What is the projected CAGR for global corrugated fanfold industry from 2023 to 2033?

The projected CAGR for the global corrugated fanfold industry from 2023 to 2033 is 5.68%.

Table of Content

1. Executive Summary

    1.1. Global Market Outlook

    1.2. Demand-side Trends

    1.3. Supply-side Trends

    1.4. Technology Roadmap Analysis

    1.5. Analysis and Recommendations

2. Market Overview

    2.1. Market Coverage / Taxonomy

    2.2. Market Definition / Scope / Limitations

3. Market Background

    3.1. Market Dynamics

        3.1.1. Drivers

        3.1.2. Restraints

        3.1.3. Opportunity

        3.1.4. Trends

    3.2. Impact on Target Market

        3.2.1. Demand in Optimistic Scenario

        3.2.2. Demand in Likely Scenario

        3.2.3. Demand in Conservative Scenario

    3.3. Macro Factors and Forecast Factors

    3.4. Value Chain Analysis

        3.4.1. Profit Margin Analysis

        3.4.2. Suppliers

        3.4.3. Manufacturers, Wholesalers and Distributors

        3.4.4. End User/ Customers

    3.5. Regional Parent Market Outlook

    3.6. Production and Consumption Statistics

    3.7. Global Average Pricing Analysis Benchmark

4. Global Market Analysis 2018 to 2022 and Forecast, 2023 to 2033

    4.1. Historical Market Size Value(US$ million) & Volume (tons) Analysis, 2018 to 2022

    4.2. Current and Future Market Size (US$ million) & Volume (tons) Projections, 2023 to 2033

        4.2.1. Y-o-Y Growth Trend Analysis

        4.2.2. Absolute $ Opportunity Analysis

5. Global Market Analysis 2018 to 2022 and Forecast 2023 to 2033, By Wall Type

    5.1. Introduction / Key Findings

    5.2. Historical Market Size Value(US$ million) & Volume (tons) Analysis By Wall Type, 2018 to 2022

    5.3. Current and Future Market Size (US$ million) & Volume (tons) Analysis and Forecast By Wall Type, 2023 to 2033

        5.3.1. Single Wall

        5.3.2. Double Wall

        5.3.3. Triple Wall

    5.4. Y-o-Y Growth Trend Analysis By Wall Type, 2018 to 2022

    5.5. Absolute $ Opportunity Analysis By Wall Type, 2023 to 2033

6. Global Market Analysis 2018 to 2022 and Forecast 2023 to 2033, By Flute Type

    6.1. Introduction / Key Findings

    6.2. Historical Market Size Value(US$ million) & Volume (tons) Analysis By Flute Type, 2018 to 2022

    6.3. Current and Future Market Size (US$ million) & Volume (tons) Analysis and Forecast By Flute Type, 2023 to 2033

        6.3.1. B Flute

        6.3.2. C Flute

        6.3.3. E Flute

        6.3.4. Others

    6.4. Y-o-Y Growth Trend Analysis By Flute Type, 2018 to 2022

    6.5. Absolute $ Opportunity Analysis By Flute Type, 2023 to 2033

7. Global Market Analysis 2018 to 2022 and Forecast 2023 to 2033, By Width

    7.1. Introduction / Key Findings

    7.2. Historical Market Size Value(US$ million) & Volume (tons) Analysis By Width, 2018 to 2022

    7.3. Current and Future Market Size (US$ million) & Volume (tons) Analysis and Forecast By Width, 2023 to 2033

        7.3.1. Below 500 mm

        7.3.2. 501 to 1,000 mm

        7.3.3. 1,001 to 1,500 mm

        7.3.4. Above 1,500 mm

    7.4. Y-o-Y Growth Trend Analysis By Width, 2018 to 2022

    7.5. Absolute $ Opportunity Analysis By Width, 2023 to 2033

8. Global Market Analysis 2018 to 2022 and Forecast 2023 to 2033, By Printing Technology

    8.1. Introduction / Key Findings

    8.2. Historical Market Size Value(US$ million) & Volume (tons) Analysis By Printing Technology, 2018 to 2022

    8.3. Current and Future Market Size (US$ million) & Volume (tons) Analysis and Forecast By Printing Technology, 2023 to 2033

        8.3.1. Digital Printing

        8.3.2. Flexographic Printing

        8.3.3. Lithographic Printing

    8.4. Y-o-Y Growth Trend Analysis By Printing Technology, 2018 to 2022

    8.5. Absolute $ Opportunity Analysis By Printing Technology, 2023 to 2033

9. Global Market Analysis 2018 to 2022 and Forecast 2023 to 2033, By End Use

    9.1. Introduction / Key Findings

    9.2. Historical Market Size Value(US$ million) & Volume (tons) Analysis By End Use, 2018 to 2022

    9.3. Current and Future Market Size (US$ million) & Volume (tons) Analysis and Forecast By End Use, 2023 to 2033

        9.3.1. Shipping & Logistics

        9.3.2. E-commerce

        9.3.3. Electronics & Home Width Types

        9.3.4. Pharmaceutical

        9.3.5. Personal Care & Cosmetics

        9.3.6. Furniture

        9.3.7. Food & Beverage

        9.3.8. Other Consumer Goods

    9.4. Y-o-Y Growth Trend Analysis By End Use, 2018 to 2022

    9.5. Absolute $ Opportunity Analysis By End Use, 2023 to 2033

10. Global Market Analysis 2018 to 2022 and Forecast 2023 to 2033, by Region

    10.1. Introduction / Key Findings

    10.2. Historical Market Size Value(US$ million) & Volume (tons) Analysis By Region, 2018 to 2022

    10.3. Current and Future Market Size (US$ million) & Volume (tons) Analysis and Forecast By Region, 2023 to 2033

        10.3.1. North America

        10.3.2. Latin America

        10.3.3. East Asia

        10.3.4. South Asia & Pacific

        10.3.5. Western Europe

        10.3.6. Eastern Europe

        10.3.7. Central Asia

        10.3.8. Russia & Belarus

        10.3.9. Balkan & Baltic Countries

        10.3.10. Middle East & Africa

    10.4. Market Attractiveness Analysis, by Region

11. North America Market Analysis 2018 to 2022 and Forecast 2023 to 2033

    11.1. Introduction / Key Findings

    11.2. Historical Market Size Value(US$ million) and Volume (tons) Analysis, by Market Taxonomy, 2018 to 2022

    11.3. Current Market Size Value (US$ million) and Volume (tons) Analysis and Forecast, by Market Taxonomy, 2023 to 2033

        11.3.1. By Country

            11.3.1.1. United States

            11.3.1.2. Canada

        11.3.2. By Wall Type

        11.3.3. By Flute Type

        11.3.4. By Width

        11.3.5. By Printing Technology

        11.3.6. By End Use

    11.4. Market Attractiveness Analysis

        11.4.1. By Country

        11.4.2. By Wall Type

        11.4.3. By Flute Type

        11.4.4. By Width

        11.4.5. By Printing Technology

        11.4.6. By End Use

12. Latin America Market Analysis 2018 to 2022 and Forecast 2023 to 2033

    12.1. Introduction / Key Findings

    12.2. Historical Market Size Value(US$ million) and Volume (tons) Analysis, by Market Taxonomy, 2018 to 2022

    12.3. Current Market Size Value (US$ million) and Volume (tons) Analysis and Forecast, by Market Taxonomy, 2023 to 2033

        12.3.1. By Country

            12.3.1.1. Brazil

            12.3.1.2. Mexico

            12.3.1.3. Argentina

        12.3.2. By Wall Type

        12.3.3. By Flute Type

        12.3.4. By Width

        12.3.5. By Printing Technology

        12.3.6. By End Use

    12.4. Market Attractiveness Analysis

        12.4.1. By Country

        12.4.2. By Wall Type

        12.4.3. By Flute Type

        12.4.4. By Width

        12.4.5. By Printing Technology

        12.4.6. By End Use

13. East Asia Market Analysis 2018 to 2022 and Forecast 2023 to 2033

    13.1. Introduction / Key Findings

    13.2. Historical Market Size Value (US$ million) and Volume (tons) Analysis, by Market Taxonomy, 2018 to 2022

    13.3. Current Market Size Value (US$ million) and Volume (tons) Analysis and Forecast, by Market Taxonomy, 2023 to 2033

        13.3.1. By Country

            13.3.1.1. South Korea

            13.3.1.2. China

            13.3.1.3. Japan

        13.3.2. By Wall Type

        13.3.3. By Flute Type

        13.3.4. By Width

        13.3.5. By Printing Technology

        13.3.6. By End Use

    13.4. Market Attractiveness Analysis

        13.4.1. By Country

        13.4.2. By Wall Type

        13.4.3. By Flute Type

        13.4.4. By Width

        13.4.5. By Printing Technology

        13.4.6. By End Use

14. South Asia & Pacific Market Analysis 2018 to 2022 and Forecast 2023 to 2033

    14.1. Introduction / Key Findings

    14.2. Historical Market Size Value(US$ million) and Volume (tons) Analysis, by Market Taxonomy, 2018 to 2022

    14.3. Current Market Size Value (US$ million) and Volume (tons) Analysis and Forecast, by Market Taxonomy, 2023 to 2033

        14.3.1. By Country

            14.3.1.1. India

            14.3.1.2. Association of Southeast Asian Nations

            14.3.1.3. Australia & New Zealand

        14.3.2. By Wall Type

        14.3.3. By Flute Type

        14.3.4. By Width

        14.3.5. By Printing Technology

        14.3.6. By End Use

    14.4. Market Attractiveness Analysis

        14.4.1. By Country

        14.4.2. By Wall Type

        14.4.3. By Flute Type

        14.4.4. By Width

        14.4.5. By Printing Technology

        14.4.6. By End Use

15. Western Europe Market Analysis 2018 to 2022 and Forecast 2023 to 2033

    15.1. Introduction / Key Findings

    15.2. Historical Market Size Value(US$ million) and Volume (tons) Analysis, by Market Taxonomy, 2018 to 2022

    15.3. Current Market Size Value (US$ million) and Volume (tons) Analysis and Forecast, by Market Taxonomy, 2023 to 2033

        15.3.1. By Country

            15.3.1.1. Germany

            15.3.1.2. France

            15.3.1.3. Spain

            15.3.1.4. Italy

            15.3.1.5. BENELUX

            15.3.1.6. Nordics

            15.3.1.7. United Kingdom

        15.3.2. By Wall Type

        15.3.3. By Flute Type

        15.3.4. By Width

        15.3.5. By Printing Technology

        15.3.6. By End Use

    15.4. Market Attractiveness Analysis

        15.4.1. By Country

        15.4.2. By Wall Type

        15.4.3. By Flute Type

        15.4.4. By Width

        15.4.5. By Printing Technology

        15.4.6. By End Use

16. Eastern Europe Market Analysis 2018 to 2022 and Forecast 2023 to 2033

    16.1. Introduction / Key Findings

    16.2. Historical Market Size Value (US$ million) and Volume (tons) Analysis, by Market Taxonomy, 2018 to 2022

    16.3. Current Market Size Value (US$ million) and Volume (tons) Analysis and Forecast, by Market Taxonomy, 2023 to 2033

        16.3.1. By Country

            16.3.1.1. Poland

            16.3.1.2. Hungary

            16.3.1.3. Austria

            16.3.1.4. Czech Republic

            16.3.1.5. Rest of Eastern Europe

        16.3.2. By Wall Type

        16.3.3. By Flute Type

        16.3.4. By Width

        16.3.5. By Printing Technology

        16.3.6. By End Use

    16.4. Market Attractiveness Analysis

        16.4.1. By Country

        16.4.2. By Wall Type

        16.4.3. By Flute Type

        16.4.4. By Width

        16.4.5. By Printing Technology

        16.4.6. By End Use

17. Central Asia Market Analysis 2018 to 2022 and Forecast 2023 to 2033

    17.1. Introduction / Key Findings

    17.2. Historical Market Size Value (US$ million) and Volume (tons) Analysis, by Market Taxonomy, 2018 to 2022

    17.3. Current Market Size Value (US$ million) and Volume (tons) Analysis and Forecast, by Market Taxonomy, 2023 to 2033

        17.3.1. By Country

            17.3.1.1. Kazakhstan

            17.3.1.2. Kyrgyzstan

            17.3.1.3. Tajikistan

            17.3.1.4. Turkmenistan

            17.3.1.5. Uzbekistan

        17.3.2. By Wall Type

        17.3.3. By Flute Type

        17.3.4. By Width

        17.3.5. By Printing Technology

        17.3.6. By End Use

    17.4. Market Attractiveness Analysis

        17.4.1. By Country

        17.4.2. By Wall Type

        17.4.3. By Flute Type

        17.4.4. By Width

        17.4.5. By Printing Technology

        17.4.6. By End Use

18. Russia & Belarus Market Analysis 2018 to 2022 and Forecast 2023 to 2033

    18.1. Introduction / Key Findings

    18.2. Historical Market Size Value(US$ million) and Volume (tons) Analysis, by Market Taxonomy, 2018 to 2022

    18.3. Current Market Size Value (US$ million) and Volume (tons) Analysis and Forecast, by Market Taxonomy, 2023 to 2033

        18.3.1. By Country

            18.3.1.1. Russia

            18.3.1.2. Belarus

        18.3.2. By Wall Type

        18.3.3. By Flute Type

        18.3.4. By Width

        18.3.5. By Printing Technology

        18.3.6. By End Use

    18.4. Market Attractiveness Analysis

        18.4.1. By Country

        18.4.2. By Wall Type

        18.4.3. By Flute Type

        18.4.4. By Width

        18.4.5. By Printing Technology

        18.4.6. By End Use

19. Baltic & Baltic Countries Market Analysis 2018 to 2022 and Forecast 2023 to 2033

    19.1. Introduction / Key Findings

    19.2. Historical Market Size Value(US$ million) and Volume (tons) Analysis, by Market Taxonomy, 2018 to 2022

    19.3. Current Market Size Value (US$ million) and Volume (tons) Analysis and Forecast, by Market Taxonomy, 2023 to 2033

        19.3.1. By Country

            19.3.1.1. Romania

            19.3.1.2. Greece

            19.3.1.3. Bulgaria

            19.3.1.4. Lithuania

            19.3.1.5. Estonia

            19.3.1.6. Latvia

        19.3.2. By Wall Type

        19.3.3. By Flute Type

        19.3.4. By Width

        19.3.5. By Printing Technology

        19.3.6. By End Use

    19.4. Market Attractiveness Analysis

        19.4.1. By Country

        19.4.2. By Wall Type

        19.4.3. By Flute Type

        19.4.4. By Width

        19.4.5. By Printing Technology

        19.4.6. By End Use

20. Middle East & Africa Market Analysis 2018 to 2022 and Forecast 2023 to 2033

    20.1. Introduction / Key Findings

    20.2. Historical Market Size Value(US$ million) and Volume (tons) Analysis, by Market Taxonomy, 2018 to 2022

    20.3. Current Market Size Value (US$ million) and Volume (tons) Analysis and Forecast, by Market Taxonomy, 2023 to 2033

        20.3.1. By Country

            20.3.1.1. GCC Countries

            20.3.1.2. Türkiye

            20.3.1.3. Northern Africa

            20.3.1.4. South Africa

            20.3.1.5. Israel

        20.3.2. By Wall Type

        20.3.3. By Flute Type

        20.3.4. By Width

        20.3.5. By Printing Technology

        20.3.6. By End Use

    20.4. Market Attractiveness Analysis

        20.4.1. By Country

        20.4.2. By Wall Type

        20.4.3. By Flute Type

        20.4.4. By Width

        20.4.5. By Printing Technology

        20.4.6. By End Use

21. Country wise Market Analysis

    21.1. United States Market Share Analysis, 2023

        21.1.1. By Wall Type

        21.1.2. By Flute Type

        21.1.3. By Width

        21.1.4. By Printing Technology

        21.1.5. By End Use

    21.2. Canada Market Share Analysis, 2023

        21.2.1. By Wall Type

        21.2.2. By Flute Type

        21.2.3. By Width

        21.2.4. By Printing Technology

        21.2.5. By End Use

    21.3. Brazil Market Share Analysis, 2023

        21.3.1. By Wall Type

        21.3.2. By Flute Type

        21.3.3. By Width

        21.3.4. By Printing Technology

        21.3.5. By End Use

    21.4. Mexico Market Share Analysis, 2023

        21.4.1. By Wall Type

        21.4.2. By Flute Type

        21.4.3. By Width

        21.4.4. By Printing Technology

        21.4.5. By End Use

    21.5. Germany Market Share Analysis, 2023

        21.5.1. By Wall Type

        21.5.2. By Flute Type

        21.5.3. By Width

        21.5.4. By Printing Technology

        21.5.5. By End Use

    21.6. Italy Market Share Analysis, 2023

        21.6.1. By Wall Type

        21.6.2. By Flute Type

        21.6.3. By Width

        21.6.4. By Printing Technology

        21.6.5. By End Use

    21.7. France Market Share Analysis, 2023

        21.7.1. By Wall Type

        21.7.2. By Flute Type

        21.7.3. By Width

        21.7.4. By Printing Technology

        21.7.5. By End Use

    21.8. Spain Market Share Analysis, 2023

        21.8.1. By Wall Type

        21.8.2. By Flute Type

        21.8.3. By Width

        21.8.4. By Printing Technology

        21.8.5. By End Use

    21.9. United Kingdom Market Share Analysis, 2023

        21.9.1. By Wall Type

        21.9.2. By Flute Type

        21.9.3. By Width

        21.9.4. By Printing Technology

        21.9.5. By End Use

    21.10. South Africa Market Share Analysis, 2023

        21.10.1. By Wall Type

        21.10.2. By Flute Type

        21.10.3. By Width

        21.10.4. By End Use

    21.11. China Market Share Analysis, 2023

        21.11.1. By Wall Type

        21.11.2. By Flute Type

        21.11.3. By Width

        21.11.4. By Printing Technology

        21.11.5. By End Use

    21.12. Japan Market Share Analysis, 2023

        21.12.1. By Wall Type

        21.12.2. By Flute Type

        21.12.3. By Width

        21.12.4. By Printing Technology

        21.12.5. By End Use

    21.13. India Market Share Analysis, 2023

        21.13.1. By Wall Type

        21.13.2. By Flute Type

        21.13.3. By Width

        21.13.4. By Printing Technology

        21.13.5. By End Use

    21.14. GCC Countries Market Share Analysis, 2023

        21.14.1. By Wall Type

        21.14.2. By Flute Type

        21.14.3. By Width

        21.14.4. By Printing Technology

        21.14.5. By End Use

    21.15. Australia & New Zealand Market Share Analysis, 2023

        21.15.1. By Wall Type

        21.15.2. By Flute Type

        21.15.3. By Width

        21.15.4. By Printing Technology

        21.15.5. By End Use

22. Market Structure Analysis

    22.1. Competition Dashboard

    22.2. Competition Benchmarking

    22.3. Market Share Analysis of Top Players

        22.3.1. By Region

        22.3.2. By Product Portfolio

23. Competition Analysis

    23.1. Competition Deep Dive

        23.1.1. Smurfit Kappa Group

            23.1.1.1. Overview

            23.1.1.2. Material Portfolio

            23.1.1.3. Profitability by Market Segments (Material/End Use/Region)

            23.1.1.4. Sales Footprint

            23.1.1.5. Strategy Overview

                23.1.1.5.1. Marketing Strategy

                23.1.1.5.2. Material Strategy

                23.1.1.5.3. End Use Strategy

        23.1.2. International Paper Company

            23.1.2.1. Overview

            23.1.2.2. Material Portfolio

            23.1.2.3. Profitability by Market Segments (Material/End Use/Region)

            23.1.2.4. Sales Footprint

            23.1.2.5. Strategy Overview

                23.1.2.5.1. Marketing Strategy

                23.1.2.5.2. Material Strategy

                23.1.2.5.3. End Use Strategy

        23.1.3. WestRock Company

            23.1.3.1. Overview

            23.1.3.2. Material Portfolio

            23.1.3.3. Profitability by Market Segments (Material/End Use/Region)

            23.1.3.4. Sales Footprint

            23.1.3.5. Strategy Overview

                23.1.3.5.1. Marketing Strategy

                23.1.3.5.2. Material Strategy

                23.1.3.5.3. End Use Strategy

        23.1.4. DS Smith plc

            23.1.4.1. Overview

            23.1.4.2. Material Portfolio

            23.1.4.3. Profitability by Market Segments (Material/End Use/Region)

            23.1.4.4. Sales Footprint

            23.1.4.5. Strategy Overview

                23.1.4.5.1. Marketing Strategy

                23.1.4.5.2. Material Strategy

                23.1.4.5.3. End Use Strategy

        23.1.5. Oji Holdings Corp.

            23.1.5.1. Overview

            23.1.5.2. Material Portfolio

            23.1.5.3. Profitability by Market Segments (Material/End Use/Region)

            23.1.5.4. Sales Footprint

            23.1.5.5. Strategy Overview

                23.1.5.5.1. Marketing Strategy

                23.1.5.5.2. Material Strategy

                23.1.5.5.3. End Use Strategy

        23.1.6. Mondi plc

            23.1.6.1. Overview

            23.1.6.2. Material Portfolio

            23.1.6.3. Profitability by Market Segments (Material/End Use/Region)

            23.1.6.4. Sales Footprint

            23.1.6.5. Strategy Overview

                23.1.6.5.1. Marketing Strategy

                23.1.6.5.2. Material Strategy

                23.1.6.5.3. End Use Strategy

        23.1.7. Papierfabrik Palm GmbH & Co KG

            23.1.7.1. Overview

            23.1.7.2. Material Portfolio

            23.1.7.3. Profitability by Market Segments (Material/End Use/Region)

            23.1.7.4. Sales Footprint

            23.1.7.5. Strategy Overview

                23.1.7.5.1. Marketing Strategy

                23.1.7.5.2. Material Strategy

                23.1.7.5.3. End Use Strategy

        23.1.8. Menasha Packaging Company, LLC

            23.1.8.1. Overview

            23.1.8.2. Material Portfolio

            23.1.8.3. Profitability by Market Segments (Material/End Use/Region)

            23.1.8.4. Sales Footprint

            23.1.8.5. Strategy Overview

                23.1.8.5.1. Marketing Strategy

                23.1.8.5.2. Material Strategy

                23.1.8.5.3. End Use Strategy

        23.1.9. Rondo Ganahl AG

            23.1.9.1. Overview

            23.1.9.2. Material Portfolio

            23.1.9.3. Profitability by Market Segments (Material/End Use/Region)

            23.1.9.4. Sales Footprint

            23.1.9.5. Strategy Overview

                23.1.9.5.1. Marketing Strategy

                23.1.9.5.2. Material Strategy

                23.1.9.5.3. End Use Strategy

        23.1.10. Ribble Packaging Ltd.

            23.1.10.1. Overview

            23.1.10.2. Material Portfolio

            23.1.10.3. Profitability by Market Segments (Material/End Use/Region)

            23.1.10.4. Sales Footprint

            23.1.10.5. Strategy Overview

                23.1.10.5.1. Marketing Strategy

                23.1.10.5.2. Material Strategy

                23.1.10.5.3. End Use Strategy

        23.1.11. Come Sure Group (Holdings) Limited.

            23.1.11.1. Overview

            23.1.11.2. Material Portfolio

            23.1.11.3. Profitability by Market Segments (Material/End Use/Region)

            23.1.11.4. Sales Footprint

            23.1.11.5. Strategy Overview

                23.1.11.5.1. Marketing Strategy

                23.1.11.5.2. Material Strategy

                23.1.11.5.3. End Use Strategy

        23.1.12. Nine Dragons Paper (Holdings) Limited

            23.1.12.1. Overview

            23.1.12.2. Material Portfolio

            23.1.12.3. Profitability by Market Segments (Material/End Use/Region)

            23.1.12.4. Sales Footprint

            23.1.12.5. Strategy Overview

                23.1.12.5.1. Marketing Strategy

                23.1.12.5.2. Material Strategy

                23.1.12.5.3. End Use Strategy

*The above list is indicative in nature and is subject to change during the course of research

24. Assumptions and Acronyms Used

25. Research Methodology

Don't pay for what you don't need

Customize your report by selecting specific countries or regions and save 30%!

List of Tables

Table 01: Global Market Value (US$ million) By Wall Type, 2018H to 2033F

Table 02: Global Market Volume (tons) By Wall Type, 2018H to 2033F

Table 03: Global Market Value (US$ million) by Flute Type, 2018H to 2033F

Table 04: Global Market Volume (tons) by Flute Type, 2018H to 2033F

Table 05: Global Market Value (US$ million) by Width, 2018H to 2033F

Table 06: Global Market Volume (tons) by Width, 2018H to 2033F

Table 07: Global Market Value (US$ million) by Printing Technology, 2018H to 2033F

Table 08: Global Market Volume (US$ million) by Printing Technology, 2018H to 2033F

Table 09: Global Market Value (US$ million) by End Use, 2018H to 2033F

Table 10: Global Market Value (US$ million) by End Use, 2018H to 2033F

Table 11: Global Market Volume (tons) by End Use, 2018H to 2033F

Table 12: Global Market Volume (tons) by End Use, 2018H to 2033F

Table 13: Global Market Value (US$ million) by Region, 2018H to 2033F

Table 14: Global Market Volume (tons) by Region, 2018H to 2033F

Table 15: North America Market Value (US$ million) By Wall Type, 2018H to 2033F

Table 16: North America Market Volume (tons) By Wall Type, 2018H to 2033F

Table 17: North America Market Value (US$ million) by Flute Type, 2018H to 2033F

Table 18: North America Market Volume (tons) by Flute Type, 2018H to 2033F

Table 19: North America Market Value (US$ million) by Width, 2018H to 2033F

Table 20: North America Market Volume (tons) by Width, 2018H to 2033F

Table 21: North America Market Value (US$ million) by Printing Technology, 2018H to 2033F

Table 22: North America Market Volume (tons) by Printing Technology, 2018H to 2033F

Table 23: North America Market Value (US$ million) by End Use, 2018H to 2033F

Table 24: North America Market Value (US$ million) by End Use, 2018H to 2033F

Table 25: North America Market Volume (tons) by End Use, 2018H to 2033F

Table 26: North America Market Volume (tons) by End Use, 2018H to 2033F

Table 27: North America Market Value (US$ million) by Country, 2018H to 2033F

Table 28: North America Market Volume (tons) by Country, 2018H to 2033F

Table 29: Latin America Market Value (US$ million) By Wall Type, 2018H to 2033F

Table 30: Latin America Market Volume (tons) By Wall Type, 2018H to 2033F

Table 31: Latin America Market Value (US$ million) by Flute Type, 2018H to 2033F

Table 32: Latin America Market Volume (tons) by Flute Type, 2018H to 2033F

Table 33: Latin America Market Value (US$ million) by Width, 2018H to 2033F

Table 34: Latin America Market Volume (tons) by Width, 2018H to 2033F

Table 35: Latin America Market Value (US$ million) by Printing Technology, 2018H to 2033F

Table 36: Latin America Market Volume (tons) by Printing Technology, 2018H to 2033F

Table 37: Latin America Market Value (US$ million) by End Use, 2018H to 2033F

Table 38: Latin America Market Value (US$ million) by End Use, 2018H to 2033F

Table 39: Latin America Market Volume (tons) by End Use, 2018H to 2033F

Table 40: Latin America Market Volume (tons) by End Use, 2018H to 2033F

Table 41: Latin America Market Value (US$ million) by Country, 2018H to 2033F

Table 42: Latin America Market Volume (tons) by Country, 2018H to 2033F

Table 43: East Asia Market Value (US$ million) By Wall Type, 2018H to 2033F

Table 44: East Asia Market Volume (tons) By Wall Type, 2018H to 2033F

Table 45: East Asia Market Value (US$ million) by Flute Type, 2018H to 2033F

Table 46: East Asia Market Volume (tons) by Flute Type, 2018H to 2033F

Table 47: East Asia Market Value (US$ million) by Width, 2018H to 2033F

Table 48: East Asia Market Volume (tons) by Width, 2018H to 2033F

Table 49: East Asia Market Value (US$ million) by Printing Technology, 2018H to 2033F

Table 50: East Asia Market Volume (tons) by Printing Technology, 2018H to 2033F

Table 51: East Asia Market Value (US$ million) by End Use, 2018H to 2033F

Table 52: East Asia Market Value (US$ million) by End Use, 2018H to 2033F

Table 53: East Asia Market Volume (tons) by End Use, 2018H to 2033F

Table 54: East Asia Market Volume (tons) by End Use, 2018H to 2033F

Table 55: East Asia Market Value (US$ million) by Country, 2018H to 2033F

Table 56: East Asia Market Volume (tons) by Country, 2018H to 2033F

Table 57: South Asia & Pacific Market Value (US$ million) By Wall Type, 2018H-2033

Table 58: South Asia & Pacific Market Volume (tons) By Wall Type, 2018H to 2033F

Table 59: South Asia & Pacific Market Value (US$ million) by Flute Type, 2018H to 2033F

Table 60: South Asia & Pacific Market Volume (tons) by Flute Type, 2018H to 2033F

Table 61: South Asia & Pacific Market Value (US$ million) by Width, 2018H to 2033F

Table 62: South Asia & Pacific Market Volume (tons) by Width, 2018H to 2033F

Table 63: South Asia & Pacific Market Value (US$ million) by Printing Technology, 2018H to 2033F

Table 64: South Asia & Pacific Market Volume (tons) by Printing Technology, 2018H to 2033F

Table 65: South Asia & Pacific Market Value (US$ million) by End Use, 2018H to 2033F

Table 66: South Asia & Pacific Market Volume (tons) by End Use, 2018H to 2033F

Table 67: South Asia & Pacific Market Value (US$ million) by Country, 2018H to 2033F

Table 68: South Asia & Pacific Market Volume (tons) by Country, 2018H to 2033F

Table 69: Western Europe Market Value (US$ million) By Wall Type, 2018H to 2033F

Table 70: Western Europe Market Volume (tons) By Wall Type, 2018H to 2033F

Table 71: Western Europe Market Value (US$ million) by Flute Type, 2018H to 2033F

Table 72: Western Europe Market Volume (tons) by Flute Type, 2018H to 2033F

Table 73: Western Europe Market Value (US$ million) by Width, 2018H to 2033F

Table 74: Western Europe Market Volume (tons) by Width, 2018H to 2033F

Table 75: Western Europe Market Value (US$ million) by Printing Technology, 2018H to 2033F

Table 76: Western Europe Market Volume (tons) by Printing Technology, 2018H to 2033F

Table 77: Western Europe Market Value (US$ million) by End Use, 2018H to 2033F

Table 78: Western Europe Market Volume (tons) by End Use, 2018H to 2033F

Table 79: Western Europe Market Value (US$ million) by Country, 2018H to 2033F

Table 80: Western Europe Market Volume (tons) by Country, 2018H to 2033F

Table 81: Eastern Europe Market Value (US$ million) By Wall Type, 2018H to 2033F

Table 82: Eastern Europe Market Volume (tons) By Wall Type, 2018H to 2033F

Table 83: Eastern Europe Market Value (US$ million) by Flute Type, 2018H to 2033F

Table 84: Eastern Europe Market Volume (tons) by Flute Type, 2018H to 2033F

Table 85: Eastern Europe Market Value (US$ million) by Width, 2018H to 2033F

Table 86: Eastern Europe Market Volume (tons) by Width, 2018H to 2033F

Table 87: Eastern Europe Market Value (US$ million) by Printing Technology, 2018H to 2033F

Table 88: Eastern Europe Market Volume (tons) by Printing Technology, 2018H to 2033F

Table 89: Eastern Europe Market Value (US$ million) by End Use, 2018H to 2033F

Table 90: Eastern Europe Market Volume (tons) by End Use, 2018H to 2033F

Table 91: Eastern Europe Market Value (US$ million) by Country, 2018H to 2033F

Table 91: Eastern Europe Market Volume (tons) by Country, 2018H to 2033F

Table 92: Central Asia Market Value (US$ million) By Wall Type, 2018H to 2033F

Table 93: Central Asia Market Volume (tons) By Wall Type, 2018H to 2033F

Table 93: Central Asia Market Value (US$ million) by Flute Type, 2018H to 2033F

Table 94: Central Asia Market Volume (tons) by Flute Type, 2018H to 2033F

Table 95: Central Asia Market Value (US$ million) by Width, 2018H to 2033F

Table 96: Central Asia Market Volume (tons) by Width, 2018H to 2033F

Table 97: Central Asia Market Value (US$ million) by Printing Technology, 2018H to 2033F

Table 98: Central Asia Market Volume (tons) by Printing Technology, 2018H to 2033F

Table 99: Central Asia Market Value (US$ million) by End Use, 2018H to 2033F

Table 100: Central Asia Market Volume (tons) by End Use, 2018H to 2033F

Table 111: Central Asia Market Value (US$ million) by Country, 2018H to 2033F

Table 112: Central Asia Market Volume (tons) by Country, 2018H to 2033F

Table 113: Russia & Belarus Market Value (US$ million) By Wall Type, 2018H to 2033F

Table 114: Russia & Belarus Market Volume (tons) By Wall Type, 2018H to 2033F

Table 115: Russia & Belarus Market Value (US$ million) by Flute Type, 2018H to 2033F

Table 116: Russia & Belarus Market Volume (tons) by Flute Type, 2018H to 2033F

Table 117: Russia & Belarus Market Value (US$ million) by Width, 2018H to 2033F

Table 118: Russia & Belarus Market Volume (tons) by Width, 2018H to 2033F

Table 119: Russia & Belarus Market Value (US$ million) by Printing Technology, 2018H to 2033F

Table 120: Russia & Belarus Market Volume (tons) by Printing Technology, 2018H to 2033F

Table 121: Russia & Belarus Market Value (US$ million) by End Use, 2018H to 2033F

Table 122: Russia & Belarus Market Volume (tons) by End Use, 2018H to 2033F

Table 123: Russia & Belarus Market Value (US$ million) by Country, 2018H to 2033F

Table 124: Russia & Belarus Market Volume (tons) by Country, 2018H to 2033F

Table 125: Balkan & Baltic Countries Market Value (US$ million) By Wall Type, 2018H to 2033F

Table 126: Balkan & Baltic Countries Market Volume (tons) By Wall Type, 2018H to 2033F

Table 127: Balkan & Baltic Countries Market Value (US$ million) by Flute Type, 2018H to 2033F

Table 128: Balkan & Baltic Countries Market Volume (tons) by Flute Type, 2018H to 2033F

Table 129: Balkan & Baltic Countries Market Value (US$ million) by Width, 2018H to 2033F

Table 130: Balkan & Baltic Countries Market Volume (tons) by Width, 2018H to 2033F

Table 131: Balkan & Baltic Countries Market Value (US$ million) by Printing Technology, 2018H to 2033F

Table 132: Balkan & Baltic Countries Market Volume (tons) by Printing Technology, 2018H to 2033F

Table 133: Balkan & Baltic Countries Market Value (US$ million) by End Use, 2018H to 2033F

Table 134: Balkan & Baltic Countries Market Volume (tons) by End Use, 2018H to 2033F

Table 135: Balkan & Baltic Countries Market Value (US$ million) by Country, 2018H to 2033F

Table 136: Balkan & Baltic Countries Market Volume (tons) by Country, 2018H to 2033F

Table 137: Middle East & Africa Market Value (US$ million) By Wall Type, 2018H to 2033F

Table 138: Middle East & Africa Market Volume (tons) By Wall Type, 2018H to 2033F Analysis, by Region, 2018H to 2033F

Table 139: Middle East & Africa Market Value (US$ million) by Flute Type, 2018H to 2033F

Table 140: Middle East & Africa Market Volume (tons) by Flute Type, 2018H to 2033F

Table 141: Middle East & Africa Market Value (US$ million) by Width, 2018H to 2033F

Table 142: Middle East & Africa Market Volume (tons) by Width, 2018H to 2033F

Table 143: Middle East & Africa Market Value (US$ million) by Printing Technology, 2018H to 2033F

Table 144: Middle East & Africa Market Volume (tons) by Printing Technology, 2018H to 2033F

Table 145: Middle East & Africa Market Value (US$ million) by End Use, 2018H to 2033F

Table 146: Middle East & Africa Market Volume (tons) by End Use, 2018H to 2033F

Table 147: Middle East & Africa Market Value (US$ million) by Country, 2018H to 2033F

Table 148: Middle East & Africa Market Volume (tons) by Country, 2018H to 2033F
Ismail Sutaria
Ismail Sutaria

Principal Consultant

Talk to Analyst

Find your sweet spots for generating winning opportunities in this market.

List of Charts

Figure 01: Global Market Share Analysis, by Wall Type, 2023E & 2033F

Figure 02: Global Market Y-o-Y Analysis, by Wall Type, 2018H to 2033F

Figure 03: Global Market Attractiveness Analysis, by Wall Type, 2023E to 2033F

Figure 04: Global Market Share Analysis, by Flute Type, 2023E & 2033F

Figure 05: Global Market Y-o-Y Analysis, by Flute Type, 2018H to 2033F

Figure 06: Global Market Attractiveness Analysis, by Flute Type, 2023E to 2033F

Figure 07: Global Market Share Analysis, by Width, 2023E & 2033F

Figure 08: Global Market Y-o-Y Analysis, by Width, 2018H to 2033F

Figure 09: Global Market Attractiveness Analysis, by Width, 2023E to 2033F

Figure 10: Global Market Share Analysis, by Printing Technology, 2023E & 2033F

Figure 11: Global Market Y-o-Y Analysis, by Printing Technology, 2018H to 2033F

Figure 12: Global Market Attractiveness Analysis, by Printing Technology, 2023E to 2033F

Figure 13: Global Market Share Analysis, by End Use, 2023E & 2033F

Figure 14: Global Market Y-o-Y Analysis, by End Use, 2018H to 2033F

Figure 15: Global Market Attractiveness Analysis, by End Use, 2023E to 2033F

Figure 16: Global Market Share Analysis, by Region, 2023E & 2033F

Figure 17: Global Market Y-o-Y Analysis, by Region, 2018H to 2033F

Figure 18: Global Market Attractiveness Analysis, by Region, 2023E to 2033F

Figure 19: North America Market Attractiveness Analysis, By Wall Type, 2023E to 2033F

Figure 20: North America Market Y-o-Y Analysis, by Flute Type, 2018H to 2033F

Figure 21: North America Market Value Share Analysis, by Width 2023(E)

Figure 22: North America Market Value Share Analysis, by Printing Technology 2023(E)

Figure 23: North America Market Value Share Analysis, by End Use 2023(E)

Figure 24: North America Market Share Analysis, by Country, 2023E & 2033F

Figure 25: Latin America Market Y-o-Y Analysis, By Wall Type, 2018H to 2033F

Figure 26: Latin America Market Y-o-Y Analysis, by Flute Type, 2018H to 2033F

Figure 27: Latin America Market Value Share Analysis, by Width 2023(E)

Figure 28: Latin America Market Value Share Analysis, by Printing Technology 2023(E)

Figure 29: Latin America Market Value Share Analysis, by End Use 2023(E)

Figure 30: Latin America Market Share Analysis, by Country, 2023E & 2033F

Figure 31: East Asia Market Y-o-Y Analysis, By Wall Type, 2018H to 2033F

Figure 32: East Asia Market Y-o-Y Analysis, by Flute Type, 2018H to 2033F

Figure 33: East Asia Market Value Share Analysis, by Width 2023(E)

Figure 34: East Asia Market Value Share Analysis, by Printing Technology 2023(E)

Figure 35: East Asia Market Value Share Analysis, by End Use 2023(E)

Figure 36: East Asia Market Share Analysis, by Country, 2023E & 2033F

Figure 37: South Asia & Pacific Market Y-o-Y Analysis, By Wall Type, 2018H to 2033F

Figure 38: South Asia & Pacific Market Y-o-Y Analysis, by Flute Type, 2018H to 2033F

Figure 39: South Asia & Pacific Market Value Share Analysis, by Width 2023(E)

Figure 40: South Asia & Pacific Market Value Share Analysis, by Printing Technology 2023(E)

Figure 41: South Asia & Pacific Market Value Share Analysis, by End Use 2023(E)

Figure 42: South Asia & Pacific Market Share Analysis, by Country, 2023E & 2033F

Figure 43: Western Europe Market Y-o-Y Analysis, By Wall Type, 2018H to 2033F

Figure 44: Western Europe Market Y-o-Y Analysis, by Flute Type, 2018H to 2033F

Figure 45: Western Europe Market Value Share Analysis, by Width 2023(E)

Figure 46: Western Europe Market Value Share Analysis, by Printing Technology 2023(E)

Figure 47: Western Europe Market Value Share Analysis, by End Use 2023(E)

Figure 48: Western Europe Market Share Analysis, by Country, 2023E & 2033F

Figure 49: Eastern Europe Market Y-o-Y Analysis, By Wall Type, 2018H to 2033F

Figure 50: Eastern Europe Market Y-o-Y Analysis, by Flute Type, 2018H to 2033F

Figure 51: Eastern Europe Market Value Share Analysis, by Width 2023(E)

Figure 52: Eastern Europe Market Value Share Analysis, by Printing Technology 2023(E)

Figure 53: Eastern Europe Market Value Share Analysis, by End Use 2023(E)

Figure 54: Eastern Europe Market Share Analysis, by Country, 2023E & 2033F

Figure 55: Central Asia Market Y-o-Y Analysis, By Wall Type, 2018H to 2033F

Figure 56: Central Asia Market Y-o-Y Analysis, by Flute Type, 2018H to 2033F

Figure 57: Central Asia Market Value Share Analysis, by Width 2023(E)

Figure 58: Central Asia Market Value Share Analysis, by Printing Technology 2023(E)

Figure 59: Central Asia Market Value Share Analysis, by End Use 2023(E)

Figure 60: Central Asia Market Share Analysis, by Country, 2023E & 2033F

Figure 61: Russia & Belarus Market Y-o-Y Analysis, By Wall Type, 2018H to 2033F

Figure 62: Russia & Belarus Market Y-o-Y Analysis, by Flute Type, 2018H to 2033F

Figure 63: Russia & Belarus Market Value Share Analysis, by Width 2023(E)

Figure 64: Russia & Belarus Market Value Share Analysis, by Printing Technology 2023(E)

Figure 65: Russia & Belarus Market Value Share Analysis, by End Use 2023(E)

Figure 66: Russia & Belarus Market Share Analysis, by Country, 2023E & 2033F

Figure 67: Balkan & Baltic Countries Market Y-o-Y Analysis, By Wall Type, 2018H to 2033

Figure 68: Balkan & Baltic Countries Market Y-o-Y Analysis, by Flute Type, 2018H to 2033F

Figure 69: Balkan & Baltic Countries Market Value Share Analysis, by Width 2023(E)

Figure 70: Balkan & Baltic Countries Market Value Share Analysis, by Printing Technology 2023(E)

Figure 71: Balkan & Baltic Countries Market Value Share Analysis, by End Use 2023(E)

Figure 72: Balkan & Baltic Countries Market Share Analysis, by Country, 2023E & 2033F

Figure 73: Middle East & Africa Market Y-o-Y Analysis, By Wall Type, 2018H to 2033F

Figure 74: Middle East & Africa Market Y-o-Y Analysis, by Flute Type, 2018H to 2033F

Figure 75: Middle East & Africa Market Value Share Analysis, by Printing Technology 2023(E)

Figure 76: Middle East & Africa Market Value Share Analysis, by End Use 2023(E)

Figure 77: Middle East & Africa Market Share Analysis, by Country, 2023E & 2033F

Recommendations

Packaging

Corrugated Bin Boxes Market

Published : August 2023

Packaging

Corrugated Wraps Market

Published : August 2023

Packaging

Corrugated Box Market

Published : March 2023

Packaging

Corrugated Mailers Market

Published : December 2022

Explore Packaging Insights

View Reports

Corrugated Fanfold Market