Corrugated Pallet Wrap Market Size, Share & Forecast 2025 to 2035

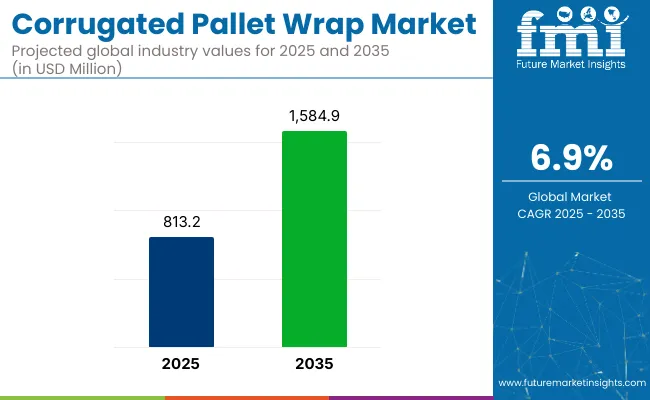
The global corrugated pallet wrap market is projected to grow from USD 813.2 million in 2025 to USD 1,584.9 million by 2035, registering a CAGR of 6.9% during the forecast period. Sales in 2024 were recorded at USD 765.5 million. This growth is primarily attributed to the rising emphasis on sustainable and recyclable packaging materials, increasing demand from logistics and warehousing sectors, and continued innovation in lightweight yet durable corrugated solutions.
Quick Stats of Corrugated Pallet Wrap Market

  • Market Value (2025): USD 813.2 million
  • Forecast Value (2035): USD 1,584.9 million
  • Forecast CAGR: 6.9%
  • Material Type Leader in 2025: corrugated fiberboard (48.1% market share)
  • Top End-Use Industry: food & beverage (45.7% share)
  • Key Growth Country: North America (USA to witness CAGR of 7.1%)

Corrugated Pallet Wrap Market

Metric Value
Market Size in 2025 USD 813.2 million
Projected Market Size in 2035 USD 1,584.9 million
CAGR (2025 to 2035) 6.9%

Corrugated pallet wrap, as a protective outer layer for palletized goods, offers eco-friendly advantages over traditional stretch films, delivering strength, stackability, and improved printability for branding and supply chain visibility.

Smurfit Kappa, a global leader in fiber-based packaging, and expand its corrugated packaging operations across North America and Europe, with a dedicated focus on pallet-ready wrap technologies. The investment will support the installation of automated high-speed corrugators and converting equipment optimized for warehouse and distribution applications.

“This expansion reflects our commitment to circular packaging and addresses the accelerating shift toward sustainable, paper-based pallet solutions,” stated Tony Smurfit, CEO of Smurfit Kappa.

Recent innovations in corrugated pallet wrap manufacturing have resulted in enhanced structural performance, customization, and eco-design. Producers are prioritizing fiber optimization techniques, lightweight fluting geometries, and coated barrier linings to increase product integrity while reducing raw material use. Advancements in digital printing have enabled supply chain traceability and branding on pallet wrap, especially valuable in retail-ready applications.

Additionally, some companies are incorporating smart tracking elements into corrugated wraps using RFID-embedded tags, enabling automated warehouse management. These improvements support better pallet stability, reduced environmental impact, and lower cost-per-unit shipped. As global shipping regulations tighten around plastic waste, corrugated pallet wrap is gaining preference as a compliant and biodegradable solution.

The corrugated pallet wrap market is poised for robust growth in developing economies, particularly across the Asia-Pacific and Latin America regions, where infrastructure upgrades, e-commerce expansion, and industrial growth are fueling packaging demand.

Countries such as India, Vietnam, and Mexico are experiencing a shift from traditional stretch wrap to fiber-based alternatives, driven by cost optimization, sustainability mandates, and increasing awareness among manufacturers. Beyond warehousing and logistics, corrugated pallet wraps are gaining traction in agri-export packaging, automotive parts logistics, and pharmaceuticals. Producers are expected to invest in modular wrap designs, retail-ready corrugated systems, and regionally sourced kraft liners to meet varied performance and compliance needs across global markets.

Analyzing Corrugated Pallet Wrap Market by Top Investment Segment

The market has been segmented based on material type, end-use industry, distribution channel, and region. By material type, paperboard, corrugated fiberboard, and plastic have been utilized to deliver cost-efficient, durable, and recyclable wrapping solutions tailored for securing palletized goods during transit and storage.

End-use industries include food & beverage, pharmaceuticals, consumer goods, automotive, and electronics, each representing specific needs in logistics, product protection, and regulatory compliance. Distribution channels encompass direct sales, distributors, and online retail-reflecting the strategic shift towards omnichannel packaging procurement across both B2B and B2C landscapes.

Regional segmentation spans North America, Europe, Asia-Pacific, Latin America, and the Middle East & Africa, capturing variations in export volume, packaging standards, and sustainability mandates impacting pallet wrap adoption globally.
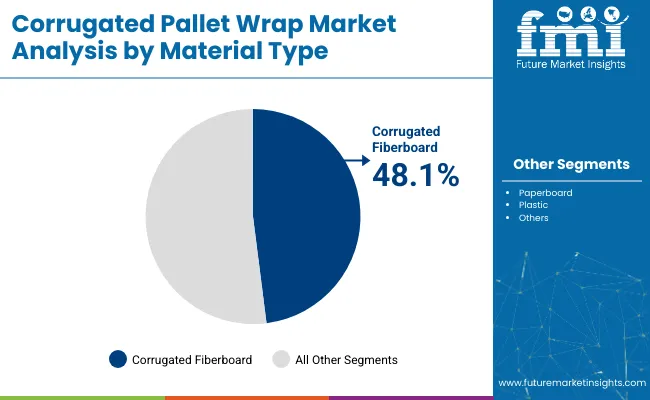
Corrugated Fiberboard Segment to Command 48.1% Share Due to Structural Strength and Recyclability

Corrugated Pallet Wrap Market Analysis By Material Type

The corrugated fiberboard segment is expected to account for the highest share of 48.1% in the corrugated pallet wrap market by 2025, supported by its superior cushioning properties, high stacking strength, and cost-efficient profile. Corrugated fiberboard is widely preferred for pallet wrapping applications in logistics and shipping due to its rigidity, shock absorption, and recyclability.

With increasing regulatory and commercial pressure to phase out plastic-based pallet wraps, corrugated fiberboard has emerged as a leading alternative across distribution centers, export packaging hubs, and e-commerce fulfillment facilities. Its ability to prevent product shifting, protect against impact damage, and maintain load stability during long-haul shipments makes it indispensable in both domestic and international supply chains.

The corrugated wraps are often designed with perforations or breathable slots, enabling ventilation for perishables and reducing condensation. Recent innovations in laminated coatings and water-resistant adhesives have further enhanced their application versatility without compromising recyclability. Corrugated fiberboard’s compatibility with automated wrapping machinery and custom printability has increased its appeal in high-throughput environments.
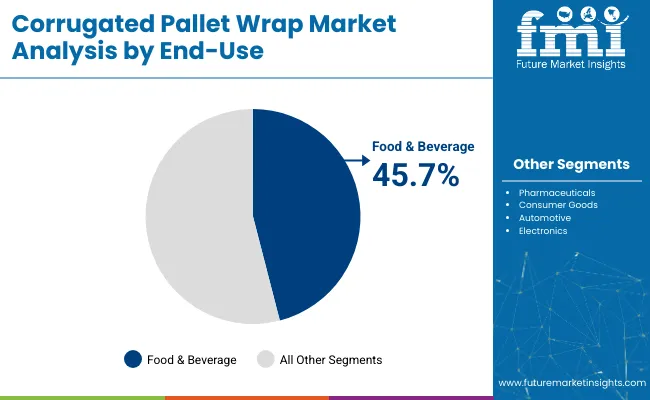
Food & Beverage Segment Driven by High-Volume, Perishable Transit Needs

Corrugated Pallet Wrap Market Analysis By End Use

The food & beverage segment is projected to dominate the end-use industry category with a 45.7% share in 2025, owing to its high demand for durable, hygienic, and eco-friendly palletization solutions. From bottled beverages and dairy cartons to processed food cartons and fresh produce trays, corrugated pallet wraps are widely used to secure secondary packaging during storage and transit.

This segment’s dominance is closely tied to the rapid expansion of cold chain logistics, organized retail, and international food exports. Corrugated wraps offer a clean, safe, and printable surface for SKU tracking, barcoding, and branding, which is critical for traceability and compliance in the food supply chain.

Pallet wraps made of corrugated fiberboard are particularly favored in sectors such as fruits and vegetables, bakery, dairy, and ready-to-eat foods, where product integrity, moisture resistance, and stacking performance are key. Their disposable yet recyclable nature aligns with industry sustainability goals, helping brands reduce carbon footprints and plastic waste.

With global food distribution becoming increasingly dynamic and sustainability-centric, the food & beverage sector will remain the prime end-user of corrugated pallet wraps, driving both innovation and volume demand through 2035.

Challenges and Opportunities

Challenges

Cost Constraints, Durability Issues, and Competition from Plastic-Based Wraps

The corrugated pallet wrap market also presents some challenges, mainly higher production costs in comparison to plastic stretch films and shrink wraps. Corrugated pallet wraps, being environmentally friendly and recyclable cannot match the stretch ability of the conventional plastic wraps or their load-securing strength which increases the risk of product moving during transportation.

Furthermore, moisture sensitivity and prolonged exposure to extreme weather conditions can weaken the structural integrity of corrugated wraps, preventing their widespread adoption in cold chain logistics and outdoor storage. The other significant challenge is competition against all plastic-based wraps, which are still predominant across sectors like food, pharma, and industrial packaging, where strength, moisture-proof performance, and transparency guarantees stock visibility and protection..

Opportunities

Growth in Sustainable Packaging, E-Commerce Logistics, and Smart Supply Chain Innovations

Nevertheless, the corrugated pallet wrap market is anticipated to witness robust growth owing to the surge in sustainable packaging solutions market, stringent regulations on plastic waste management, and the rise of e-commerce-centered logistics. With many governments no longer allowing single-use plastics, manufacturers are looking into biodegradable, recyclable and fiber-based pallet wraps.

Moreover, sustainability, through tech such as AI-powered supply chain optimization and automated pallet wrapping, leads to more load stabilization through the use of lesser, eco-friendly materials. Closed-loop recycling programs and sustainable logistics initiatives are forcing corrugated pallet wraps into the space eliminating more plastic-based pallet securing methods.
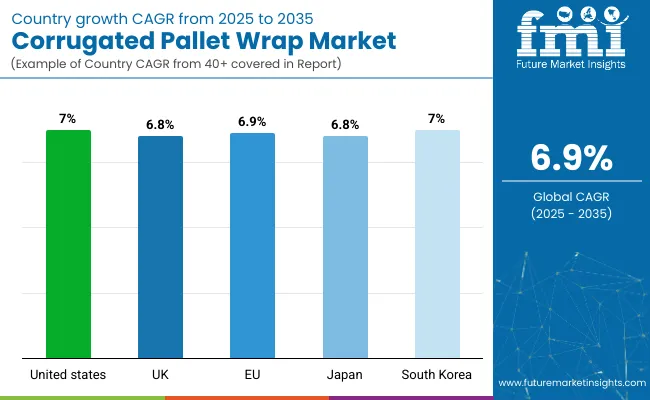
Country Wise Outlook

Corrugated Pallet Wrap Market Country Wise Analysis

United States

The USA corrugated pallet wrap market has grown steadily and is expected to maintain its growth during the forecast period, with more and more demand for economic, and sustainable protective packaging material observed in logistics and supply chain industries. Increasing use of sustainable materials and a shift away from plastic-based pallet wraps are driving market growth. Furthermore, changes such as the growth of e-commerce and demand for durable and recyclable packaging materials are also a driving force behind more demand in this industry.

Country CAGR (2025 to 2035)
USA 7.0%

United Kingdom

The UK market is growing for corrugated pallet wrap, as companies are looking for recyclable and biodegradable substitutes to plastic stretch films. Increasing emphasis on reduction of carbon footprints along with adherence to stringent environmental regulations are fueling adoption. Moreover, the growing investments in the advanced corrugated packaging development technologies and light-weight and high-strength materials are revitalizing the market expansion.

Country CAGR (2025 to 2035)
UK 6.8%

European Union

Due to sustainability programs and stringent packaging waste legislation, the corrugated pallet wrap market is growing strongly across Europe and is expected to remain strong in the coming years. The growing preference for fiber-based, recyclable packaging solutions across logistics, retail, and manufacturing sectors is bolstering market growth. Moreover, the growing implementation of automation in packaging and the increasing need for innovative pallet protection materials are supporting growth in the industry.

Country CAGR (2025 to 2035)
European Union (EU) 6.9%

Japan

Growth of the Japan corrugated pallet wrap market is moderate, which can be attributed to rising investments in sustainable packaging solutions in logistics and retail. Its commitment to cutting plastic waste and encouraging fiber-based packaging materials is boosting demand. Furthermore, high-strength and lightweight corrugated wraps are also advancing product penetration in export-oriented industries.

Country CAGR (2025 to 2035)
Japan 6.8%

South Korea

The corrugated pallet wrap market in South Korea is gaining traction as there is increasing focus on using sustainable and recyclable packaging material in logistics and distribution. Demand in the market is driven by a surge in government policies favoring the uptake of environmentally-friendly packaging, and the emergence of automated warehouses. Moreover, growing exports and trade activities are also driving the adoption of corrugated pallet wrap solutions.

Country CAGR (2025 to 2035)
South Korea 7.0%

Competitive Outlook

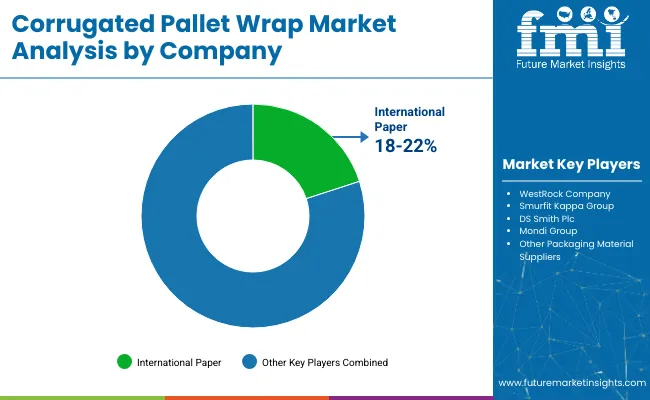
Corrugated Pallet Wrap Market Analysis By Company

The corrugated pallet wrap market is growing, as sustainability and being lightweight, as well as affordability of packaging material in logistics, e-commerce, food & beverage, and industrial transportation. Sustainable manufacturers are developing AI enabled material optimization, high strength corrugated wraps and biodegradable substitutes for plastic stretch films for better load stability, impact resistance and recyclability for the businesses to adopt.

Technological advancements driven by key companies in this market span a range of sectors including corrugated packaging manufacturers, logistics packaging solution providers, and sustainable wrapping material companies that help customers achieve efficiency through pallet protection, AI-powered packaging quality control, and sustainable solutions in the supply chain.

Key Companies

  • International Paper Company
  • Smurfit Kappa Group
  • Mondi Group
  • WestRock Company
  • DS Smith Plc
  • Georgia-Pacific LLC
  • Packaging Corporation of America
  • Stora Enso Oyj
  • Klabin S.A.
  • Rengo Co., Ltd.

Key Segments

By Material Type:

  • Paperboard
  • Corrugated Fiberboard
  • Plastic

By End-Use Industry:

  • Food & Beverage
  • Pharmaceuticals
  • Consumer Goods
  • Automotive
  • Electronics

By Distribution Channel:

  • Direct Sales
  • Distributors
  • Online Retail

By Region:

  • North America
  • Europe
  • Asia-Pacific
  • Latin America
  • Middle East & Africa

Table of Content

  1. Executive Summary
    • Global Market Outlook
    • Demand-side Trends
    • Supply-side Trends
    • Technology Roadmap Analysis
    • Analysis and Recommendations
  2. Market Overview
    • Market Coverage / Taxonomy
    • Market Definition / Scope / Limitations
  3. Market Background
    • Market Dynamics
      • Drivers
      • Restraints
      • Opportunity
      • Trends
    • Scenario Forecast
      • Demand in Optimistic Scenario
      • Demand in Likely Scenario
      • Demand in Conservative Scenario
    • Opportunity Map Analysis
    • Product Life Cycle Analysis
    • Supply Chain Analysis
      • Supply Side Participants and their Roles
        • Producers
        • Mid-Level Participants (Traders/ Agents/ Brokers)
        • Wholesalers and Distributors
      • Value Added and Value Created at Node in the Supply Chain
      • List of Raw Material Suppliers
      • List of Existing and Potential Buyer’s
    • Investment Feasibility Matrix
    • Value Chain Analysis
      • Profit Margin Analysis
      • Wholesalers and Distributors
      • Retailers
    • PESTLE and Porter’s Analysis
    • Regulatory Landscape
      • By Key Regions
      • By Key Countries
    • Regional Parent Market Outlook
    • Production and Consumption Statistics
    • Import and Export Statistics
  4. Global Market Analysis 2020 to 2024 and Forecast, 2025 to 2035
    • Historical Market Size Value (USD Million) & Volume (Units) Analysis, 2020 to 2024
    • Current and Future Market Size Value (USD Million) & Volume (Units) Projections, 2025 to 2035
      • Y-o-Y Growth Trend Analysis
      • Absolute $ Opportunity Analysis
  5. Global Market Pricing Analysis 2020 to 2024 and Forecast 2025 to 2035
  6. Global Market Analysis 2020 to 2024 and Forecast 2025 to 2035, By Material Type
    • Introduction / Key Findings
    • Historical Market Size Value (USD Million) & Volume (Units) Analysis By Material Type, 2020 to 2024
    • Current and Future Market Size Value (USD Million) & Volume (Units) Analysis and Forecast By Material Type, 2025 to 2035
      • Paperboard
      • Corrugated Fiberboard
      • Plastic
    • Y-o-Y Growth Trend Analysis By Material Type, 2020 to 2024
    • Absolute $ Opportunity Analysis By Material Type, 2025 to 2035
  7. Global Market Analysis 2020 to 2024 and Forecast 2025 to 2035, By End-Use
    • Introduction / Key Findings
    • Historical Market Size Value (USD Million) & Volume (Units) Analysis By End-Use , 2020 to 2024
    • Current and Future Market Size Value (USD Million) & Volume (Units) Analysis and Forecast By End-Use , 2025 to 2035
      • Food & Beverage
      • Pharmaceuticals
      • Consumer Goods
      • Automotive
      • Electronics
    • Y-o-Y Growth Trend Analysis By End-Use , 2020 to 2024
    • Absolute $ Opportunity Analysis By End-Use , 2025 to 2035
  8. Global Market Analysis 2020 to 2024 and Forecast 2025 to 2035, By Distribution Channel
    • Introduction / Key Findings
    • Historical Market Size Value (USD Million) & Volume (Units) Analysis By Distribution Channel, 2020 to 2024
    • Current and Future Market Size Value (USD Million) & Volume (Units) Analysis and Forecast By Distribution Channel, 2025 to 2035
      • Direct Sales
      • Distributors
      • Online Retail
    • Y-o-Y Growth Trend Analysis By Distribution Channel, 2020 to 2024
    • Absolute $ Opportunity Analysis By Distribution Channel, 2025 to 2035
  9. Global Market Analysis 2020 to 2024 and Forecast 2025 to 2035, By Region
    • Introduction
    • Historical Market Size Value (USD Million) & Volume (Units) Analysis By Region, 2020 to 2024
    • Current Market Size Value (USD Million) & Volume (Units) Analysis and Forecast By Region, 2025 to 2035
      • North America
      • Latin America
      • Europe
      • East Asia
      • South Asia
      • Oceania
      • MEA
    • Market Attractiveness Analysis By Region
  10. North America Market Analysis 2020 to 2024 and Forecast 2025 to 2035, By Country
    • Historical Market Size Value (USD Million) & Volume (Units) Trend Analysis By Market Taxonomy, 2020 to 2024
    • Market Size Value (USD Million) & Volume (Units) Forecast By Market Taxonomy, 2025 to 2035
      • By Country
        • USA
        • Canada
      • By Material Type
      • By End-Use
      • By Distribution Channel
    • Market Attractiveness Analysis
      • By Country
      • By Material Type
      • By End-Use
      • By Distribution Channel
    • Key Takeaways
  11. Latin America Market Analysis 2020 to 2024 and Forecast 2025 to 2035, By Country
    • Historical Market Size Value (USD Million) & Volume (Units) Trend Analysis By Market Taxonomy, 2020 to 2024
    • Market Size Value (USD Million) & Volume (Units) Forecast By Market Taxonomy, 2025 to 2035
      • By Country
        • Brazil
        • Mexico
        • Argentina
        • Chile
        • Peru
        • Rest of Latin America
      • By Material Type
      • By End-Use
      • By Distribution Channel
    • Market Attractiveness Analysis
      • By Country
      • By Material Type
      • By End-Use
      • By Distribution Channel
    • Key Takeaways
  12. Europe Market Analysis 2020 to 2024 and Forecast 2025 to 2035, By Country
    • Historical Market Size Value (USD Million) & Volume (Units) Trend Analysis By Market Taxonomy, 2020 to 2024
    • Market Size Value (USD Million) & Volume (Units) Forecast By Market Taxonomy, 2025 to 2035
      • By Country
        • Germany
        • Italy
        • France
        • UK
        • Spain
        • Russia
        • BENELUX
        • Rest of Europe
      • By Material Type
      • By End-Use
      • By Distribution Channel
    • Market Attractiveness Analysis
      • By Country
      • By Material Type
      • By End-Use
      • By Distribution Channel
    • Key Takeaways
  13. East Asia Market Analysis 2020 to 2024 and Forecast 2025 to 2035, By Country
    • Historical Market Size Value (USD Million) & Volume (Units) Trend Analysis By Market Taxonomy, 2020 to 2024
    • Market Size Value (USD Million) & Volume (Units) Forecast By Market Taxonomy, 2025 to 2035
      • By Country
        • China
        • Japan
        • South Korea
      • By Material Type
      • By End-Use
      • By Distribution Channel
    • Market Attractiveness Analysis
      • By Country
      • By Material Type
      • By End-Use
      • By Distribution Channel
    • Key Takeaways
  14. South Asia Market Analysis 2020 to 2024 and Forecast 2025 to 2035, By Country
    • Historical Market Size Value (USD Million) & Volume (Units) Trend Analysis By Market Taxonomy, 2020 to 2024
    • Market Size Value (USD Million) & Volume (Units) Forecast By Market Taxonomy, 2025 to 2035
      • By Country
        • India
        • Thailand
        • Malaysia
        • Indonesia
        • Rest of South Asia
      • By Material Type
      • By End-Use
      • By Distribution Channel
    • Market Attractiveness Analysis
      • By Country
      • By Material Type
      • By End-Use
      • By Distribution Channel
    • Key Takeaways
  15. Oceania Market Analysis 2020 to 2024 and Forecast 2025 to 2035, By Country
    • Historical Market Size Value (USD Million) & Volume (Units) Trend Analysis By Market Taxonomy, 2020 to 2024
    • Market Size Value (USD Million) & Volume (Units) Forecast By Market Taxonomy, 2025 to 2035
      • By Country
        • Australia
        • New Zealand
      • By Material Type
      • By End-Use
      • By Distribution Channel
    • Market Attractiveness Analysis
      • By Country
      • By Material Type
      • By End-Use
      • By Distribution Channel
    • Key Takeaways
  16. MEA Market Analysis 2020 to 2024 and Forecast 2025 to 2035, By Country
    • Historical Market Size Value (USD Million) & Volume (Units) Trend Analysis By Market Taxonomy, 2020 to 2024
    • Market Size Value (USD Million) & Volume (Units) Forecast By Market Taxonomy, 2025 to 2035
      • By Country
        • GCC
        • Rest of MEA
      • By Material Type
      • By End-Use
      • By Distribution Channel
    • Market Attractiveness Analysis
      • By Country
      • By Material Type
      • By End-Use
      • By Distribution Channel
    • Key Takeaways
  17. Key Countries Market Analysis
    • USA
      • Pricing Analysis
      • Market Share Analysis, 2024
        • By Material Type
        • By End-Use
        • By Distribution Channel
    • Canada
      • Pricing Analysis
      • Market Share Analysis, 2024
        • By Material Type
        • By End-Use
        • By Distribution Channel
    • Brazil
      • Pricing Analysis
      • Market Share Analysis, 2024
        • By Material Type
        • By End-Use
        • By Distribution Channel
    • Mexico
      • Pricing Analysis
      • Market Share Analysis, 2024
        • By Material Type
        • By End-Use
        • By Distribution Channel
    • Argentina
      • Pricing Analysis
      • Market Share Analysis, 2024
        • By Material Type
        • By End-Use
        • By Distribution Channel
  18. Market Structure Analysis
    • Competition Dashboard
    • Competition Benchmarking
    • Market Share Analysis of Top Players
      • By Regional
      • By Material Type
      • By End-Use
      • By Distribution Channel
  19. Competition Analysis
    • Competition Deep Dive
      • International Paper Company
        • Overview
        • Product Portfolio
        • Profitability by Market Segments (Product/Age /Sales Channel/Region)
        • Sales Footprint
        • Strategy Overview
          • Marketing Strategy
          • Product Strategy
          • Channel Strategy
      • Smurfit Kappa Group
        • Overview
        • Product Portfolio
        • Profitability by Market Segments (Product/Age /Sales Channel/Region)
        • Sales Footprint
        • Strategy Overview
          • Marketing Strategy
          • Product Strategy
          • Channel Strategy
      • Mondi Group
        • Overview
        • Product Portfolio
        • Profitability by Market Segments (Product/Age /Sales Channel/Region)
        • Sales Footprint
        • Strategy Overview
          • Marketing Strategy
          • Product Strategy
          • Channel Strategy
      • WestRock Company
        • Overview
        • Product Portfolio
        • Profitability by Market Segments (Product/Age /Sales Channel/Region)
        • Sales Footprint
        • Strategy Overview
          • Marketing Strategy
          • Product Strategy
          • Channel Strategy
      • DS Smith Plc
        • Overview
        • Product Portfolio
        • Profitability by Market Segments (Product/Age /Sales Channel/Region)
        • Sales Footprint
        • Strategy Overview
          • Marketing Strategy
          • Product Strategy
          • Channel Strategy
      • Georgia-Pacific LLC
        • Overview
        • Product Portfolio
        • Profitability by Market Segments (Product/Age /Sales Channel/Region)
        • Sales Footprint
        • Strategy Overview
          • Marketing Strategy
          • Product Strategy
          • Channel Strategy
      • Packaging Corporation of America
        • Overview
        • Product Portfolio
        • Profitability by Market Segments (Product/Age /Sales Channel/Region)
        • Sales Footprint
        • Strategy Overview
          • Marketing Strategy
          • Product Strategy
          • Channel Strategy
      • Stora Enso Oyj
        • Overview
        • Product Portfolio
        • Profitability by Market Segments (Product/Age /Sales Channel/Region)
        • Sales Footprint
        • Strategy Overview
          • Marketing Strategy
          • Product Strategy
          • Channel Strategy
      • Klabin S.A.
        • Overview
        • Product Portfolio
        • Profitability by Market Segments (Product/Age /Sales Channel/Region)
        • Sales Footprint
        • Strategy Overview
          • Marketing Strategy
          • Product Strategy
          • Channel Strategy
      • Rengo Co., Ltd.
        • Overview
        • Product Portfolio
        • Profitability by Market Segments (Product/Age /Sales Channel/Region)
        • Sales Footprint
        • Strategy Overview
          • Marketing Strategy
          • Product Strategy
          • Channel Strategy
  20. Assumptions & Acronyms Used
  21. Research Methodology

List of Tables

  • Table 1: Global Market Value (USD Million) Forecast by Region, 2020-2035
  • Table 2: Global Market Volume (Units) Forecast by Region, 2020-2035
  • Table 3: Global Market Value (USD Million) Forecast by Material Type, 2020-2035
  • Table 4: Global Market Volume (Units) Forecast by Material Type, 2020-2035
  • Table 5: Global Market Value (USD Million) Forecast by End-Use , 2020-2035
  • Table 6: Global Market Volume (Units) Forecast by End-Use , 2020-2035
  • Table 7: Global Market Value (USD Million) Forecast by Distribution Channel, 2020-2035
  • Table 8: Global Market Volume (Units) Forecast by Distribution Channel, 2020-2035
  • Table 9: North America Market Value (USD Million) Forecast by Country, 2020-2035
  • Table 10: North America Market Volume (Units) Forecast by Country, 2020-2035
  • Table 11: North America Market Value (USD Million) Forecast by Material Type, 2020-2035
  • Table 12: North America Market Volume (Units) Forecast by Material Type, 2020-2035
  • Table 13: North America Market Value (USD Million) Forecast by End-Use , 2020-2035
  • Table 14: North America Market Volume (Units) Forecast by End-Use , 2020-2035
  • Table 15: North America Market Value (USD Million) Forecast by Distribution Channel, 2020-2035
  • Table 16: North America Market Volume (Units) Forecast by Distribution Channel, 2020-2035
  • Table 17: Latin America Market Value (USD Million) Forecast by Country, 2020-2035
  • Table 18: Latin America Market Volume (Units) Forecast by Country, 2020-2035
  • Table 19: Latin America Market Value (USD Million) Forecast by Material Type, 2020-2035
  • Table 20: Latin America Market Volume (Units) Forecast by Material Type, 2020-2035
  • Table 21: Latin America Market Value (USD Million) Forecast by End-Use , 2020-2035
  • Table 22: Latin America Market Volume (Units) Forecast by End-Use , 2020-2035
  • Table 23: Latin America Market Value (USD Million) Forecast by Distribution Channel, 2020-2035
  • Table 24: Latin America Market Volume (Units) Forecast by Distribution Channel, 2020-2035
  • Table 25: Europe Market Value (USD Million) Forecast by Country, 2020-2035
  • Table 26: Europe Market Volume (Units) Forecast by Country, 2020-2035
  • Table 27: Europe Market Value (USD Million) Forecast by Material Type, 2020-2035
  • Table 28: Europe Market Volume (Units) Forecast by Material Type, 2020-2035
  • Table 29: Europe Market Value (USD Million) Forecast by End-Use , 2020-2035
  • Table 30: Europe Market Volume (Units) Forecast by End-Use , 2020-2035
  • Table 31: Europe Market Value (USD Million) Forecast by Distribution Channel, 2020-2035
  • Table 32: Europe Market Volume (Units) Forecast by Distribution Channel, 2020-2035
  • Table 33: East Asia Market Value (USD Million) Forecast by Country, 2020-2035
  • Table 34: East Asia Market Volume (Units) Forecast by Country, 2020-2035
  • Table 35: East Asia Market Value (USD Million) Forecast by Material Type, 2020-2035
  • Table 36: East Asia Market Volume (Units) Forecast by Material Type, 2020-2035
  • Table 37: East Asia Market Value (USD Million) Forecast by End-Use , 2020-2035
  • Table 38: East Asia Market Volume (Units) Forecast by End-Use , 2020-2035
  • Table 39: East Asia Market Value (USD Million) Forecast by Distribution Channel, 2020-2035
  • Table 40: East Asia Market Volume (Units) Forecast by Distribution Channel, 2020-2035
  • Table 41: South Asia Market Value (USD Million) Forecast by Country, 2020-2035
  • Table 42: South Asia Market Volume (Units) Forecast by Country, 2020-2035
  • Table 43: South Asia Market Value (USD Million) Forecast by Material Type, 2020-2035
  • Table 44: South Asia Market Volume (Units) Forecast by Material Type, 2020-2035
  • Table 45: South Asia Market Value (USD Million) Forecast by End-Use , 2020-2035
  • Table 46: South Asia Market Volume (Units) Forecast by End-Use , 2020-2035
  • Table 47: South Asia Market Value (USD Million) Forecast by Distribution Channel, 2020-2035
  • Table 48: South Asia Market Volume (Units) Forecast by Distribution Channel, 2020-2035
  • Table 49: Oceania Market Value (USD Million) Forecast by Country, 2020-2035
  • Table 50: Oceania Market Volume (Units) Forecast by Country, 2020-2035
  • Table 51: Oceania Market Value (USD Million) Forecast by Material Type, 2020-2035
  • Table 52: Oceania Market Volume (Units) Forecast by Material Type, 2020-2035
  • Table 53: Oceania Market Value (USD Million) Forecast by End-Use , 2020-2035
  • Table 54: Oceania Market Volume (Units) Forecast by End-Use , 2020-2035
  • Table 55: Oceania Market Value (USD Million) Forecast by Distribution Channel, 2020-2035
  • Table 56: Oceania Market Volume (Units) Forecast by Distribution Channel, 2020-2035
  • Table 57: MEA Market Value (USD Million) Forecast by Country, 2020-2035
  • Table 58: MEA Market Volume (Units) Forecast by Country, 2020-2035
  • Table 59: MEA Market Value (USD Million) Forecast by Material Type, 2020-2035
  • Table 60: MEA Market Volume (Units) Forecast by Material Type, 2020-2035
  • Table 61: MEA Market Value (USD Million) Forecast by End-Use , 2020-2035
  • Table 62: MEA Market Volume (Units) Forecast by End-Use , 2020-2035
  • Table 63: MEA Market Value (USD Million) Forecast by Distribution Channel, 2020-2035
  • Table 64: MEA Market Volume (Units) Forecast by Distribution Channel, 2020-2035

List of Figures

  • Figure 1: Global Market Volume (Units) Forecast 2020-2035
  • Figure 2: Global Market Pricing Analysis
  • Figure 3: Global Market Value (USD Million) Forecast 2020-2035
  • Figure 4: Global Market Value Share and BPS Analysis by Material Type, 2025 and 2035
  • Figure 5: Global Market Y-o-Y Growth Comparison by Material Type, 2025-2035
  • Figure 6: Global Market Attractiveness Analysis by Material Type
  • Figure 7: Global Market Value Share and BPS Analysis by End-Use , 2025 and 2035
  • Figure 8: Global Market Y-o-Y Growth Comparison by End-Use , 2025-2035
  • Figure 9: Global Market Attractiveness Analysis by End-Use
  • Figure 10: Global Market Value Share and BPS Analysis by Distribution Channel, 2025 and 2035
  • Figure 11: Global Market Y-o-Y Growth Comparison by Distribution Channel, 2025-2035
  • Figure 12: Global Market Attractiveness Analysis by Distribution Channel
  • Figure 13: Global Market Value (USD Million) Share and BPS Analysis by Region, 2025 and 2035
  • Figure 14: Global Market Y-o-Y Growth Comparison by Region, 2025-2035
  • Figure 15: Global Market Attractiveness Analysis by Region
  • Figure 16: North America Market Incremental $ Opportunity, 2025-2035
  • Figure 17: Latin America Market Incremental $ Opportunity, 2025-2035
  • Figure 18: Europe Market Incremental $ Opportunity, 2025-2035
  • Figure 19: East Asia Market Incremental $ Opportunity, 2025-2035
  • Figure 20: South Asia Market Incremental $ Opportunity, 2025-2035
  • Figure 21: Oceania Market Incremental $ Opportunity, 2025-2035
  • Figure 22: MEA Market Incremental $ Opportunity, 2025-2035
  • Figure 23: North America Market Value Share and BPS Analysis by Country, 2025 and 2035
  • Figure 24: North America Market Value Share and BPS Analysis by Material Type, 2025 and 2035
  • Figure 25: North America Market Y-o-Y Growth Comparison by Material Type, 2025-2035
  • Figure 26: North America Market Attractiveness Analysis by Material Type
  • Figure 27: North America Market Value Share and BPS Analysis by End-Use , 2025 and 2035
  • Figure 28: North America Market Y-o-Y Growth Comparison by End-Use , 2025-2035
  • Figure 29: North America Market Attractiveness Analysis by End-Use
  • Figure 30: North America Market Value Share and BPS Analysis by Distribution Channel, 2025 and 2035
  • Figure 31: North America Market Y-o-Y Growth Comparison by Distribution Channel, 2025-2035
  • Figure 32: North America Market Attractiveness Analysis by Distribution Channel
  • Figure 33: Latin America Market Value Share and BPS Analysis by Country, 2025 and 2035
  • Figure 34: Latin America Market Value Share and BPS Analysis by Material Type, 2025 and 2035
  • Figure 35: Latin America Market Y-o-Y Growth Comparison by Material Type, 2025-2035
  • Figure 36: Latin America Market Attractiveness Analysis by Material Type
  • Figure 37: Latin America Market Value Share and BPS Analysis by End-Use , 2025 and 2035
  • Figure 38: Latin America Market Y-o-Y Growth Comparison by End-Use , 2025-2035
  • Figure 39: Latin America Market Attractiveness Analysis by End-Use
  • Figure 40: Latin America Market Value Share and BPS Analysis by Distribution Channel, 2025 and 2035
  • Figure 41: Latin America Market Y-o-Y Growth Comparison by Distribution Channel, 2025-2035
  • Figure 42: Latin America Market Attractiveness Analysis by Distribution Channel
  • Figure 43: Europe Market Value Share and BPS Analysis by Country, 2025 and 2035
  • Figure 44: Europe Market Value Share and BPS Analysis by Material Type, 2025 and 2035
  • Figure 45: Europe Market Y-o-Y Growth Comparison by Material Type, 2025-2035
  • Figure 46: Europe Market Attractiveness Analysis by Material Type
  • Figure 47: Europe Market Value Share and BPS Analysis by End-Use , 2025 and 2035
  • Figure 48: Europe Market Y-o-Y Growth Comparison by End-Use , 2025-2035
  • Figure 49: Europe Market Attractiveness Analysis by End-Use
  • Figure 50: Europe Market Value Share and BPS Analysis by Distribution Channel, 2025 and 2035
  • Figure 51: Europe Market Y-o-Y Growth Comparison by Distribution Channel, 2025-2035
  • Figure 52: Europe Market Attractiveness Analysis by Distribution Channel
  • Figure 53: East Asia Market Value Share and BPS Analysis by Country, 2025 and 2035
  • Figure 54: East Asia Market Value Share and BPS Analysis by Material Type, 2025 and 2035
  • Figure 55: East Asia Market Y-o-Y Growth Comparison by Material Type, 2025-2035
  • Figure 56: East Asia Market Attractiveness Analysis by Material Type
  • Figure 57: East Asia Market Value Share and BPS Analysis by End-Use , 2025 and 2035
  • Figure 58: East Asia Market Y-o-Y Growth Comparison by End-Use , 2025-2035
  • Figure 59: East Asia Market Attractiveness Analysis by End-Use
  • Figure 60: East Asia Market Value Share and BPS Analysis by Distribution Channel, 2025 and 2035
  • Figure 61: East Asia Market Y-o-Y Growth Comparison by Distribution Channel, 2025-2035
  • Figure 62: East Asia Market Attractiveness Analysis by Distribution Channel
  • Figure 63: South Asia Market Value Share and BPS Analysis by Country, 2025 and 2035
  • Figure 64: South Asia Market Value Share and BPS Analysis by Material Type, 2025 and 2035
  • Figure 65: South Asia Market Y-o-Y Growth Comparison by Material Type, 2025-2035
  • Figure 66: South Asia Market Attractiveness Analysis by Material Type
  • Figure 67: South Asia Market Value Share and BPS Analysis by End-Use , 2025 and 2035
  • Figure 68: South Asia Market Y-o-Y Growth Comparison by End-Use , 2025-2035
  • Figure 69: South Asia Market Attractiveness Analysis by End-Use
  • Figure 70: South Asia Market Value Share and BPS Analysis by Distribution Channel, 2025 and 2035
  • Figure 71: South Asia Market Y-o-Y Growth Comparison by Distribution Channel, 2025-2035
  • Figure 72: South Asia Market Attractiveness Analysis by Distribution Channel
  • Figure 73: Oceania Market Value Share and BPS Analysis by Country, 2025 and 2035
  • Figure 74: Oceania Market Value Share and BPS Analysis by Material Type, 2025 and 2035
  • Figure 75: Oceania Market Y-o-Y Growth Comparison by Material Type, 2025-2035
  • Figure 76: Oceania Market Attractiveness Analysis by Material Type
  • Figure 77: Oceania Market Value Share and BPS Analysis by End-Use , 2025 and 2035
  • Figure 78: Oceania Market Y-o-Y Growth Comparison by End-Use , 2025-2035
  • Figure 79: Oceania Market Attractiveness Analysis by End-Use
  • Figure 80: Oceania Market Value Share and BPS Analysis by Distribution Channel, 2025 and 2035
  • Figure 81: Oceania Market Y-o-Y Growth Comparison by Distribution Channel, 2025-2035
  • Figure 82: Oceania Market Attractiveness Analysis by Distribution Channel
  • Figure 83: MEA Market Value Share and BPS Analysis by Country, 2025 and 2035
  • Figure 84: MEA Market Value Share and BPS Analysis by Material Type, 2025 and 2035
  • Figure 85: MEA Market Y-o-Y Growth Comparison by Material Type, 2025-2035
  • Figure 86: MEA Market Attractiveness Analysis by Material Type
  • Figure 87: MEA Market Value Share and BPS Analysis by End-Use , 2025 and 2035
  • Figure 88: MEA Market Y-o-Y Growth Comparison by End-Use , 2025-2035
  • Figure 89: MEA Market Attractiveness Analysis by End-Use
  • Figure 90: MEA Market Value Share and BPS Analysis by Distribution Channel, 2025 and 2035
  • Figure 91: MEA Market Y-o-Y Growth Comparison by Distribution Channel, 2025-2035
  • Figure 92: MEA Market Attractiveness Analysis by Distribution Channel
  • Figure 93: Global Market - Tier Structure Analysis
  • Figure 94: Global Market - Company Share Analysis

Frequently Asked Questions

What was the overall size of the corrugated pallet wrap market 2025?

The overall market size for corrugated pallet wrap market was USD 813.2 Million in 2025.

How big the Bio is based corrugated pallet wrap market expected in 2035?

Corrugated pallet wrap market is expected to reach USD 1,584.9 Million in 2035.

What will drive the demand for corrugated pallet wrap market during the forecast period?

The demand for corrugated pallet wrap is expected to rise due to increasing e-commerce and logistics activities, growing preference for eco-friendly packaging solutions, and rising demand for secure and cost-effective pallet stabilization.

List the top 5 countries contributing in corrugated pallet wrap market?

The top 5 countries which drives the development of corrugated pallet wrap market are USA, UK, Europe Union, Japan and South Korea.

Which segment in type is expected to lead in corrugated pallet wrap market?

Food & Beverage Industry and Unbleached Kraft Liner to command significant share over the assessment period.

Explore Similar Insights

Future Market Insights

Corrugated Pallet Wrap Market