Corrugated Fiberboard Market Outlook 2025 to 2035

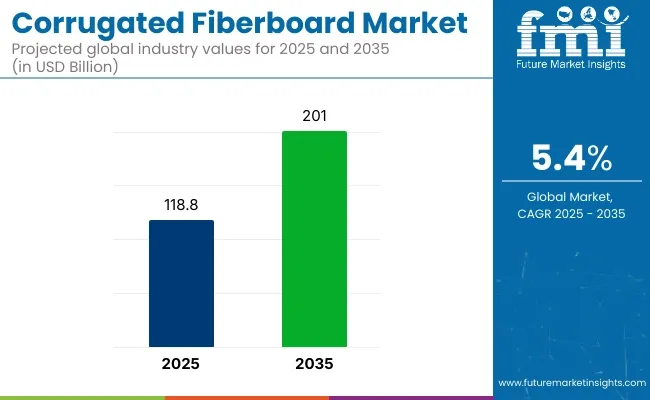
The corrugated fiberboard market is projected to grow from USD 118.8 billion in 2025 to USD 201.0 billion by 2035, registering a CAGR of 5.4% during the forecast period. Growth was supported by increased demand for recyclable shipping materials and sustainable secondary packaging formats. Surge in grocery delivery, electronics distribution, and regulatory focus on plastic reduction contributed to this rise.
Corrugated Fiberboard Market

Metric Value
Market Size in 2025 USD 118.8 billion
Projected Market Size in 2035 USD 201.0 billion
CAGR (2025 to 2035) 5.4%

In 2024, Smurfit Kappa has demonstrated its commitment to delivering on its sustainability goals through the recent inauguration of two state-of-the-art investments in Spain. Javier Rivas, COO of Smurfit Kappa Paper & Board Europe, said: “The recent inauguration of both the Sangüesa and the Nervión investments are milestones for the Smurfit Kappa paper division and aligned with the EU Green Deal’s transition to climate neutrality through increasing clean energy technologies.

Garrett Quinn, Chief Sustainability Officer at Smurfit Kappa, added: “These two projects demonstrate the Group’s continued investment to deliver on its sustainability goals with over €30 million in these two projects alone, delivering reduced emissions, and increasing the circularity of our production process.”

In the USA, box shipments reported by the Fibre Box Association in Q1 2025 showed an uptick in demand for recycled content grades. Member companies noted greater adoption of lightweight corrugated products in omnichannel retail packaging. In its April 2025 bulletin, the Confederation of European Paper Industries (CEPI) highlighted increased output of corrugated containers in France and Germany, driven by bans on single-use plastic trays and films. The market is moving toward smart and functional solutions.

DS Smith announced in 2024 the rollout of smart corrugated trays embedded with scannable codes, designed to track grocery shelf life and optimize inventory management. Customizable features like humidity protection coatings and tamper-evident fluting have also been introduced across pharmaceutical-grade fiberboard SKUs.

Sustainability is shaping procurement policies. In 2024, the Ministry of Commerce and Industry in India issued state procurement guidelines favouring recycled and virgin kraft liners. Fiberboard manufacturers supplying packaging to agricultural exporters were among the first to benefit.

Meanwhile, Japan Packaging Institute reports continued innovation in plastic-free coating solutions for corrugated trays in fresh produce exports. The corrugated fiberboard market is expected to grow steadily. Stricter environmental regulations, especially in Europe and Asia, are expected to mandate the use of biodegradable and recyclable packaging materials. Manufacturers who prioritize bio-based adhesives, compostable liners, and digital traceability are expected to gain long-term strategic advantage.

Analyzing Corrugated Fiberboard Market by Top Investment Segments

Double Wall Boards Remain Preferred for Durability and High Load-Bearing Applications

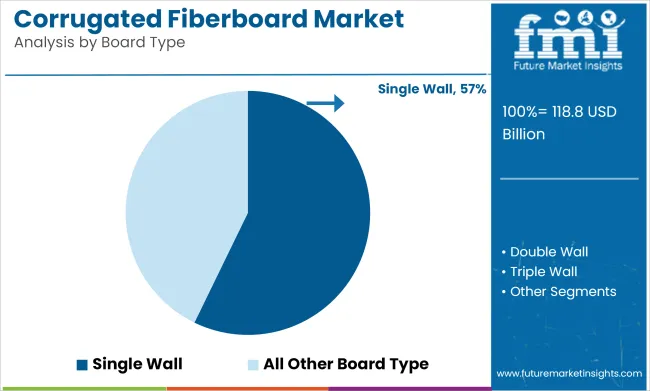
By board type, double wall corrugated fibreboards are expected to dominate with a market share of around 57.2% by 2025, owing to their superior strength-to-weight ratio and ability to withstand stacking pressure. These boards consist of two fluted mediums and three linerboards, offering enhanced protection and cushioning during transit. As a result, they are heavily used in packaging heavy items such as electronics, machinery components, bulk food products, and beverages.
Corrugated Fiberboard Market Analysis By Board Type

Double wall boards are particularly favoured in export-oriented packaging and e-commerce shipping due to their structural integrity and shock resistance. With the rising demand for protective, eco-friendly, and cost-effective secondary packaging, manufacturers have continued to increase the production of double wall variants, particularly in customizable formats for automated packaging lines. While triple wall boards offer even higher durability, their usage remains limited to niche industrial segments, and their share is expected to remain below 15% in 2025.

Food & Beverage Industry Emerges as the Leading End User amid Rise in Packaged and Ready-to-Eat Products

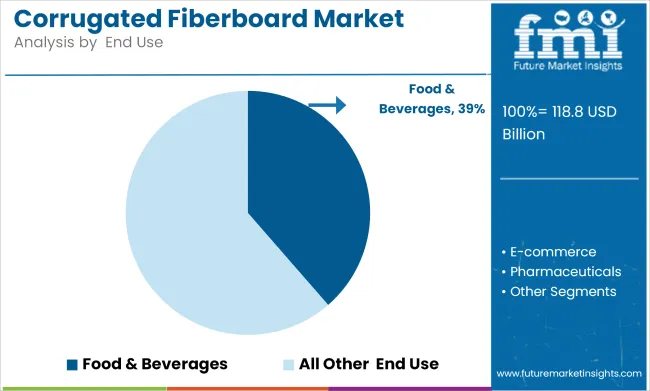
By end use, the food & beverage segment is projected to hold approximately 38.6% of the corrugated fiberboard market by 2025, driven by rapid growth in packaged food, takeaway meals, frozen foods, and bottled beverages. Corrugated fiberboard is widely used for secondary and tertiary packaging of products such as cereal boxes, beverage carriers, and fruit and vegetable trays.
Corrugated Fiberboard Market Analysis By End Use

The ability of corrugated fiberboard to offer thermal insulation, high printability, and moisture resistance makes it ideal for the food and beverage supply chain, especially under cold-chain logistics and shelf-ready packaging. The increasing penetration of quick service restaurants (QSRs) and online food delivery platforms has also contributed to the segment’s demand for lightweight and cost-effective box formats.

Sustainable packaging regulations and rising consumer preference for recyclable materials are encouraging companies to replace plastic-based solutions with fiber-based alternatives. Consequently, the food & beverage sector continues to be the largest consumer of corrugated fiberboard packaging, supporting consistent growth in the global market.

Challenges and Opportunities

Challenges

Fluctuating Raw Material Costs, Recycling Limitations, and Competition from Alternative Packaging

One of the significant challenges of the corrugated fiberboard market is the rising prices of raw materials like wood pulp and recycled paper, which are affected by deforestation issues, global supply chain disruptions, and energy costs. Though widely recyclable, there are sustainability challenges surrounding corrugated packaging in terms of moisture resistance, retaining strength through multiple recycling cycles, and contamination from food or chemicals.

Competition from alternative packaging materials poses another important challenge, with biodegradable plastics, molded pulp and lightweight foam solutions, among others, providing functionalities such as reduced weight and better durability or protection for specific applications.

Opportunities

Growth in E-Commerce, Sustainable Packaging Innovations, and Smart Logistics Solutions

However, the corrugated fiberboard market also faces challenges during these times, including sustainability challenges and a shifting packaging landscape. The rise of online shopping, home deliveries and subscription-based retail is boosting demand for shipping materials that are lightweight, recyclable and inexpensive.

And also new materials from water-resistant, reinforced, biodegradable fiberboards to more eco-friendly options are tackling sustainability issues. Utilization of AI-based logistics, IoT-supported tracking and smart packaging solutions are an added driver of the efficiency of corrugated fiberboard in supply chains.
Country Wise Outlook

Country Wise Analysis Of Corrugated Fiberboard Market

United States

Corrugated fiberboard market in the USA is driven by increasing demand for sustainable and lightweight packaging solutions in various industries such as e-commerce, food & beverage, and electronics. Demand is also driven consistently by the increasing adoption of recyclable and biodegradable fiberboard materials by manufacturers in line with corporate sustainability initiatives and government regulations on packaging waste reduction. Moreover, developing printing technology and smart packaging encasing are trending the market towards growth.

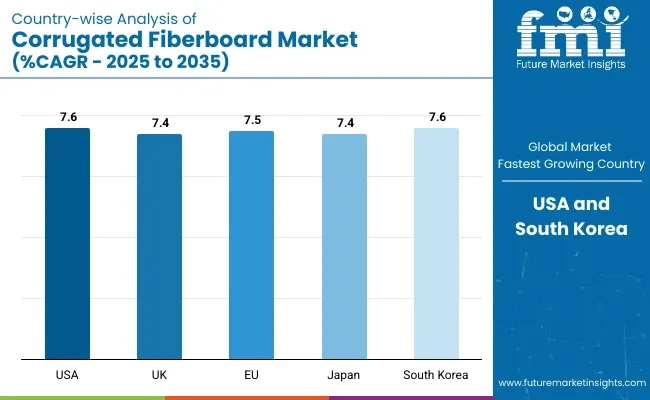
Country CAGR (2025 to 2035)
USA 7.6%

United Kingdom

Another reason driving the market in the United Kingdom is the growing emphasis on sustainable packaging solutions and the rapid growth of online retail in the country. New stringent regulations on single-use plastics have catalyzed many businesses to turn to corrugated fiberboard as a replacement. Furthermore, advances in moisture-resistant and high-strength corrugated packaging are expanding its scope of application across numerous industries.

Country CAGR (2025 to 2035)
UK 7.4%

European Union

With companies across the European Union concentrating on circular economy initiatives and sustainable packaging solutions, the corrugated fiberboard market is rapidly growing. Tight EU environmental rules and recycled packaging materials incentives are driving demand in the market. In addition, a surge in demand for personalized, lightweight, and consumable packaging solutions, especially from e-commerce and consumer goods sectors, is propelling the industry landscape.

Country CAGR (2025 to 2035)
European Union (EU) 7.5%

Japan

The market for corrugated fiberboard in Japan is growing at a stalemate and is supported by the highlight of precision packaging in the country along with its manufactured premium materials and forming market i.e., the corrugated fiberboard. Market growth is attributed to the rising need for protective and lightweight packaging solutions in the electronics, automotive, and food sectors. Moreover, smart packaging and automation related technical advancements are aiding to enhance the efficiency of the packaging industry.

Country CAGR (2025 to 2035)
Japan 7.4%

South Korea

The Corrugated Fiberboard market in South Korea certainly considerations of regional distribution, and the specialists situated there may likewise have restrictions on current arrangements. The market growth is additionally driven by government policies supporting green packaging and rising use of digitally-printed corrugated fiberboard as a branding tool. Furthermore, the growing need for high-performance corrugated materials in logistics and supply chain industries is promoting industry growth.

Country CAGR (2025 to 2035)
South Korea 7.6%

Competitive Outlook

The corrugated fiberboard has been segmented into product and application. To make packaging more durable, cost-effective and environmentally sustainable, businesses are investing in AI-based corrugated board optimization, development of high-strength fiberboard, recyclable packaging products and more.

Paperboard manufacturers, packaging solution providers, and industrial shipping material companies can leverage opportunities from the advancements in fiberboard production technology, AI-based material efficiency, and packaging sustainability innovations.
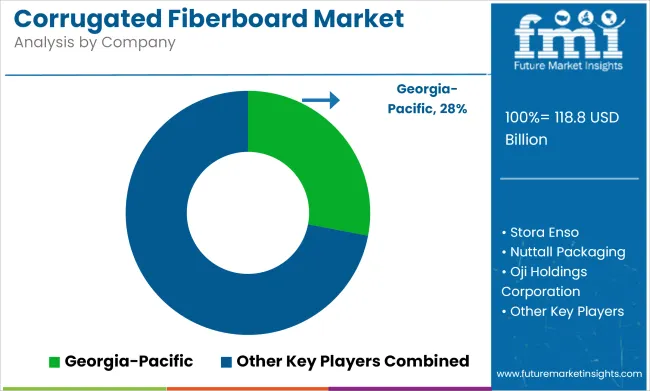
Key Market Insights

Corrugated Fiberboard Market Analysis By Company

International Paper (18-22%)

International Paper is a top player in the corrugated fiberboard market, providing strong, lightweight packaging for customers and an AI-powered material sustainability assessment, as well as cost-effective packaging for logistics and retail applications.

WestRock Company (12-16%)

WestRock, a leader in recycling-focused corrugated fiberboard, is committed to helping brands reduce costs at every step of the supply chain while providing tailored packaging solutions powered by artificial intelligence.

Smurfit Kappa Group (10-14%)

Smurfit Kappa stalks sustainable supply streams with its specialized AI to produce optimized solutions for corrugated fiberboard durability analysis and sustainable material sourcing.

Mondi Group (8-12%)

Mondi is a practitioner of premium corrugated fiberboard packaging, building in AI-driven structural improvements and ultra-lightweight packaging innovations.

DS Smith Plc (5-9%)

DS Smith creates biodegradable fiberboard packaging that is integrated with AI, ensuring production efficiency and optimum box performance for shipping around the world.

Other Key Players (30-40% Combined)

Several paper packaging firms, logistics solution providers, and sustainable packaging companies contribute to next-generation corrugated fiberboard innovations, AI-powered production advancements, and eco-friendly material development. These include:

  • Georgia-Pacific (AI-driven fiberboard design for improved box stacking strength and sustainability compliance)
  • Pratt Industries (Recycled-content corrugated fiberboard with AI-powered material efficiency monitoring)
  • Rengo Co., Ltd. (High-performance fiberboard for industrial and consumer packaging with AI-assisted durability testing)
  • Nine Dragons Paper Holdings (Recyclable corrugated fiberboard for sustainable packaging and e-commerce shipping)
  • Oji Holdings Corporation (Innovative fiberboard materials with AI-optimized moisture resistance and load capacity improvements)

Key Segments Covered

By Flute Type:

  • Flute A
  • Flute B
  • Flute C
  • Combination Flutes
  • Micro Flutes

By Board Type:

  • Single Wall
  • Double Wall
  • Triple Wall

By End Use:

  • Food & Beverages
  • E-commerce
  • Pharmaceuticals
  • Cosmetics & Personal Care
  • Electrical & Electronics
  • Automotive
  • Transportation & Logistics
  • Textile

By Regions Covered:

  • North America
  • Latin America
  • Western Europe
  • Eastern Europe
  • East Asia
  • South Asia Pacific
  • Middle East and Africa

Table of Content

  1. Executive Summary
  2. Industry Introduction, including Taxonomy and Market Definition
  3. Market Trends and Success Factors, including Macro-economic Factors, Market Dynamics, and Recent Industry Developments
  4. Global Market Demand Analysis 2020 to 2024 and Forecast 2025 to 2035, including Historical Analysis and Future Projections
  5. Pricing Analysis
  6. Global Market Analysis 2020 to 2024 and Forecast 2025 to 2035
    • By Flute Type
    • By Board Type
    • By End Use
  7. Global Market Analysis 2020 to 2024 and Forecast 2025 to 2035, By Flute Type
    • Flute A
    • Flute B
    • Flute C
    • Combination Flutes
    • Micro Flutes
  8. Global Market Analysis 2020 to 2024 and Forecast 2025 to 2035, By Board Type
    • Single Wall
    • Double Wall
    • Triple Wall
  9. Global Market Analysis 2020 to 2024 and Forecast 2025 to 2035, By End Use
    • Food & Beverages
    • E-commerce
    • Pharmaceuticals
    • Cosmetics & Personal Care
    • Electrical & Electronics
    • Automotive
    • Transportation & Logistics
    • Textile
  10. Global Market Analysis 2020 to 2024 and Forecast 2025 to 2035, By Region
    • North America
    • Latin America
    • Western Europe
    • Eastern Europe
    • East Asia
    • South Asia Pacific
    • Middle East and Africa
  11. North America Sales Analysis 2020 to 2024 and Forecast 2025 to 2035, by Key Segments and Countries
  12. Latin America Sales Analysis 2020 to 2024 and Forecast 2025 to 2035, by Key Segments and Countries
  13. Western Europe Sales Analysis 2020 to 2024 and Forecast 2025 to 2035, by Key Segments and Countries
  14. Eastern Europe Sales Analysis 2020 to 2024 and Forecast 2025 to 2035, by Key Segments and Countries
  15. East Asia Sales Analysis 2020 to 2024 and Forecast 2025 to 2035, by Key Segments and Countries
  16. South Asia Pacific Sales Analysis 2020 to 2024 and Forecast 2025 to 2035, by Key Segments and Countries
  17. Middle East and Africa Sales Analysis 2020 to 2024 and Forecast 2025 to 2035, by Key Segments and Countries
  18. Sales Forecast 2025 to 2035 by Flute Type, Board Type, and End Use for 30 Countries
  19. Competition Outlook, including Market Structure Analysis, Company Share Analysis by Key Players, and Competition Dashboard
  20. Company Profile
    • Georgia-Pacific
    • W.E. Roberts
    • Stora Enso
    • Nuttall Packaging
    • Oji Holdings Corporation
    • Corrugated Packaging Alliance
    • Fencor Packaging Group Limited
    • Durham Box
    • ABBE CORRUGATED
    • Board24

List of Tables

  • Table 1: Global Market Value (US$ Million) Forecast by Region, 2020 to 2035
  • Table 2: Global Market Volume (Tons) Forecast by Region, 2020 to 2035
  • Table 3: Global Market Value (US$ Million) Forecast by Flute Type, 2020 to 2035
  • Table 4: Global Market Volume (Tons) Forecast by Flute Type, 2020 to 2035
  • Table 5: Global Market Value (US$ Million) Forecast by Board Type, 2020 to 2035
  • Table 6: Global Market Volume (Tons) Forecast by Board Type, 2020 to 2035
  • Table 7: Global Market Value (US$ Million) Forecast by End Use, 2020 to 2035
  • Table 8: Global Market Volume (Tons) Forecast by End Use, 2020 to 2035
  • Table 9: North America Market Value (US$ Million) Forecast by Country, 2020 to 2035
  • Table 10: North America Market Volume (Tons) Forecast by Country, 2020 to 2035
  • Table 11: North America Market Value (US$ Million) Forecast by Flute Type, 2020 to 2035
  • Table 12: North America Market Volume (Tons) Forecast by Flute Type, 2020 to 2035
  • Table 13: North America Market Value (US$ Million) Forecast by Board Type, 2020 to 2035
  • Table 14: North America Market Volume (Tons) Forecast by Board Type, 2020 to 2035
  • Table 15: North America Market Value (US$ Million) Forecast by End Use, 2020 to 2035
  • Table 16: North America Market Volume (Tons) Forecast by End Use, 2020 to 2035
  • Table 17: Latin America Market Value (US$ Million) Forecast by Country, 2020 to 2035
  • Table 18: Latin America Market Volume (Tons) Forecast by Country, 2020 to 2035
  • Table 19: Latin America Market Value (US$ Million) Forecast by Flute Type, 2020 to 2035
  • Table 20: Latin America Market Volume (Tons) Forecast by Flute Type, 2020 to 2035
  • Table 21: Latin America Market Value (US$ Million) Forecast by Board Type, 2020 to 2035
  • Table 22: Latin America Market Volume (Tons) Forecast by Board Type, 2020 to 2035
  • Table 23: Latin America Market Value (US$ Million) Forecast by End Use, 2020 to 2035
  • Table 24: Latin America Market Volume (Tons) Forecast by End Use, 2020 to 2035
  • Table 25: Western Europe Market Value (US$ Million) Forecast by Country, 2020 to 2035
  • Table 26: Western Europe Market Volume (Tons) Forecast by Country, 2020 to 2035
  • Table 27: Western Europe Market Value (US$ Million) Forecast by Flute Type, 2020 to 2035
  • Table 28: Western Europe Market Volume (Tons) Forecast by Flute Type, 2020 to 2035
  • Table 29: Western Europe Market Value (US$ Million) Forecast by Board Type, 2020 to 2035
  • Table 30: Western Europe Market Volume (Tons) Forecast by Board Type, 2020 to 2035
  • Table 31: Western Europe Market Value (US$ Million) Forecast by End Use, 2020 to 2035
  • Table 32: Western Europe Market Volume (Tons) Forecast by End Use, 2020 to 2035
  • Table 33: Eastern Europe Market Value (US$ Million) Forecast by Country, 2020 to 2035
  • Table 34: Eastern Europe Market Volume (Tons) Forecast by Country, 2020 to 2035
  • Table 35: Eastern Europe Market Value (US$ Million) Forecast by Flute Type, 2020 to 2035
  • Table 36: Eastern Europe Market Volume (Tons) Forecast by Flute Type, 2020 to 2035
  • Table 37: Eastern Europe Market Value (US$ Million) Forecast by Board Type, 2020 to 2035
  • Table 38: Eastern Europe Market Volume (Tons) Forecast by Board Type, 2020 to 2035
  • Table 39: Eastern Europe Market Value (US$ Million) Forecast by End Use, 2020 to 2035
  • Table 40: Eastern Europe Market Volume (Tons) Forecast by End Use, 2020 to 2035
  • Table 41: South Asia and Pacific Market Value (US$ Million) Forecast by Country, 2020 to 2035
  • Table 42: South Asia and Pacific Market Volume (Tons) Forecast by Country, 2020 to 2035
  • Table 43: South Asia and Pacific Market Value (US$ Million) Forecast by Flute Type, 2020 to 2035
  • Table 44: South Asia and Pacific Market Volume (Tons) Forecast by Flute Type, 2020 to 2035
  • Table 45: South Asia and Pacific Market Value (US$ Million) Forecast by Board Type, 2020 to 2035
  • Table 46: South Asia and Pacific Market Volume (Tons) Forecast by Board Type, 2020 to 2035
  • Table 47: South Asia and Pacific Market Value (US$ Million) Forecast by End Use, 2020 to 2035
  • Table 48: South Asia and Pacific Market Volume (Tons) Forecast by End Use, 2020 to 2035
  • Table 49: East Asia Market Value (US$ Million) Forecast by Country, 2020 to 2035
  • Table 50: East Asia Market Volume (Tons) Forecast by Country, 2020 to 2035
  • Table 51: East Asia Market Value (US$ Million) Forecast by Flute Type, 2020 to 2035
  • Table 52: East Asia Market Volume (Tons) Forecast by Flute Type, 2020 to 2035
  • Table 53: East Asia Market Value (US$ Million) Forecast by Board Type, 2020 to 2035
  • Table 54: East Asia Market Volume (Tons) Forecast by Board Type, 2020 to 2035
  • Table 55: East Asia Market Value (US$ Million) Forecast by End Use, 2020 to 2035
  • Table 56: East Asia Market Volume (Tons) Forecast by End Use, 2020 to 2035
  • Table 57: Middle East and Africa Market Value (US$ Million) Forecast by Country, 2020 to 2035
  • Table 58: Middle East and Africa Market Volume (Tons) Forecast by Country, 2020 to 2035
  • Table 59: Middle East and Africa Market Value (US$ Million) Forecast by Flute Type, 2020 to 2035
  • Table 60: Middle East and Africa Market Volume (Tons) Forecast by Flute Type, 2020 to 2035
  • Table 61: Middle East and Africa Market Value (US$ Million) Forecast by Board Type, 2020 to 2035
  • Table 62: Middle East and Africa Market Volume (Tons) Forecast by Board Type, 2020 to 2035
  • Table 63: Middle East and Africa Market Value (US$ Million) Forecast by End Use, 2020 to 2035
  • Table 64: Middle East and Africa Market Volume (Tons) Forecast by End Use, 2020 to 2035

List of Figures

  • Figure 1: Global Market Value (US$ Million) by Flute Type, 2025 to 2035
  • Figure 2: Global Market Value (US$ Million) by Board Type, 2025 to 2035
  • Figure 3: Global Market Value (US$ Million) by End Use, 2025 to 2035
  • Figure 4: Global Market Value (US$ Million) by Region, 2025 to 2035
  • Figure 5: Global Market Value (US$ Million) Analysis by Region, 2020 to 2035
  • Figure 6: Global Market Volume (Tons) Analysis by Region, 2020 to 2035
  • Figure 7: Global Market Value Share (%) and BPS Analysis by Region, 2025 to 2035
  • Figure 8: Global Market Y-o-Y Growth (%) Projections by Region, 2025 to 2035
  • Figure 9: Global Market Value (US$ Million) Analysis by Flute Type, 2020 to 2035
  • Figure 10: Global Market Volume (Tons) Analysis by Flute Type, 2020 to 2035
  • Figure 11: Global Market Value Share (%) and BPS Analysis by Flute Type, 2025 to 2035
  • Figure 12: Global Market Y-o-Y Growth (%) Projections by Flute Type, 2025 to 2035
  • Figure 13: Global Market Value (US$ Million) Analysis by Board Type, 2020 to 2035
  • Figure 14: Global Market Volume (Tons) Analysis by Board Type, 2020 to 2035
  • Figure 15: Global Market Value Share (%) and BPS Analysis by Board Type, 2025 to 2035
  • Figure 16: Global Market Y-o-Y Growth (%) Projections by Board Type, 2025 to 2035
  • Figure 17: Global Market Value (US$ Million) Analysis by End Use, 2020 to 2035
  • Figure 18: Global Market Volume (Tons) Analysis by End Use, 2020 to 2035
  • Figure 19: Global Market Value Share (%) and BPS Analysis by End Use, 2025 to 2035
  • Figure 20: Global Market Y-o-Y Growth (%) Projections by End Use, 2025 to 2035
  • Figure 21: Global Market Attractiveness by Flute Type, 2025 to 2035
  • Figure 22: Global Market Attractiveness by Board Type, 2025 to 2035
  • Figure 23: Global Market Attractiveness by End Use, 2025 to 2035
  • Figure 24: Global Market Attractiveness by Region, 2025 to 2035
  • Figure 25: North America Market Value (US$ Million) by Flute Type, 2025 to 2035
  • Figure 26: North America Market Value (US$ Million) by Board Type, 2025 to 2035
  • Figure 27: North America Market Value (US$ Million) by End Use, 2025 to 2035
  • Figure 28: North America Market Value (US$ Million) by Country, 2025 to 2035
  • Figure 29: North America Market Value (US$ Million) Analysis by Country, 2020 to 2035
  • Figure 30: North America Market Volume (Tons) Analysis by Country, 2020 to 2035
  • Figure 31: North America Market Value Share (%) and BPS Analysis by Country, 2025 to 2035
  • Figure 32: North America Market Y-o-Y Growth (%) Projections by Country, 2025 to 2035
  • Figure 33: North America Market Value (US$ Million) Analysis by Flute Type, 2020 to 2035
  • Figure 34: North America Market Volume (Tons) Analysis by Flute Type, 2020 to 2035
  • Figure 35: North America Market Value Share (%) and BPS Analysis by Flute Type, 2025 to 2035
  • Figure 36: North America Market Y-o-Y Growth (%) Projections by Flute Type, 2025 to 2035
  • Figure 37: North America Market Value (US$ Million) Analysis by Board Type, 2020 to 2035
  • Figure 38: North America Market Volume (Tons) Analysis by Board Type, 2020 to 2035
  • Figure 39: North America Market Value Share (%) and BPS Analysis by Board Type, 2025 to 2035
  • Figure 40: North America Market Y-o-Y Growth (%) Projections by Board Type, 2025 to 2035
  • Figure 41: North America Market Value (US$ Million) Analysis by End Use, 2020 to 2035
  • Figure 42: North America Market Volume (Tons) Analysis by End Use, 2020 to 2035
  • Figure 43: North America Market Value Share (%) and BPS Analysis by End Use, 2025 to 2035
  • Figure 44: North America Market Y-o-Y Growth (%) Projections by End Use, 2025 to 2035
  • Figure 45: North America Market Attractiveness by Flute Type, 2025 to 2035
  • Figure 46: North America Market Attractiveness by Board Type, 2025 to 2035
  • Figure 47: North America Market Attractiveness by End Use, 2025 to 2035
  • Figure 48: North America Market Attractiveness by Country, 2025 to 2035
  • Figure 49: Latin America Market Value (US$ Million) by Flute Type, 2025 to 2035
  • Figure 50: Latin America Market Value (US$ Million) by Board Type, 2025 to 2035
  • Figure 51: Latin America Market Value (US$ Million) by End Use, 2025 to 2035
  • Figure 52: Latin America Market Value (US$ Million) by Country, 2025 to 2035
  • Figure 53: Latin America Market Value (US$ Million) Analysis by Country, 2020 to 2035
  • Figure 54: Latin America Market Volume (Tons) Analysis by Country, 2020 to 2035
  • Figure 55: Latin America Market Value Share (%) and BPS Analysis by Country, 2025 to 2035
  • Figure 56: Latin America Market Y-o-Y Growth (%) Projections by Country, 2025 to 2035
  • Figure 57: Latin America Market Value (US$ Million) Analysis by Flute Type, 2020 to 2035
  • Figure 58: Latin America Market Volume (Tons) Analysis by Flute Type, 2020 to 2035
  • Figure 59: Latin America Market Value Share (%) and BPS Analysis by Flute Type, 2025 to 2035
  • Figure 60: Latin America Market Y-o-Y Growth (%) Projections by Flute Type, 2025 to 2035
  • Figure 61: Latin America Market Value (US$ Million) Analysis by Board Type, 2020 to 2035
  • Figure 62: Latin America Market Volume (Tons) Analysis by Board Type, 2020 to 2035
  • Figure 63: Latin America Market Value Share (%) and BPS Analysis by Board Type, 2025 to 2035
  • Figure 64: Latin America Market Y-o-Y Growth (%) Projections by Board Type, 2025 to 2035
  • Figure 65: Latin America Market Value (US$ Million) Analysis by End Use, 2020 to 2035
  • Figure 66: Latin America Market Volume (Tons) Analysis by End Use, 2020 to 2035
  • Figure 67: Latin America Market Value Share (%) and BPS Analysis by End Use, 2025 to 2035
  • Figure 68: Latin America Market Y-o-Y Growth (%) Projections by End Use, 2025 to 2035
  • Figure 69: Latin America Market Attractiveness by Flute Type, 2025 to 2035
  • Figure 70: Latin America Market Attractiveness by Board Type, 2025 to 2035
  • Figure 71: Latin America Market Attractiveness by End Use, 2025 to 2035
  • Figure 72: Latin America Market Attractiveness by Country, 2025 to 2035
  • Figure 73: Western Europe Market Value (US$ Million) by Flute Type, 2025 to 2035
  • Figure 74: Western Europe Market Value (US$ Million) by Board Type, 2025 to 2035
  • Figure 75: Western Europe Market Value (US$ Million) by End Use, 2025 to 2035
  • Figure 76: Western Europe Market Value (US$ Million) by Country, 2025 to 2035
  • Figure 77: Western Europe Market Value (US$ Million) Analysis by Country, 2020 to 2035
  • Figure 78: Western Europe Market Volume (Tons) Analysis by Country, 2020 to 2035
  • Figure 79: Western Europe Market Value Share (%) and BPS Analysis by Country, 2025 to 2035
  • Figure 80: Western Europe Market Y-o-Y Growth (%) Projections by Country, 2025 to 2035
  • Figure 81: Western Europe Market Value (US$ Million) Analysis by Flute Type, 2020 to 2035
  • Figure 82: Western Europe Market Volume (Tons) Analysis by Flute Type, 2020 to 2035
  • Figure 83: Western Europe Market Value Share (%) and BPS Analysis by Flute Type, 2025 to 2035
  • Figure 84: Western Europe Market Y-o-Y Growth (%) Projections by Flute Type, 2025 to 2035
  • Figure 85: Western Europe Market Value (US$ Million) Analysis by Board Type, 2020 to 2035
  • Figure 86: Western Europe Market Volume (Tons) Analysis by Board Type, 2020 to 2035
  • Figure 87: Western Europe Market Value Share (%) and BPS Analysis by Board Type, 2025 to 2035
  • Figure 88: Western Europe Market Y-o-Y Growth (%) Projections by Board Type, 2025 to 2035
  • Figure 89: Western Europe Market Value (US$ Million) Analysis by End Use, 2020 to 2035
  • Figure 90: Western Europe Market Volume (Tons) Analysis by End Use, 2020 to 2035
  • Figure 91: Western Europe Market Value Share (%) and BPS Analysis by End Use, 2025 to 2035
  • Figure 92: Western Europe Market Y-o-Y Growth (%) Projections by End Use, 2025 to 2035
  • Figure 93: Western Europe Market Attractiveness by Flute Type, 2025 to 2035
  • Figure 94: Western Europe Market Attractiveness by Board Type, 2025 to 2035
  • Figure 95: Western Europe Market Attractiveness by End Use, 2025 to 2035
  • Figure 96: Western Europe Market Attractiveness by Country, 2025 to 2035
  • Figure 97: Eastern Europe Market Value (US$ Million) by Flute Type, 2025 to 2035
  • Figure 98: Eastern Europe Market Value (US$ Million) by Board Type, 2025 to 2035
  • Figure 99: Eastern Europe Market Value (US$ Million) by End Use, 2025 to 2035
  • Figure 100: Eastern Europe Market Value (US$ Million) by Country, 2025 to 2035
  • Figure 101: Eastern Europe Market Value (US$ Million) Analysis by Country, 2020 to 2035
  • Figure 102: Eastern Europe Market Volume (Tons) Analysis by Country, 2020 to 2035
  • Figure 103: Eastern Europe Market Value Share (%) and BPS Analysis by Country, 2025 to 2035
  • Figure 104: Eastern Europe Market Y-o-Y Growth (%) Projections by Country, 2025 to 2035
  • Figure 105: Eastern Europe Market Value (US$ Million) Analysis by Flute Type, 2020 to 2035
  • Figure 106: Eastern Europe Market Volume (Tons) Analysis by Flute Type, 2020 to 2035
  • Figure 107: Eastern Europe Market Value Share (%) and BPS Analysis by Flute Type, 2025 to 2035
  • Figure 108: Eastern Europe Market Y-o-Y Growth (%) Projections by Flute Type, 2025 to 2035
  • Figure 109: Eastern Europe Market Value (US$ Million) Analysis by Board Type, 2020 to 2035
  • Figure 110: Eastern Europe Market Volume (Tons) Analysis by Board Type, 2020 to 2035
  • Figure 111: Eastern Europe Market Value Share (%) and BPS Analysis by Board Type, 2025 to 2035
  • Figure 112: Eastern Europe Market Y-o-Y Growth (%) Projections by Board Type, 2025 to 2035
  • Figure 113: Eastern Europe Market Value (US$ Million) Analysis by End Use, 2020 to 2035
  • Figure 114: Eastern Europe Market Volume (Tons) Analysis by End Use, 2020 to 2035
  • Figure 115: Eastern Europe Market Value Share (%) and BPS Analysis by End Use, 2025 to 2035
  • Figure 116: Eastern Europe Market Y-o-Y Growth (%) Projections by End Use, 2025 to 2035
  • Figure 117: Eastern Europe Market Attractiveness by Flute Type, 2025 to 2035
  • Figure 118: Eastern Europe Market Attractiveness by Board Type, 2025 to 2035
  • Figure 119: Eastern Europe Market Attractiveness by End Use, 2025 to 2035
  • Figure 120: Eastern Europe Market Attractiveness by Country, 2025 to 2035
  • Figure 121: South Asia and Pacific Market Value (US$ Million) by Flute Type, 2025 to 2035
  • Figure 122: South Asia and Pacific Market Value (US$ Million) by Board Type, 2025 to 2035
  • Figure 123: South Asia and Pacific Market Value (US$ Million) by End Use, 2025 to 2035
  • Figure 124: South Asia and Pacific Market Value (US$ Million) by Country, 2025 to 2035
  • Figure 125: South Asia and Pacific Market Value (US$ Million) Analysis by Country, 2020 to 2035
  • Figure 126: South Asia and Pacific Market Volume (Tons) Analysis by Country, 2020 to 2035
  • Figure 127: South Asia and Pacific Market Value Share (%) and BPS Analysis by Country, 2025 to 2035
  • Figure 128: South Asia and Pacific Market Y-o-Y Growth (%) Projections by Country, 2025 to 2035
  • Figure 129: South Asia and Pacific Market Value (US$ Million) Analysis by Flute Type, 2020 to 2035
  • Figure 130: South Asia and Pacific Market Volume (Tons) Analysis by Flute Type, 2020 to 2035
  • Figure 131: South Asia and Pacific Market Value Share (%) and BPS Analysis by Flute Type, 2025 to 2035
  • Figure 132: South Asia and Pacific Market Y-o-Y Growth (%) Projections by Flute Type, 2025 to 2035
  • Figure 133: South Asia and Pacific Market Value (US$ Million) Analysis by Board Type, 2020 to 2035
  • Figure 134: South Asia and Pacific Market Volume (Tons) Analysis by Board Type, 2020 to 2035
  • Figure 135: South Asia and Pacific Market Value Share (%) and BPS Analysis by Board Type, 2025 to 2035
  • Figure 136: South Asia and Pacific Market Y-o-Y Growth (%) Projections by Board Type, 2025 to 2035
  • Figure 137: South Asia and Pacific Market Value (US$ Million) Analysis by End Use, 2020 to 2035
  • Figure 138: South Asia and Pacific Market Volume (Tons) Analysis by End Use, 2020 to 2035
  • Figure 139: South Asia and Pacific Market Value Share (%) and BPS Analysis by End Use, 2025 to 2035
  • Figure 140: South Asia and Pacific Market Y-o-Y Growth (%) Projections by End Use, 2025 to 2035
  • Figure 141: South Asia and Pacific Market Attractiveness by Flute Type, 2025 to 2035
  • Figure 142: South Asia and Pacific Market Attractiveness by Board Type, 2025 to 2035
  • Figure 143: South Asia and Pacific Market Attractiveness by End Use, 2025 to 2035
  • Figure 144: South Asia and Pacific Market Attractiveness by Country, 2025 to 2035
  • Figure 145: East Asia Market Value (US$ Million) by Flute Type, 2025 to 2035
  • Figure 146: East Asia Market Value (US$ Million) by Board Type, 2025 to 2035
  • Figure 147: East Asia Market Value (US$ Million) by End Use, 2025 to 2035
  • Figure 148: East Asia Market Value (US$ Million) by Country, 2025 to 2035
  • Figure 149: East Asia Market Value (US$ Million) Analysis by Country, 2020 to 2035
  • Figure 150: East Asia Market Volume (Tons) Analysis by Country, 2020 to 2035
  • Figure 151: East Asia Market Value Share (%) and BPS Analysis by Country, 2025 to 2035
  • Figure 152: East Asia Market Y-o-Y Growth (%) Projections by Country, 2025 to 2035
  • Figure 153: East Asia Market Value (US$ Million) Analysis by Flute Type, 2020 to 2035
  • Figure 154: East Asia Market Volume (Tons) Analysis by Flute Type, 2020 to 2035
  • Figure 155: East Asia Market Value Share (%) and BPS Analysis by Flute Type, 2025 to 2035
  • Figure 156: East Asia Market Y-o-Y Growth (%) Projections by Flute Type, 2025 to 2035
  • Figure 157: East Asia Market Value (US$ Million) Analysis by Board Type, 2020 to 2035
  • Figure 158: East Asia Market Volume (Tons) Analysis by Board Type, 2020 to 2035
  • Figure 159: East Asia Market Value Share (%) and BPS Analysis by Board Type, 2025 to 2035
  • Figure 160: East Asia Market Y-o-Y Growth (%) Projections by Board Type, 2025 to 2035
  • Figure 161: East Asia Market Value (US$ Million) Analysis by End Use, 2020 to 2035
  • Figure 162: East Asia Market Volume (Tons) Analysis by End Use, 2020 to 2035
  • Figure 163: East Asia Market Value Share (%) and BPS Analysis by End Use, 2025 to 2035
  • Figure 164: East Asia Market Y-o-Y Growth (%) Projections by End Use, 2025 to 2035
  • Figure 165: East Asia Market Attractiveness by Flute Type, 2025 to 2035
  • Figure 166: East Asia Market Attractiveness by Board Type, 2025 to 2035
  • Figure 167: East Asia Market Attractiveness by End Use, 2025 to 2035
  • Figure 168: East Asia Market Attractiveness by Country, 2025 to 2035
  • Figure 169: Middle East and Africa Market Value (US$ Million) by Flute Type, 2025 to 2035
  • Figure 170: Middle East and Africa Market Value (US$ Million) by Board Type, 2025 to 2035
  • Figure 171: Middle East and Africa Market Value (US$ Million) by End Use, 2025 to 2035
  • Figure 172: Middle East and Africa Market Value (US$ Million) by Country, 2025 to 2035
  • Figure 173: Middle East and Africa Market Value (US$ Million) Analysis by Country, 2020 to 2035
  • Figure 174: Middle East and Africa Market Volume (Tons) Analysis by Country, 2020 to 2035
  • Figure 175: Middle East and Africa Market Value Share (%) and BPS Analysis by Country, 2025 to 2035
  • Figure 176: Middle East and Africa Market Y-o-Y Growth (%) Projections by Country, 2025 to 2035
  • Figure 177: Middle East and Africa Market Value (US$ Million) Analysis by Flute Type, 2020 to 2035
  • Figure 178: Middle East and Africa Market Volume (Tons) Analysis by Flute Type, 2020 to 2035
  • Figure 179: Middle East and Africa Market Value Share (%) and BPS Analysis by Flute Type, 2025 to 2035
  • Figure 180: Middle East and Africa Market Y-o-Y Growth (%) Projections by Flute Type, 2025 to 2035
  • Figure 181: Middle East and Africa Market Value (US$ Million) Analysis by Board Type, 2020 to 2035
  • Figure 182: Middle East and Africa Market Volume (Tons) Analysis by Board Type, 2020 to 2035
  • Figure 183: Middle East and Africa Market Value Share (%) and BPS Analysis by Board Type, 2025 to 2035
  • Figure 184: Middle East and Africa Market Y-o-Y Growth (%) Projections by Board Type, 2025 to 2035
  • Figure 185: Middle East and Africa Market Value (US$ Million) Analysis by End Use, 2020 to 2035
  • Figure 186: Middle East and Africa Market Volume (Tons) Analysis by End Use, 2020 to 2035
  • Figure 187: Middle East and Africa Market Value Share (%) and BPS Analysis by End Use, 2025 to 2035
  • Figure 188: Middle East and Africa Market Y-o-Y Growth (%) Projections by End Use, 2025 to 2035
  • Figure 189: Middle East and Africa Market Attractiveness by Flute Type, 2025 to 2035
  • Figure 190: Middle East and Africa Market Attractiveness by Board Type, 2025 to 2035
  • Figure 191: Middle East and Africa Market Attractiveness by End Use, 2025 to 2035
  • Figure 192: Middle East and Africa Market Attractiveness by Country, 2025 to 2035

Frequently Asked Questions

What was the overall size of the corrugated fiberboard market 2025?

The overall market size for corrugated fiberboard market was USD 118.8 billion in 2025.

How big the Bio is based corrugated fiberboard market expected in 2035?

Corrugated fiberboard market is expected to reach USD 201.0 billion in 2035.

What will drive the demand for corrugated fiberboard market during the forecast period?

The demand for corrugated fiberboard is expected to rise due to increasing e-commerce activities, growing demand for sustainable and recyclable packaging solutions, and expanding applications in food, electronics, and consumer goods packaging.

List the top 5 countries contributing in corrugated fiberboard market?

The top 5 countries which drives the development of corrugated fiberboard market are USA, UK, Europe Union, Japan and South Korea.

Which segment in type is expected to lead in corrugated fiberboard market?

Flute C and Double Wall Fiberboards to command significant share over the assessment period.

Explore Similar Insights

Future Market Insights

Corrugated Fiberboard Market