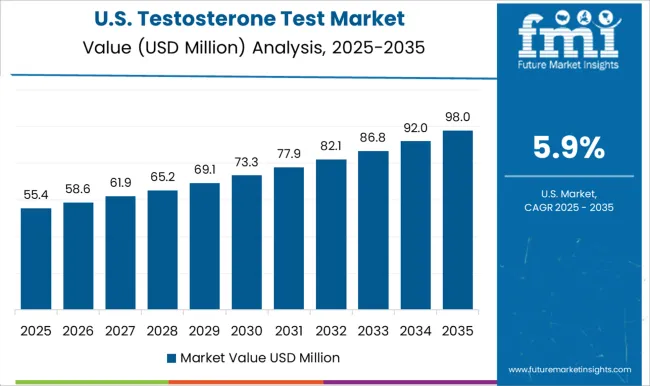
Testosterone Test Market Size and Share Forecast Outlook (2024 to 2034)

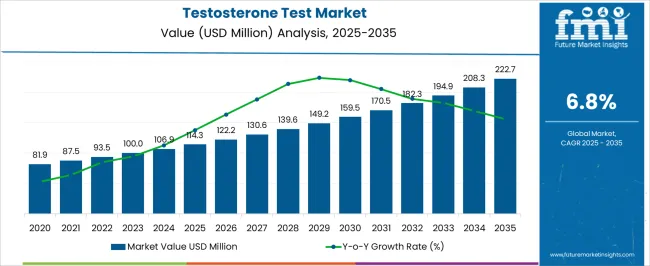
The global testosterone test market recorded a market valuation of USD 100.0 million in 2023 and is expected to expand at a CAGR rate of 6.9% to reach a valuation of USD 208.1 million by 2034. North America is leading the market with a share of about 32.4% within the global market.

The operation of male sexual organs and their regular growth depend on the levels of the hormone testosterone. It regulates sex drive, preserves muscular mass, and aids in sperm production in adult men. Testosterone is also found in females in a very small amount in the ovaries. Also, it is produced by the adrenal glands in both males and females.

In the testosterone test, the blood testosterone levels are measured. Most of the testosterone in the blood is protein-bound. The testosterone that is unattached to a protein is called free testosterone. First, the total testosterone test, which measures both attached and free testosterone, is one of the two primary testosterone assays. The second test solely measures free testosterone, and the free testosterone test can reveal more information about some medical issues. In both men and women, low or excessive testosterone levels can cause health problems.

Key Attributes Market Insights
Testosterone Test Market Value, 2023 USD 100.0 million
Estimated Market Value 2024 USD 106.6 million
Projected Market Value 2034 USD 208.1 million
CAGR (2024 to 2034) 6.9%
Market Share of Top 5 Countries 58.5%
Key Market Players Medical EXPO, Abbexa, Imaware, LetsGetChecked, Everlywell, Boditech, myLAB Box, Verisana, Ro, Cerascreen, MediChecks, Genway Biotech, Hone Health, Humankind Ventures Ltd., Diagnostic Automation/Cortez Diagnostics Inc., Myclinic.ie, Healthy Human Labs Ltd., MyBioSource, Bluecrest Wellness and Testochecker

Sales Analysis of Testosterone Tests vs Future Demand Outlook

In 2023, the market for testosterone tests represented around 22.5% of the total global fertility testing market.

The market for testosterone tests has grown at a CAGR of 5.1% from 2019 to 2023, driven by an increase in demand due to rising rates of infertility, erectile dysfunction, testicular cancer, and delayed puberty.

Historical Market Value, 2023 USD 100.0 million
HCAGR, 2019 to 2033 5.1%

The testosterone tests are performed using blood, saliva, and urine. The testing kits are not only used for testosterone but are now developed by combining several other hormone tests. Thus, advancements in the kit made it possible to diagnose the disease with one kit. Also, the results obtained are much easier to read and understand. The customization of the results based on age is also provided by the companies. The samples taken are pain-free and are easy to collect.

Few of the companies provide video instructions for every step to be performed, which make it easy for the patients to use and they are also provided with live support access. Also, the patients are provided with personalized medical advice with results.

The improper balance of testosterone levels in the body can lead to testicular cancer. Also in females, high levels of testosterone are proven to be the reason for developing conditions like polycystic ovarian syndrome (PCOS). The rising number of PCOS in females has also added to the growth of the testosterone test market.

Hence, owing to the factors mentioned above, the global testosterone test market is projected to grow at a CAGR of 6.9% from 2023 to 2033.

Key Opportunities Accelerating the Testosterone Test Industry

There is a growing awareness regarding the importance of testosterone levels in various health conditions, including hypogonadism, infertility, and sexual dysfunction. This awareness has led to an increased demand for testosterone testing, driving market growth.

Male infertility is a significant concern worldwide, and testosterone testing is an essential component of the diagnostic process. With the increasing prevalence of male infertility, the demand for testosterone tests is expected to rise, presenting growth prospects for the market. Also, several other factors like testicular cancer, delayed puberty, increasing infertility, and low testosterone levels are expected to drive the demand for testosterone test kits over the forecast period.

The testosterone test market has significant growth potential in emerging and developing economies. Factors such as increasing healthcare expenditure, improving healthcare infrastructure, and rising awareness about hormonal disorders contribute to the market's expansion in these regions.

Key Restraints Impacting Demand for Testosterone Testing

The unawareness among the population regarding the availability of these test kits and also, the lack of knowledge about using the kits is a key factor that affects the growth of the market.

Testosterone tests can be expensive, especially when advanced technologies and specialized equipment are involved. The cost factor can limit access to testing for individuals with limited financial resources, impacting market growth. The cost of kits used for testosterone tests is comparatively higher than the laboratory testing. This makes it unconventional to use in developing and underdeveloped countries.

Testosterone tests are performed with blood or saliva. The tests using saliva as the sample in the test kit are still questioned regarding the accuracy of the results. The market's growth throughout the forecast period may be impacted by all of the above-mentioned variables.

Analysis of Top Countries Performing and Certifying Testosterone Tests

Countries CAGR (2024 to 2034)
United States 6.4%
Germany 3.9%
India 7.0%
United Kingdom 6.7%

Testosterone Test Market in the United States

Accounting for a market share of 89.9%, the United States is leading the market in North America.

Infertility is a key concern and a common problem in males. Infertility in males is rising in the United States. Infertility issues in men are increasing this market in this region.

Testosterone imbalances, such as hypogonadism, are becoming more prevalent in the United States population. Factors such as sedentary lifestyles, obesity, stress, and aging contribute to the rising incidence of these conditions. The need for diagnosing and monitoring testosterone levels drives the demand for testosterone tests.

Testosterone Test Market in India

The Indian market for testosterone tests hold a share of 50.0% of the South Asian market.

Erectile dysfunction is a common complication observed in India. Erectile dysfunction is observed to be common among type 2 diabetes patients. Also, other factors are adding to the erectile dysfunction in males. Thus, it is expected to increase the market for testosterone tests.

Testosterone Test Market in the United Kingdom

The United Kingdom is expected to rise at a CAGR of 6.7% over the forecast period.

Low levels of testosterone cause testicular cancer, increasing the demand for testosterone testing in the country. Similar to other developed countries, the United Kingdom is witnessing a rise in the prevalence of testosterone-related disorders such as hypogonadism.

Lifestyle factors, the aging population, and other health conditions contribute to the increased incidence of testosterone imbalances. This drives the demand for testosterone tests for diagnosis and monitoring.
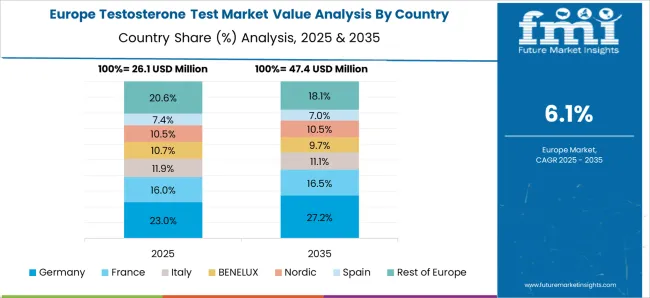
Testosterone Test Market in Germany

Germany held a significant share of 27.1% of the Europe testosterone test market.

The increasing healthcare expenditure and the rise in disposable income are the main reasons for boosting the market growth of testosterone tests in Germany. Other than this, the rise in awareness about the importance of testosterone for overall health and well-being is also fuelling market growth. This has led to an increased demand for testosterone tests among men of all age groups.

Testosterone Test Industry Analysis by Top Investment Segments

Use of Blood Sample for Testing Testosterone Levels

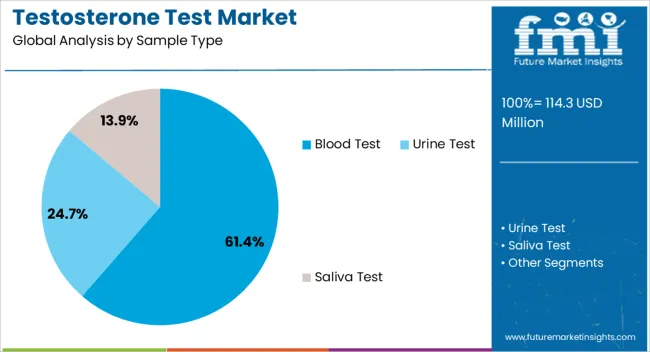
The blood sample for testosterone tests had a prominent market share of 45.2% in 2024. The segment is anticipated to grow at a CAGR of 7.0% during the forecast period.

Top Sample Type Blood Sample
Market Share in 2024 45.2%

Blood samples are commonly used samples for testing any kind of hormone. The blood samples are considered to give accurate results as compared to any other samples. The reliability of the results makes it the most used and preferred sample for testosterone testing.

Higher Demand for Testosterone Test in Males

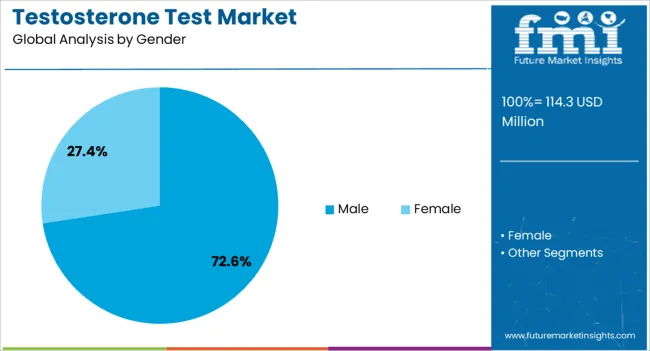
Males are the ones who are undergoing testosterone tests in a large number accounting for 84.5% market share.

Top Gender Males
Market Share in 2024 84.5%

Testosterone plays an important role in males. The deficiency or rise in the levels of testosterone causes many problems in males which makes it necessary to have a record of the testosterone levels. As males are mostly affected by the levels of testosterone, therefore they hold a significant market share of this market.

Higher Availability of Testosterone Test Kits for Home Care Settings

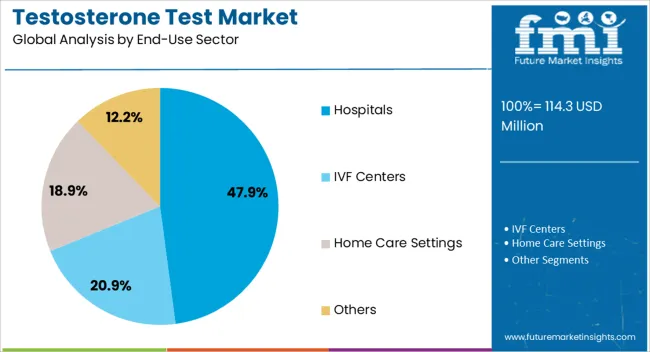
Top End-use Sector Home Care Settings
Market Share in 2024 40.2%

The home care settings segment accounted for a prominent market share of 40.2%.

The increasing availability of test kits for home care settings and the ease of collecting the sample also the easy availability of the results provided by the manufacturers is boosting the market for home care settings.
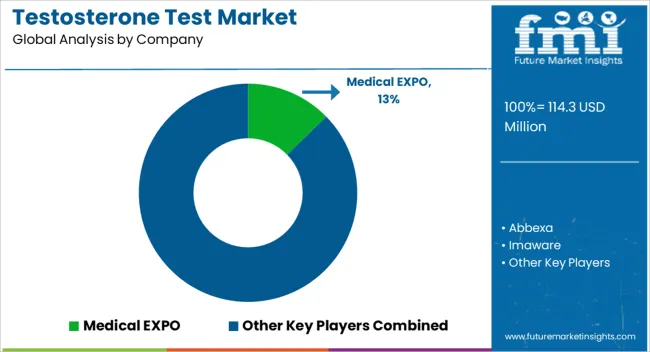
Competitive Landscape of the Testosterone Test Market

To gain a presence in the market, the leading testosterone test businesses are primarily focusing on increasing their market share and kit supply. Leading producers like LetsGetChecked and Everlywell employ tactical strategies like collaboration and expansion to increase the supply of testosterone test kits.

  • Leading provider of healthcare solutions LetsGetChecked announced in June 2022 the debut of its pharmacy and drug delivery service, bringing in a full lifecycle of individualized 360° healthcare at home. The solution strengthens the company's commitment to enhancing customer care access, health plans, enterprise clients and the public sector. It also expands the brand's vertically integrated healthcare platform.
  • With the acquisition of PWNHealth and Home Access Health Corporation, Everlywell, a prominent digital health provider, created its own parent company, Everly Health in March 2021. With a firm commitment to data protection and clinician independence, the acquisition will allow the companies to scale their offerings. PWNHealth will operate as a separate Everly Health company under the new name Everly Health Solutions. Everly Health Solutions will continue to be independent of Everlywell in terms of data.

Leading Players in the Global Testosterone Test Industry

  • Medical EXPO
  • Abbexa
  • Imaware
  • LetsGetChecked
  • Everlywell
  • Boditech
  • myLAB Box
  • Verisana
  • Cerascreen
  • MediChecks
  • Genway Biotech
  • Hone Health
  • Humankind Ventures Ltd.
  • Diagnostic Automation/Cortez Diagnostics Inc.
  • Myclinic.ie
  • Healthy Human Labs Ltd.
  • MyBioSource
  • Bluecrest Wellness

Scope and Coverage of the Testosterone Test Industry Report

Attribute Details
Forecast Period 2024 to 2034
Historical Data Available for 2019 to 2033
Market Analysis USD Million for Value
Key Regions Covered North America; Latin America; Europe; South Asia; East Asia; Oceania; and Middle East & Africa (MEA)
Key Countries Covered USA, Canada, Brazil, Mexico, Argentina, UK, Germany, Italy, Russia, Spain, France, BENELUX, India, Thailand, Indonesia, Malaysia, Japan, China, South Korea, Australia, New Zealand, Türkiye, GCC Countries, South Africa and North Africa
Key Market Segments Covered Sample type, Gender, End User, and Region
Key Companies Profiled Abbexa; Imaware; LetsGetChecked; Everlywell; Boditech; myLAB Box; Verisana; Cerascreen; MediChecks; Genway Biotech; Hone Health; Humankind Ventures Ltd.; Diagnostic Automation/Cortez Diagnostics Inc.; Myclinic.ie; Healthy Human Labs Ltd.; MyBioSource; Bluecrest Wellness; Testochecker
Pricing Available upon Request

Top Segments Studied in the Testosterone Test Market

By Sample type:

  • Blood test
  • Urine test
  • Saliva test

By Gender:

  • Male
  • Female

By End-use Sector:

  • Hospitals
  • IVF Centers
  • Home Care Settings
  • Others

By Region:

  • North America
  • Latin America
  • Europe
  • South Asia
  • East Asia
  • Oceania
  • Middle East and Africa (MEA)

Table of Content

  • 1. Executive Summary
  • 2. Market Overview
  • 3. Market Trends & Dynamics
  • 4. Value-Added Insights
  • 5. Market Background
  • 6. Global Market Demand Volume (Units) Analysis 2012 to 2022 and Forecast, 2023 to 2033
  • 7. Global Market - Pricing Analysis
  • 8. Global Market Demand (in Value or Size in USD Million) Analysis 2012 to 2022 and Forecast, 2023 to 2033
  • 9. Global Market Analysis 2012 to 2022 and Forecast 2023 to 2033, by Sample Type
    • 9.1. Blood
    • 9.2. Urine
    • 9.3. Saliva
  • 10. Global Market Analysis 2012 to 2022 and Forecast 2023 to 2033, By Gender
    • 10.1. Male
    • 10.2. Female
  • 11. Global Market Analysis 2012 to 2022 and Forecast 2023 to 2033, by End User
    • 11.1. Hospitals
    • 11.2. IVF Centers
    • 11.3. Home Care settings
    • 11.4. Others
  • 12. Global Market Analysis 2012 to 2022 and Forecast 2023 to 2033, by Region
    • 12.1. North America
    • 12.2. Latin America
    • 12.3. Europe
    • 12.4. South Asia
    • 12.5. East Asia
    • 12.6. Oceania
    • 12.7. Middle East & Africa (MEA)
  • 13. North America Market Analysis 2012 to 2022 and Forecast 2023 to 2033
  • 14. Latin America Market Analysis 2012 to 2022 and Forecast 2023 to 2033
  • 15. Europe Market Analysis 2012 to 2022 and Forecast 2023 to 2033
  • 16. East Asia Market Analysis 2012 to 2022 and Forecast 2023 to 2033
  • 17. South Asia Market Analysis 2012 to 2022 and Forecast 2023 to 2033
  • 18. Oceania Market Analysis 2012 to 2022 and Forecast 2023 to 2033
  • 19. Middle East & Africa Market Analysis 2012 to 2022 and Forecast 2023 to 2033
  • 20. Market Structure Analysis
  • 21. Competition Analysis
    • 21.1. Abbexa
    • 21.2. Imaware
    • 21.3. LetsGetChecked
    • 21.4. Everlywell
    • 21.5. Boditech
    • 21.6. myLAB Box
    • 21.7. Verisana
    • 21.8. Cerascreen
    • 21.9. MediChecks
    • 21.10. Genway Biotech
    • 21.11. Hone Health
    • 21.12. Humankind Ventures Ltd.
    • 21.13. Diagnostic Automation/Cortez Diagnostics Inc.
    • 21.14. Myclinic.ie
    • 21.15. Healthy Human Labs Ltd.
    • 21.16. MyBioSource
    • 21.17. Bluecrest Wellness
    • 21.18. Testochecker
  • 22. Assumptions and Acronyms Used
  • 23. Research Methodology

List of Tables

Table 01: Global Market Value (US$ Million) Analysis and Forecast 2012 to 2033, by Sample Type

Table 02: Global Market Volume (Units) Analysis and Forecast 2012 to 2033, by Sample Type

Table 03: Global Market Value (US$ Million) Analysis and Forecast 2012 to 2033, by Gender

Table 04: Global Market Value (US$ Million) Analysis and Forecast 2012 to 2033, by End User

Table 05: Global Market Value (US$ Million) Analysis and Forecast 2012 to 2033, by Region

Table 06: North America Market Value (US$ Million) Analysis 2012 to 2022 and Forecast 2023 to 2033, by Country

Table 07: North America Market Value (US$ Million) Analysis and Forecast 2012 to 2033, by Sample Type

Table 08: North America Market Volume (Units) Analysis and Forecast 2012 to 2033, by Sample Type

Table 09: North America Market Value (US$ Million) Analysis and Forecast 2012 to 2033, by Gender

Table 10: North America Market Value (US$ Million) Analysis and Forecast 2012 to 2033, by End User

Table 11: Latin America Market Value (US$ Million) Analysis 2012 to 2022 and Forecast 2023 to 2033, by Country

Table 12: Latin America Market Value (US$ Million) Analysis and Forecast 2012 to 2033, by Sample Type

Table 13: Latin America Market Volume (Units) Analysis and Forecast 2012 to 2033, by Sample Type

Table 14: Latin America Market Value (US$ Million) Analysis and Forecast 2012 to 2033, by Gender

Table 15: Latin America Market Value (US$ Million) Analysis and Forecast 2012 to 2033, by End User

Table 16: Europe Market Value (US$ Million) Analysis 2012 to 2022 and Forecast 2023 to 2033, by Country

Table 17: Europe Market Value (US$ Million) Analysis and Forecast 2012 to 2033, by Sample Type

Table 18: Europe Market Volume (Units) Analysis and Forecast 2012 to 2033, by Sample Type

Table 19: Europe Market Value (US$ Million) Analysis and Forecast 2012 to 2033, by Gender

Table 20: Europe Market Value (US$ Million) Analysis and Forecast 2012 to 2033, by End User

Table 21: East Asia Market Value (US$ Million) Analysis 2012 to 2022 and Forecast 2023 to 2033, by Country

Table 22: East Asia Market Value (US$ Million) Analysis and Forecast 2012 to 2033, by Sample Type

Table 23: East Asia Market Volume (Units) Analysis and Forecast 2012 to 2033, by Sample Type

Table 24: East Asia Market Value (US$ Million) Analysis and Forecast 2012 to 2033, by Gender

Table 25: East Asia Market Value (US$ Million) Analysis and Forecast 2012 to 2033, by End User

Table 26: South Asia Market Value (US$ Million) Analysis 2012 to 2022 and Forecast 2023 to 2033, by Country

Table 27: South Asia Market Value (US$ Million) Analysis and Forecast 2012 to 2033, by Sample Type

Table 28: South Asia Market Volume (Units) Analysis and Forecast 2012 to 2033, by Sample Type

Table 29: South Asia Market Value (US$ Million) Analysis and Forecast 2012 to 2033, by Gender

Table 30: South Asia Market Value (US$ Million) Analysis and Forecast 2012 to 2033, by End User

Table 31: Oceania Market Value (US$ Million) Analysis 2012 to 2022 and Forecast 2023 to 2033, by Country

Table 32: Oceania Market Value (US$ Million) Analysis and Forecast 2012 to 2033, by Sample Type

Table 33: Oceania Market Volume (Units) Analysis and Forecast 2012 to 2033, by Sample Type

Table 34: Oceania Market Value (US$ Million) Analysis and Forecast 2012 to 2033, by Gender

Table 35: Oceania Market Value (US$ Million) Analysis and Forecast 2012 to 2033, by End User

Table 36: MEA Market Value (US$ Million) Analysis 2012 to 2022 and Forecast 2023 to 2033, by Country

Table 37: MEA Market Value (US$ Million) Analysis and Forecast 2012 to 2033, by Sample Type

Table 38: MEA Market Volume (Units) Analysis and Forecast 2012 to 2033, by Sample Type

Table 39: MEA Market Value (US$ Million) Analysis and Forecast 2012 to 2033, by Gender

Table 40: MEA Market Value (US$ Million) Analysis and Forecast 2012 to 2033, by End User

List of Figures

Figure 01: Global Market Volume (Units), 2012 to 2022

Figure 02: Global Market Volume (Units) & Y-o-Y Growth (%) Analysis, 2023 to 2033

Figure 03: Pricing Analysis per unit (US$), in 2023

Figure 04: Pricing Forecast per unit (US$), in 2033

Figure 05: Global Market Value (US$ Million) Analysis, 2012 to 2022

Figure 06: Global Market Forecast & Y-o-Y Growth, 2023 to 2033

Figure 07: Global Market Absolute $ Opportunity (US$ Million) Analysis, 2022 to 2033

Figure 08: Global Market Value Share (%) Analysis 2023 to 2033, by Sample Type

Figure 09: Global Market Y-o-Y Growth (%) Analysis 2022 to 2033, by Sample Type

Figure 10: Global Market Attractiveness Analysis 2023 to 2033, by Sample Type

Figure 11: Global Market Value Share (%) Analysis 2023 to 2033, by Gender

Figure 12: Global Market Y-o-Y Growth (%) Analysis 2022 to 2033, by Gender

Figure 13: Global Market Attractiveness Analysis 2023 to 2033, by Gender

Figure 14: Global Market Value Share (%) Analysis 2023 to 2033, by End User

Figure 15: Global Market Y-o-Y Growth (%) Analysis 2022 to 2033, by End User

Figure 16: Global Market Attractiveness Analysis 2023 to 2033, by End User

Figure 17: Global Market Value Share (%) Analysis 2023 to 2033, by Region

Figure 18: Global Market Y-o-Y Growth (%) Analysis 2022 to 2033, by Region

Figure 19: Global Market Attractiveness Analysis 2023 to 2033, by Region

Figure 20: North America Market Value (US$ Million) Analysis, 2012 to 2022

Figure 21: North America Market Value (US$ Million) Forecast, 2023 to 2033

Figure 22: North America Market Value Share, by Sample Type (2023 E)

Figure 23: North America Market Value Share, by Gender (2023 E)

Figure 24: North America Market Value Share, by End User (2023 E)

Figure 25: North America Market Value Share, by Country (2023 E)

Figure 26: North America Market Attractiveness Analysis by Sample Type, 2023 to 2033

Figure 27: North America Market Attractiveness Analysis by Gender, 2023 to 2033

Figure 28: North America Market Attractiveness Analysis by End User, 2023 to 2033

Figure 29: North America Market Attractiveness Analysis by Country, 2023 to 2033

Figure 30: USA Market Value Proportion Analysis, 2022

Figure 31: Global Vs. USA Growth Comparison

Figure 32: USA Market Share Analysis (%) by Sample Type, 2022 to 2033

Figure 33: USA Market Share Analysis (%) by Gender, 2022 to 2033

Figure 34: USA Market Share Analysis (%) by End User, 2022 to 2033

Figure 35: Canada Market Value Proportion Analysis, 2022

Figure 36: Global Vs. Canada. Growth Comparison

Figure 37: Canada Market Share Analysis (%) by Sample Type, 2022 to 2033

Figure 38: Canada Market Share Analysis (%) by Gender, 2022 to 2033

Figure 39: Canada Market Share Analysis (%) by End User, 2022 to 2033

Figure 40: Latin America Market Value (US$ Million) Analysis, 2012 to 2022

Figure 41: Latin America Market Value (US$ Million) Forecast, 2023 to 2033

Figure 42: Latin America Market Value Share, by Sample Type (2023 E)

Figure 43: Latin America Market Value Share, by Gender (2023 E)

Figure 44: Latin America Market Value Share, by End User (2023 E)

Figure 45: Latin America Market Value Share, by Country (2023 E)

Figure 46: Latin America Market Attractiveness Analysis by Sample Type, 2023 to 2033

Figure 47: Latin America Market Attractiveness Analysis by Gender, 2023 to 2033

Figure 48: Latin America Market Attractiveness Analysis by End User, 2023 to 2033

Figure 49: Latin America Market Attractiveness Analysis by Country, 2023 to 2033

Figure 50: Mexico Market Value Proportion Analysis, 2022

Figure 51: Global Vs Mexico Growth Comparison

Figure 52: Mexico Market Share Analysis (%) by Sample Type, 2022 to 2033

Figure 53: Mexico Market Share Analysis (%) by Gender, 2022 to 2033

Figure 54: Mexico Market Share Analysis (%) by End User, 2022 to 2033

Figure 55: Brazil Market Value Proportion Analysis, 2022

Figure 56: Global Vs. Brazil. Growth Comparison

Figure 57: Brazil Market Share Analysis (%) by Sample Type, 2022 to 2033

Figure 58: Brazil Market Share Analysis (%) by Gender, 2022 to 2033

Figure 59: Brazil Market Share Analysis (%) by End User, 2022 to 2033

Figure 60: Argentina Market Value Proportion Analysis, 2022

Figure 61: Global Vs Argentina Growth Comparison

Figure 62: Argentina Market Share Analysis (%) by Sample Type, 2022 to 2033

Figure 63: Argentina Market Share Analysis (%) by Gender, 2022 to 2033

Figure 64: Argentina Market Share Analysis (%) by End User, 2022 to 2033

Figure 65: Europe Market Value (US$ Million) Analysis, 2012 to 2022

Figure 66: Europe Market Value (US$ Million) Forecast, 2023 to 2033

Figure 67: Europe Market Value Share, by Sample Type (2023 E)

Figure 68: Europe Market Value Share, by Gender (2023 E)

Figure 69: Europe Market Value Share, by End User (2023 E)

Figure 70: Europe Market Value Share, by Country (2023 E)

Figure 71: Europe Market Attractiveness Analysis by Sample Type, 2023 to 2033

Figure 72: Europe Market Attractiveness Analysis by Gender, 2023 to 2033

Figure 73: Europe Market Attractiveness Analysis by End User, 2023 to 2033

Figure 74: Europe Market Attractiveness Analysis by Country, 2023 to 2033

Figure 75: UK Market Value Proportion Analysis, 2022

Figure 76: Global Vs. UK Growth Comparison

Figure 77: UK Market Share Analysis (%) by Sample Type, 2022 to 2033

Figure 78: UK Market Share Analysis (%) by Gender, 2022 to 2033

Figure 79: UK Market Share Analysis (%) by End User, 2022 to 2033

Figure 80: Germany Market Value Proportion Analysis, 2022

Figure 81: Global Vs. Germany Growth Comparison

Figure 82: Germany Market Share Analysis (%) by Sample Type, 2022 to 2033

Figure 83: Germany Market Share Analysis (%) by Gender, 2022 to 2033

Figure 84: Germany Market Share Analysis (%) by End User, 2022 to 2033

Figure 85: Italy Market Value Proportion Analysis, 2022

Figure 86: Global Vs. Italy Growth Comparison

Figure 87: Italy Market Share Analysis (%) by Sample Type, 2022 to 2033

Figure 88: Italy Market Share Analysis (%) by Gender, 2022 to 2033

Figure 89: Italy Market Share Analysis (%) by End User, 2022 to 2033

Figure 90: France Market Value Proportion Analysis, 2022

Figure 91: Global Vs France Growth Comparison

Figure 92: France Market Share Analysis (%) by Sample Type, 2022 to 2033

Figure 93: France Market Share Analysis (%) by Gender, 2022 to 2033

Figure 94: France Market Share Analysis (%) by End User, 2022 to 2033

Figure 95: Spain Market Value Proportion Analysis, 2022

Figure 96: Global Vs Spain Growth Comparison

Figure 97: Spain Market Share Analysis (%) by Sample Type, 2022 to 2033

Figure 98: Spain Market Share Analysis (%) by Gender, 2022 to 2033

Figure 99: Spain Market Share Analysis (%) by End User, 2022 to 2033

Figure 100: Russia Market Value Proportion Analysis, 2022

Figure 101: Global Vs Russia Growth Comparison

Figure 102: Russia Market Share Analysis (%) by Sample Type, 2022 to 2033

Figure 103: Russia Market Share Analysis (%) by Gender, 2022 to 2033

Figure 104: Russia Market Share Analysis (%) by End User, 2022 to 2033

Figure 105: BENELUX Market Value Proportion Analysis, 2022

Figure 106: Global Vs BENELUX Growth Comparison

Figure 107: BENELUX Market Share Analysis (%) by Sample Type, 2022 to 2033

Figure 108: BENELUX Market Share Analysis (%) by Gender, 2022 to 2033

Figure 109: BENELUX Market Share Analysis (%) by End User, 2022 to 2033

Figure 110: East Asia Market Value (US$ Million) Analysis, 2012 to 2022

Figure 111: East Asia Market Value (US$ Million) Forecast, 2023 to 2033

Figure 112: East Asia Market Value Share, by Sample Type (2023 E)

Figure 113: East Asia Market Value Share, by Gender (2023 E)

Figure 114: East Asia Market Value Share, by End User (2023 E)

Figure 115: East Asia Market Value Share, by Country (2023 E)

Figure 116: East Asia Market Attractiveness Analysis by Sample Type, 2023 to 2033

Figure 117: East Asia Market Attractiveness Analysis by Gender, 2023 to 2033

Figure 118: East Asia Market Attractiveness Analysis by End User, 2023 to 2033

Figure 119: East Asia Market Attractiveness Analysis by Country, 2023 to 2033

Figure 120: China Market Value Proportion Analysis, 2022

Figure 121: Global Vs. China Growth Comparison

Figure 122: China Market Share Analysis (%) by Sample Type, 2022 to 2033

Figure 123: China Market Share Analysis (%) by Gender, 2022 to 2033

Figure 124: China Market Share Analysis (%) by End User, 2022 to 2033

Figure 125: Japan Market Value Proportion Analysis, 2022

Figure 126: Global Vs. Japan Growth Comparison

Figure 127: Japan Market Share Analysis (%) by Sample Type, 2022 to 2033

Figure 128: Japan Market Share Analysis (%) by Gender, 2022 to 2033

Figure 129: Japan Market Share Analysis (%) by End User, 2022 to 2033

Figure 130: South Korea Market Value Proportion Analysis, 2022

Figure 131: Global Vs South Korea Growth Comparison

Figure 132: South Korea Market Share Analysis (%) by Sample Type, 2022 to 2033

Figure 133: South Korea Market Share Analysis (%) by Gender, 2022 to 2033

Figure 134: South Korea Market Share Analysis (%) by End User, 2022 to 2033

Figure 135: South Asia Market Value (US$ Million) Analysis, 2012 to 2022

Figure 136: South Asia Market Value (US$ Million) Forecast, 2023 to 2033

Figure 137: South Asia Market Value Share, by Sample Type (2023 E)

Figure 138: South Asia Market Value Share, by Gender (2023 E)

Figure 139: South Asia Market Value Share, by End User (2023 E)

Figure 140: South Asia Market Value Share, by Country (2023 E)

Figure 141: South Asia Market Attractiveness Analysis by Sample Type, 2023 to 2033

Figure 142: South Asia Market Attractiveness Analysis by Gender, 2023 to 2033

Figure 143: South Asia Market Attractiveness Analysis by End User, 2023 to 2033

Figure 144: South Asia Market Attractiveness Analysis by Country, 2023 to 2033

Figure 145: India Market Value Proportion Analysis, 2022

Figure 146: Global Vs. India Growth Comparison

Figure 147: India Market Share Analysis (%) by Sample Type, 2022 to 2033

Figure 148: India Market Share Analysis (%) by Gender, 2022 to 2033

Figure 149: India Market Share Analysis (%) by End User, 2022 to 2033

Figure 150: Indonesia Market Value Proportion Analysis, 2022

Figure 151: Global Vs. Indonesia Growth Comparison

Figure 152: Indonesia Market Share Analysis (%) by Sample Type, 2022 to 2033

Figure 153: Indonesia Market Share Analysis (%) by Gender, 2022 to 2033

Figure 154: Indonesia Market Share Analysis (%) by End User, 2022 to 2033

Figure 155: Malaysia Market Value Proportion Analysis, 2022

Figure 156: Global Vs. Malaysia Growth Comparison

Figure 157: Malaysia Market Share Analysis (%) by Sample Type, 2022 to 2033

Figure 158: Malaysia Market Share Analysis (%) by Gender, 2022 to 2033

Figure 159: Malaysia Market Share Analysis (%) by End User, 2022 to 2033

Figure 160: Thailand Market Value Proportion Analysis, 2022

Figure 161: Global Vs. Thailand Growth Comparison

Figure 162: Thailand Market Share Analysis (%) by Sample Type, 2022 to 2033

Figure 163: Thailand Market Share Analysis (%) by Gender, 2022 to 2033

Figure 164: Thailand Market Share Analysis (%) by End User, 2022 to 2033

Figure 165: Oceania Market Value (US$ Million) Analysis, 2012 to 2022

Figure 166: Oceania Market Value (US$ Million) Forecast, 2023 to 2033

Figure 167: Oceania Market Value Share, by Sample Type (2023 E)

Figure 168: Oceania Market Value Share, by Gender (2023 E)

Figure 169: Oceania Market Value Share, by End User (2023 E)

Figure 170: Oceania Market Value Share, by Country (2023 E)

Figure 171: Oceania Market Attractiveness Analysis by Sample Type, 2023 to 2033

Figure 172: Oceania Market Attractiveness Analysis by Gender, 2023 to 2033

Figure 173: Oceania Market Attractiveness Analysis by End User, 2023 to 2033

Figure 174: Oceania Market Attractiveness Analysis by Country, 2023 to 2033

Figure 175: Australia Market Value Proportion Analysis, 2022

Figure 176: Global Vs. Australia Growth Comparison

Figure 177: Australia Market Share Analysis (%) by Sample Type, 2022 to 2033

Figure 178: Australia Market Share Analysis (%) by Gender, 2022 to 2033

Figure 179: Australia Market Share Analysis (%) by End User, 2022 to 2033

Figure 180: New Zealand Market Value Proportion Analysis, 2022

Figure 181: Global Vs New Zealand Growth Comparison

Figure 182: New Zealand Market Share Analysis (%) by Sample Type, 2022 to 2033

Figure 183: New Zealand Market Share Analysis (%) by Gender, 2022 to 2033

Figure 184: New Zealand Market Share Analysis (%) by End User, 2022 to 2033

Figure 185: Middle East & Africa Market Value (US$ Million) Analysis, 2012 to 2022

Figure 186: Middle East & Africa Market Value (US$ Million) Forecast, 2023 to 2033

Figure 187: Middle East & Africa Market Value Share, by Sample Type (2023 E)

Figure 188: Middle East & Africa Market Value Share, by Gender (2023 E)

Figure 189: Middle East & Africa Market Value Share, by End User (2023 E)

Figure 190: Middle East & Africa Market Value Share, by Country (2023 E)

Figure 191: Middle East & Africa Market Attractiveness Analysis by Sample Type, 2023 to 2033

Figure 192: Middle East & Africa Market Attractiveness Analysis by Gender, 2023 to 2033

Figure 193: Middle East & Africa Market Attractiveness Analysis by End User, 2023 to 2033

Figure 194: Middle East & Africa Market Attractiveness Analysis by Country, 2023 to 2033

Figure 195: GCC Countries Market Value Proportion Analysis, 2022

Figure 196: Global Vs GCC Countries Growth Comparison

Figure 197: GCC Countries Market Share Analysis (%) by Sample Type, 2022 to 2033

Figure 198: GCC Countries Market Share Analysis (%) by Gender, 2022 to 2033

Figure 199: GCC Countries Market Share Analysis (%) by End User, 2022 to 2033

Figure 200: Türkiye Market Value Proportion Analysis, 2022

Figure 201: Global Vs. Türkiye Growth Comparison

Figure 202: Türkiye Market Share Analysis (%) by Sample Type, 2022 to 2033

Figure 203: Türkiye Market Share Analysis (%) by Gender, 2022 to 2033

Figure 204: Türkiye Market Share Analysis (%) by End User, 2022 to 2033

Figure 205: South Africa Market Value Proportion Analysis, 2022

Figure 206: Global Vs. South Africa Growth Comparison

Figure 207: South Africa Market Share Analysis (%) by Sample Type, 2022 to 2033

Figure 208: South Africa Market Share Analysis (%) by Gender, 2022 to 2033

Figure 209: South Africa Market Share Analysis (%) by End User, 2022 to 2033

Figure 210: North Africa Market Value Proportion Analysis, 2022

Figure 211: Global Vs North Africa Growth Comparison

Figure 212: North Africa Market Share Analysis (%) by Sample Type, 2022 to 2033

Figure 213: North Africa Market Share Analysis (%) by Gender, 2022 to 2033

Figure 214: North Africa Market Share Analysis (%) by End User, 2022 to 2033

Frequently Asked Questions

How much is the testosterone test market worth in 2024?

The global testosterone test market is worth USD 100.0 million in 2024 and is set to expand by 6.9% over the next ten years.

What is the sales forecast for the testosterone test market through 2034?

The market is expected to reach USD 208.1 million by the end of 2033.

What are the key trends shaping the testosterone test market?

The increasing number of manufacturing kits having a combination of different tests, digitalized reports, and the ease of sample collection are a few key trends in this market.

Which are the top 5 countries in the testosterone test market?

The United States, Germany, the United Kingdom, India, and China are expected to drive demand for the testosterone test industry.

What is the North American market outlook for testosterone tests?

North America is one of the key markets for testosterone tests, with the U.S. accounting for about 89.9% of the North American market in the year 2022.

At what rate is the demand for testosterone tests expected to grow in Europe?

Demand for testosterone tests in Europe is expected to register a growth of 7.2% over the next ten years.

Explore Similar Insights

Future Market Insights

Testosterone Test Market