Sand Testing Equipments Market Size and Share Forecast Outlook 2025 to 2035

The Sand Testing Equipments Market is estimated to be valued at USD 470.3 million in 2025 and is projected to reach USD 730.3 million by 2035, registering a compound annual growth rate (CAGR) of 4.5% over the forecast period.
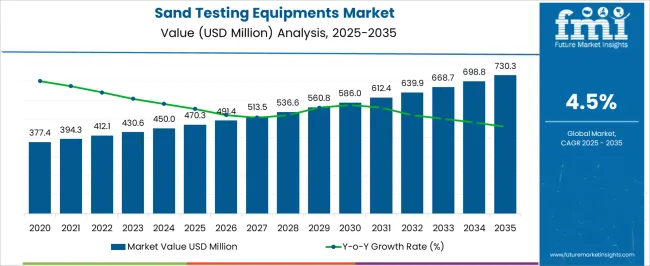
Quick Stats for Sand Testing Equipments Market

  • Sand Testing Equipments Market Value (2025): USD 470.3 million
  • Sand Testing Equipments Market Forecast Value (2035): USD 730.3 million
  • Sand Testing Equipments Market Forecast CAGR: 4.5%
  • Leading Segment in Sand Testing Equipments Market in 2025: Organic Impurities Tests (30.0%)
  • Key Growth Regions in Sand Testing Equipments Market: North America, Asia-Pacific, Europe
  • Top Key Players in Sand Testing Equipments Market: Versatile Equipments, KELSONS, Associated Scientific and Engineering Works, China Liming Heavy Industry Science and Technology, LG, CB Machinery, Supertech Scientific and Metallurgical Services, Simpson Technologies, Royals Enterprises, Ideal Engineering & Technology, Usha Instruments & Chemicals

Sand Testing Equipments Market Market Value Analysis

Sand Testing Equipments Market Key Takeaways

Metric Value
Sand Testing Equipments Market Estimated Value in (2025 E) USD 470.3 million
Sand Testing Equipments Market Forecast Value in (2035 F) USD 730.3 million
Forecast CAGR (2025 to 2035) 4.5%

Why is the Sand Testing Equipments Market Growing?

The Sand Testing Equipments market is experiencing steady growth driven by increasing demand for quality control and performance assurance in construction and industrial applications. The market is being shaped by the rising need to ensure the durability and purity of sand used in construction, foundry, and industrial processes. Investments in infrastructure projects, growing urbanization, and stricter regulatory standards for material quality are fueling the adoption of sand testing equipment.

Technological advancements in automated testing, improved accuracy of results, and integration with data management systems have further accelerated market growth. The adoption of sophisticated instruments that can deliver rapid and reliable analysis of sand properties is increasing the efficiency of testing processes and reducing the risk of material-related failures.

As industries prioritize operational safety and product quality, the demand for sand testing solutions is expected to expand Future opportunities are anticipated in the development of multi-functional testing equipment and software-enabled instruments that enhance testing precision and offer better reporting and traceability capabilities across industrial and construction applications.

Segmental Analysis

The sand testing equipments market is segmented by test type, offering, equipment type, and geographic regions. By test type, sand testing equipments market is divided into Organic Impurities Tests, Silt Content Tests, Particle Size Tests, and Deleterious Materials Tests. In terms of offering, sand testing equipments market is classified into Durability, Strength, and Surface Finish. Based on equipment type, sand testing equipments market is segmented into Sand Samplers, Sand Washers, Moisture Indicators, Density Indicators, and Permeability Meter. Regionally, the sand testing equipments industry is classified into North America, Latin America, Western Europe, Eastern Europe, Balkan & Baltic Countries, Russia & Belarus, Central Asia, East Asia, South Asia & Pacific, and the Middle East & Africa.
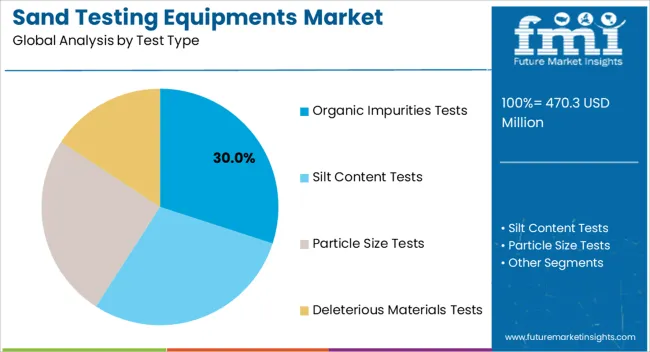
Insights into the Organic Impurities Tests Segment

Sand Testing Equipments Market Analysis By Test Type

The Organic Impurities Tests segment is projected to hold 30.00% of the Sand Testing Equipments market revenue in 2025, making it a leading segment in the test type category. Growth in this segment is being attributed to the critical role of organic content evaluation in determining sand suitability for construction and industrial processes. Organic impurities can significantly affect the binding properties and durability of concrete and foundry sand.

The increasing focus on material quality and regulatory compliance has driven adoption of tests that accurately measure organic content. Automated testing systems that provide faster and more precise results are being increasingly implemented in laboratories and on-site testing facilities.

As industries aim to minimize construction defects and ensure adherence to standards, the demand for reliable organic impurity testing is being enhanced The ability to integrate these tests with data monitoring systems and quality management frameworks has further strengthened the segment's market position and is expected to sustain growth.
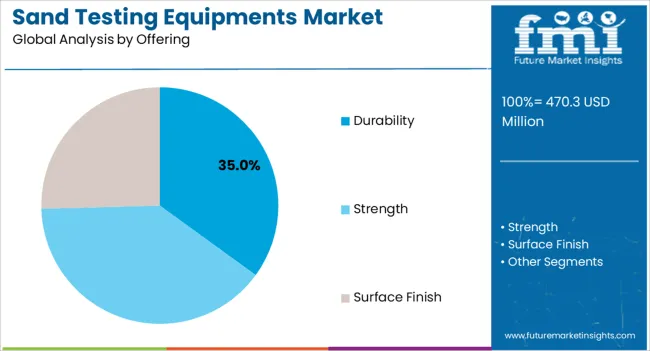
Insights into the Durability Segment

Sand Testing Equipments Market Analysis By Offering

The Durability segment is expected to account for 35.00% of the Sand Testing Equipments market revenue in 2025, representing the leading offering category. Growth in this segment is being driven by the increasing emphasis on long-term structural integrity and the performance of construction materials. Durability tests evaluate resistance to wear, weathering, and chemical exposure, which are crucial for infrastructure and industrial applications.

Adoption has been supported by rising investments in large-scale construction projects where material failure can have significant safety and financial implications. Advanced durability testing equipment allows precise simulation of operational conditions, enabling engineers and manufacturers to make informed decisions on material suitability.

The integration of testing instruments with digital monitoring systems provides detailed insights that improve construction planning and reduce risks With an increasing focus on sustainable construction and high-performance materials, the demand for durability testing solutions is expected to continue its strong growth trajectory.
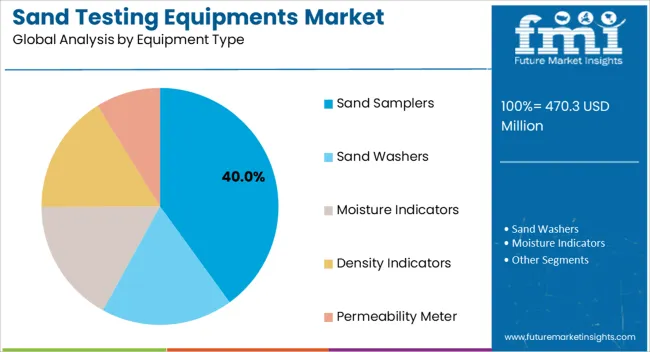
Insights into the Sand Samplers Segment

Sand Testing Equipments Market Analysis By Equipment Type

The Sand Samplers segment is anticipated to hold 40.00% of the Sand Testing Equipments market revenue in 2025, making it the leading equipment type. The growth of this segment is being driven by the essential role of accurate sample collection in ensuring reliable testing results. High-quality sand samplers enable consistent and representative sampling, which is critical for laboratory analysis and on-site evaluation.

Industries are increasingly adopting standardized sampling procedures to comply with regulatory requirements and quality assurance protocols. The use of samplers minimizes errors caused by human intervention and ensures repeatability across tests, which enhances the credibility of analytical results.

The segment has further benefited from the development of portable and automated samplers that can improve efficiency in field operations As the importance of quality control and process validation grows across construction and industrial sectors, the demand for sand samplers is expected to remain robust, underpinning the segment's dominant market position.

Market Overview

Sand Testing Equipments Market: Introduction

The sand testing equipments test the various components of sand used in construction of concrete which include natural sand, crushed stone sand, and crushed gravel sand stone dust. The sand should be hard, durable, chemically inert and free from adherent coatings, organic matters etc.

The sand testing equipments provide the information about the organic impurities like iron, mica, alkalis present in the sand, moisture content in the sand, clay. The particles of sand have different sizes. The sand testing equipments are used to test whether the sand particles are within graded zones or not.

As sand is the prime factor used in construction works after water the sand testing equipments are required to be highly efficient, accurate and reliable.

The construction industry is expected to witness significant growth during the forecast periods. The increasing construction works are expected to fuel the growth in sand testing equipments market.
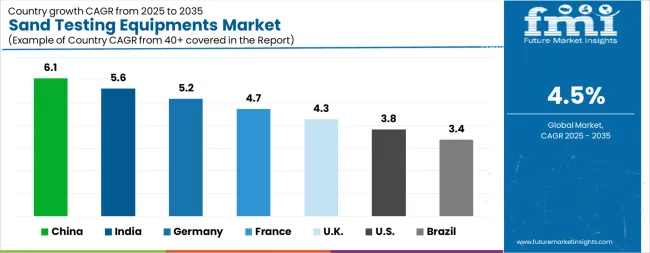
Analysis of Sand Testing Equipments Market By Key Countries

Sand Testing Equipments Market Cagr Analysis By Country

Country CAGR
China 6.1%
India 5.6%
Germany 5.2%
France 4.7%
UK 4.3%
USA 3.8%
Brazil 3.4%

Country-wise Analysis

The Sand Testing Equipments Market is expected to register a CAGR of 4.5% during the forecast period, exhibiting varied country level momentum. China leads with the highest CAGR of 6.1%, followed by India at 5.6%. Developed markets such as Germany, France, and the UK continue to expand steadily, while the USA is likely to grow at consistent rates. Brazil posts the lowest CAGR at 3.4%, yet still underscores a broadly positive trajectory for the global Sand Testing Equipments Market. In 2024, Germany held a dominant revenue in the Western Europe market and is expected to grow with a CAGR of 5.2%. The USA Sand Testing Equipments Market is estimated to be valued at USD 162.9 million in 2025 and is anticipated to reach a valuation of USD 237.1 million by 2035. Sales are projected to rise at a CAGR of 3.8% over the forecast period between 2025 and 2035. While Japan and South Korea markets are estimated to be valued at USD 22.1 million and USD 15.5 million respectively in 2025.
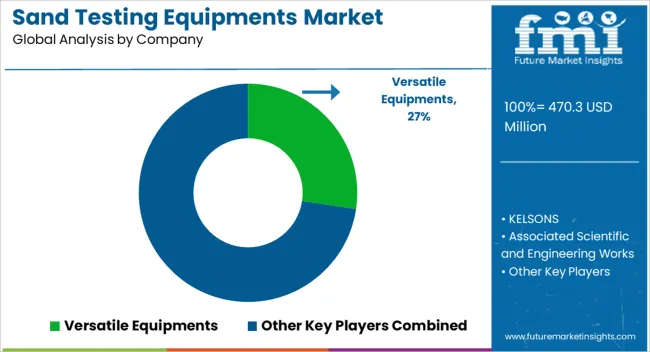
Key Players in the Sand Testing Equipments Market

Sand Testing Equipments Market Analysis By Company

  • Versatile Equipments
  • KELSONS
  • Associated Scientific and Engineering Works
  • China Liming Heavy Industry Science and Technology
  • LG
  • CB Machinery
  • Supertech Scientific and Metallurgical Services
  • Simpson Technologies
  • Royals Enterprises
  • Ideal Engineering & Technology
  • Usha Instruments & Chemicals

Scope of the Report

Item Value
Quantitative Units USD 470.3 Million
Test Type Organic Impurities Tests, Silt Content Tests, Particle Size Tests, and Deleterious Materials Tests
Offering Durability, Strength, and Surface Finish
Equipment Type Sand Samplers, Sand Washers, Moisture Indicators, Density Indicators, and Permeability Meter
Regions Covered North America, Europe, Asia-Pacific, Latin America, Middle East & Africa
Country Covered United States, Canada, Germany, France, United Kingdom, China, Japan, India, Brazil, South Africa
Key Companies Profiled Versatile Equipments, KELSONS, Associated Scientific and Engineering Works, China Liming Heavy Industry Science and Technology, LG, CB Machinery, Supertech Scientific and Metallurgical Services, Simpson Technologies, Royals Enterprises, Ideal Engineering & Technology, and Usha Instruments & Chemicals

Sand Testing Equipments Market by Segments

Test Type:

  • Organic Impurities Tests
  • Silt Content Tests
  • Particle Size Tests
  • Deleterious Materials Tests

Offering:

  • Durability
  • Strength
  • Surface Finish

Equipment Type:

  • Sand Samplers
  • Sand Washers
  • Moisture Indicators
  • Density Indicators
  • Permeability Meter

Region:

  • North America
    • USA
    • Canada
    • Mexico
  • Latin America
    • Brazil
    • Chile
    • Rest of Latin America
  • Western Europe
    • Germany
    • UK
    • Italy
    • Spain
    • France
    • Nordic
    • BENELUX
    • Rest of Western Europe
  • Eastern Europe
    • Russia
    • Poland
    • Hungary
    • Balkan & Baltic
    • Rest of Eastern Europe
  • East Asia
    • China
    • Japan
    • South Korea
  • South Asia and Pacific
    • India
    • ASEAN
    • Australia & New Zealand
    • Rest of South Asia and Pacific
  • Middle East & Africa
    • Kingdom of Saudi Arabia
    • Other GCC Countries
    • Turkiye
    • South Africa
    • Other African Union
    • Rest of Middle East & Africa

Table of Content

  1. Executive Summary
    • Global Market Outlook
    • Demand-side Trends
    • Supply-side Trends
    • Technology Roadmap Analysis
    • Analysis and Recommendations
  2. Market Overview
    • Market Coverage / Taxonomy
    • Market Definition / Scope / Limitations
  3. Market Background
    • Market Dynamics
      • Drivers
      • Restraints
      • Opportunity
      • Trends
    • Scenario Forecast
      • Demand in Optimistic Scenario
      • Demand in Likely Scenario
      • Demand in Conservative Scenario
    • Opportunity Map Analysis
    • Product Life Cycle Analysis
    • Supply Chain Analysis
    • Investment Feasibility Matrix
    • Value Chain Analysis
    • PESTLE and Porter’s Analysis
    • Regulatory Landscape
    • Regional Parent Market Outlook
    • Production and Consumption Statistics
    • Import and Export Statistics
  4. Global Market Analysis 2020-2024 and Forecast, 2025-2035
    • Historical Market Size Value (USD Million) Analysis, 2020-2024
    • Current and Future Market Size Value (USD Million) Projections, 2025-2035
      • Y-o-Y Growth Trend Analysis
      • Absolute $ Opportunity Analysis
  5. Global Market Pricing Analysis 2020-2024 and Forecast 2025-2035
  6. Global Market Analysis 2020-2024 and Forecast 2025-2035, By Test Type
    • Introduction / Key Findings
    • Historical Market Size Value (USD Million) Analysis By Test Type , 2020-2024
    • Current and Future Market Size Value (USD Million) Analysis and Forecast By Test Type , 2025-2035
      • Organic Impurities Tests
      • Silt Content Tests
      • Particle Size Tests
      • Deleterious Materials Tests
    • Y-o-Y Growth Trend Analysis By Test Type , 2020-2024
    • Absolute $ Opportunity Analysis By Test Type , 2025-2035
  7. Global Market Analysis 2020-2024 and Forecast 2025-2035, By Offering
    • Introduction / Key Findings
    • Historical Market Size Value (USD Million) Analysis By Offering, 2020-2024
    • Current and Future Market Size Value (USD Million) Analysis and Forecast By Offering, 2025-2035
      • Durability
      • Strength
      • Surface Finish
    • Y-o-Y Growth Trend Analysis By Offering, 2020-2024
    • Absolute $ Opportunity Analysis By Offering, 2025-2035
  8. Global Market Analysis 2020-2024 and Forecast 2025-2035, By Equipment Type
    • Introduction / Key Findings
    • Historical Market Size Value (USD Million) Analysis By Equipment Type, 2020-2024
    • Current and Future Market Size Value (USD Million) Analysis and Forecast By Equipment Type, 2025-2035
      • Sand Samplers
      • Sand Washers
      • Moisture Indicators
      • Density Indicators
      • Permeability Meter
    • Y-o-Y Growth Trend Analysis By Equipment Type, 2020-2024
    • Absolute $ Opportunity Analysis By Equipment Type, 2025-2035
  9. Global Market Analysis 2020-2024 and Forecast 2025-2035, By Region
    • Introduction
    • Historical Market Size Value (USD Million) Analysis By Region, 2020-2024
    • Current Market Size Value (USD Million) Analysis and Forecast By Region, 2025-2035
      • North America
      • Latin America
      • Western Europe
      • Eastern Europe
      • East Asia
      • South Asia and Pacific
      • Middle East & Africa
    • Market Attractiveness Analysis By Region
  10. North America Market Analysis 2020-2024 and Forecast 2025-2035, By Country
    • Historical Market Size Value (USD Million) Trend Analysis By Market Taxonomy, 2020-2024
    • Market Size Value (USD Million) Forecast By Market Taxonomy, 2025-2035
      • By Country
        • USA
        • Canada
        • Mexico
      • By Test Type
      • By Offering
      • By Equipment Type
    • Market Attractiveness Analysis
      • By Country
      • By Test Type
      • By Offering
      • By Equipment Type
    • Key Takeaways
  11. Latin America Market Analysis 2020-2024 and Forecast 2025-2035, By Country
    • Historical Market Size Value (USD Million) Trend Analysis By Market Taxonomy, 2020-2024
    • Market Size Value (USD Million) Forecast By Market Taxonomy, 2025-2035
      • By Country
        • Brazil
        • Chile
        • Rest of Latin America
      • By Test Type
      • By Offering
      • By Equipment Type
    • Market Attractiveness Analysis
      • By Country
      • By Test Type
      • By Offering
      • By Equipment Type
    • Key Takeaways
  12. Western Europe Market Analysis 2020-2024 and Forecast 2025-2035, By Country
    • Historical Market Size Value (USD Million) Trend Analysis By Market Taxonomy, 2020-2024
    • Market Size Value (USD Million) Forecast By Market Taxonomy, 2025-2035
      • By Country
        • Germany
        • UK
        • Italy
        • Spain
        • France
        • Nordic
        • BENELUX
        • Rest of Western Europe
      • By Test Type
      • By Offering
      • By Equipment Type
    • Market Attractiveness Analysis
      • By Country
      • By Test Type
      • By Offering
      • By Equipment Type
    • Key Takeaways
  13. Eastern Europe Market Analysis 2020-2024 and Forecast 2025-2035, By Country
    • Historical Market Size Value (USD Million) Trend Analysis By Market Taxonomy, 2020-2024
    • Market Size Value (USD Million) Forecast By Market Taxonomy, 2025-2035
      • By Country
        • Russia
        • Poland
        • Hungary
        • Balkan & Baltic
        • Rest of Eastern Europe
      • By Test Type
      • By Offering
      • By Equipment Type
    • Market Attractiveness Analysis
      • By Country
      • By Test Type
      • By Offering
      • By Equipment Type
    • Key Takeaways
  14. East Asia Market Analysis 2020-2024 and Forecast 2025-2035, By Country
    • Historical Market Size Value (USD Million) Trend Analysis By Market Taxonomy, 2020-2024
    • Market Size Value (USD Million) Forecast By Market Taxonomy, 2025-2035
      • By Country
        • China
        • Japan
        • South Korea
      • By Test Type
      • By Offering
      • By Equipment Type
    • Market Attractiveness Analysis
      • By Country
      • By Test Type
      • By Offering
      • By Equipment Type
    • Key Takeaways
  15. South Asia and Pacific Market Analysis 2020-2024 and Forecast 2025-2035, By Country
    • Historical Market Size Value (USD Million) Trend Analysis By Market Taxonomy, 2020-2024
    • Market Size Value (USD Million) Forecast By Market Taxonomy, 2025-2035
      • By Country
        • India
        • ASEAN
        • Australia & New Zealand
        • Rest of South Asia and Pacific
      • By Test Type
      • By Offering
      • By Equipment Type
    • Market Attractiveness Analysis
      • By Country
      • By Test Type
      • By Offering
      • By Equipment Type
    • Key Takeaways
  16. Middle East & Africa Market Analysis 2020-2024 and Forecast 2025-2035, By Country
    • Historical Market Size Value (USD Million) Trend Analysis By Market Taxonomy, 2020-2024
    • Market Size Value (USD Million) Forecast By Market Taxonomy, 2025-2035
      • By Country
        • Kingdom of Saudi Arabia
        • Other GCC Countries
        • Turkiye
        • South Africa
        • Other African Union
        • Rest of Middle East & Africa
      • By Test Type
      • By Offering
      • By Equipment Type
    • Market Attractiveness Analysis
      • By Country
      • By Test Type
      • By Offering
      • By Equipment Type
    • Key Takeaways
  17. Key Countries Market Analysis
    • USA
      • Pricing Analysis
      • Market Share Analysis, 2024
        • By Test Type
        • By Offering
        • By Equipment Type
    • Canada
      • Pricing Analysis
      • Market Share Analysis, 2024
        • By Test Type
        • By Offering
        • By Equipment Type
    • Mexico
      • Pricing Analysis
      • Market Share Analysis, 2024
        • By Test Type
        • By Offering
        • By Equipment Type
    • Brazil
      • Pricing Analysis
      • Market Share Analysis, 2024
        • By Test Type
        • By Offering
        • By Equipment Type
    • Chile
      • Pricing Analysis
      • Market Share Analysis, 2024
        • By Test Type
        • By Offering
        • By Equipment Type
    • Germany
      • Pricing Analysis
      • Market Share Analysis, 2024
        • By Test Type
        • By Offering
        • By Equipment Type
    • UK
      • Pricing Analysis
      • Market Share Analysis, 2024
        • By Test Type
        • By Offering
        • By Equipment Type
    • Italy
      • Pricing Analysis
      • Market Share Analysis, 2024
        • By Test Type
        • By Offering
        • By Equipment Type
    • Spain
      • Pricing Analysis
      • Market Share Analysis, 2024
        • By Test Type
        • By Offering
        • By Equipment Type
    • France
      • Pricing Analysis
      • Market Share Analysis, 2024
        • By Test Type
        • By Offering
        • By Equipment Type
    • India
      • Pricing Analysis
      • Market Share Analysis, 2024
        • By Test Type
        • By Offering
        • By Equipment Type
    • ASEAN
      • Pricing Analysis
      • Market Share Analysis, 2024
        • By Test Type
        • By Offering
        • By Equipment Type
    • Australia & New Zealand
      • Pricing Analysis
      • Market Share Analysis, 2024
        • By Test Type
        • By Offering
        • By Equipment Type
    • China
      • Pricing Analysis
      • Market Share Analysis, 2024
        • By Test Type
        • By Offering
        • By Equipment Type
    • Japan
      • Pricing Analysis
      • Market Share Analysis, 2024
        • By Test Type
        • By Offering
        • By Equipment Type
    • South Korea
      • Pricing Analysis
      • Market Share Analysis, 2024
        • By Test Type
        • By Offering
        • By Equipment Type
    • Russia
      • Pricing Analysis
      • Market Share Analysis, 2024
        • By Test Type
        • By Offering
        • By Equipment Type
    • Poland
      • Pricing Analysis
      • Market Share Analysis, 2024
        • By Test Type
        • By Offering
        • By Equipment Type
    • Hungary
      • Pricing Analysis
      • Market Share Analysis, 2024
        • By Test Type
        • By Offering
        • By Equipment Type
    • Kingdom of Saudi Arabia
      • Pricing Analysis
      • Market Share Analysis, 2024
        • By Test Type
        • By Offering
        • By Equipment Type
    • Turkiye
      • Pricing Analysis
      • Market Share Analysis, 2024
        • By Test Type
        • By Offering
        • By Equipment Type
    • South Africa
      • Pricing Analysis
      • Market Share Analysis, 2024
        • By Test Type
        • By Offering
        • By Equipment Type
  18. Market Structure Analysis
    • Competition Dashboard
    • Competition Benchmarking
    • Market Share Analysis of Top Players
      • By Regional
      • By Test Type
      • By Offering
      • By Equipment Type
  19. Competition Analysis
    • Competition Deep Dive
      • Versatile Equipments
        • Overview
        • Product Portfolio
        • Profitability by Market Segments (Product/Age /Sales Channel/Region)
        • Sales Footprint
        • Strategy Overview
          • Marketing Strategy
          • Product Strategy
          • Channel Strategy
      • KELSONS
      • Associated Scientific and Engineering Works
      • China Liming Heavy Industry Science and Technology
      • LG
      • CB Machinery
      • Supertech Scientific and Metallurgical Services
      • Simpson Technologies
      • Royals Enterprises
      • Ideal Engineering & Technology
      • Usha Instruments & Chemicals
  20. Assumptions & Acronyms Used
  21. Research Methodology

List of Tables

  • Table 1: Global Sand Testing Equipments Market Value (USD Mn) Forecast by Region, 2020-2035
  • Table 2: Global Sand Testing Equipments Market Value (USD Mn) Forecast by Test Type , 2020-2035
  • Table 3: Global Sand Testing Equipments Market Value (USD Mn) Forecast by Offering, 2020-2035
  • Table 4: Global Sand Testing Equipments Market Value (USD Mn) Forecast by Equipment Type, 2020-2035
  • Table 5: North America Sand Testing Equipments Market Value (USD Mn) Forecast by Country, 2020-2035
  • Table 6: North America Sand Testing Equipments Market Value (USD Mn) Forecast by Test Type , 2020-2035
  • Table 7: North America Sand Testing Equipments Market Value (USD Mn) Forecast by Offering, 2020-2035
  • Table 8: North America Sand Testing Equipments Market Value (USD Mn) Forecast by Equipment Type, 2020-2035
  • Table 9: Latin America Sand Testing Equipments Market Value (USD Mn) Forecast by Country, 2020-2035
  • Table 10: Latin America Sand Testing Equipments Market Value (USD Mn) Forecast by Test Type , 2020-2035
  • Table 11: Latin America Sand Testing Equipments Market Value (USD Mn) Forecast by Offering, 2020-2035
  • Table 12: Latin America Sand Testing Equipments Market Value (USD Mn) Forecast by Equipment Type, 2020-2035
  • Table 13: Western Europe Sand Testing Equipments Market Value (USD Mn) Forecast by Country, 2020-2035
  • Table 14: Western Europe Sand Testing Equipments Market Value (USD Mn) Forecast by Test Type , 2020-2035
  • Table 15: Western Europe Sand Testing Equipments Market Value (USD Mn) Forecast by Offering, 2020-2035
  • Table 16: Western Europe Sand Testing Equipments Market Value (USD Mn) Forecast by Equipment Type, 2020-2035
  • Table 17: Eastern Europe Sand Testing Equipments Market Value (USD Mn) Forecast by Country, 2020-2035
  • Table 18: Eastern Europe Sand Testing Equipments Market Value (USD Mn) Forecast by Test Type , 2020-2035
  • Table 19: Eastern Europe Sand Testing Equipments Market Value (USD Mn) Forecast by Offering, 2020-2035
  • Table 20: Eastern Europe Sand Testing Equipments Market Value (USD Mn) Forecast by Equipment Type, 2020-2035
  • Table 21: East Asia Sand Testing Equipments Market Value (USD Mn) Forecast by Country, 2020-2035
  • Table 22: East Asia Sand Testing Equipments Market Value (USD Mn) Forecast by Test Type , 2020-2035
  • Table 23: East Asia Sand Testing Equipments Market Value (USD Mn) Forecast by Offering, 2020-2035
  • Table 24: East Asia Sand Testing Equipments Market Value (USD Mn) Forecast by Equipment Type, 2020-2035
  • Table 25: South Asia and Pacific Sand Testing Equipments Market Value (USD Mn) Forecast by Country, 2020-2035
  • Table 26: South Asia and Pacific Sand Testing Equipments Market Value (USD Mn) Forecast by Test Type , 2020-2035
  • Table 27: South Asia and Pacific Sand Testing Equipments Market Value (USD Mn) Forecast by Offering, 2020-2035
  • Table 28: South Asia and Pacific Sand Testing Equipments Market Value (USD Mn) Forecast by Equipment Type, 2020-2035
  • Table 29: Middle East & Africa Sand Testing Equipments Market Value (USD Mn) Forecast by Country, 2020-2035
  • Table 30: Middle East & Africa Sand Testing Equipments Market Value (USD Mn) Forecast by Test Type , 2020-2035
  • Table 31: Middle East & Africa Sand Testing Equipments Market Value (USD Mn) Forecast by Offering, 2020-2035
  • Table 32: Middle East & Africa Sand Testing Equipments Market Value (USD Mn) Forecast by Equipment Type, 2020-2035

List of Figures

  • Figure 1: Global Sand Testing Equipments Market Pricing Analysis
  • Figure 2: Global Sand Testing Equipments Market Value (USD Mn) Forecast 2020–2035
  • Figure 3: Global Sand Testing Equipments Market Value Share and BPS Analysis by Test Type , 2025 and 2035
  • Figure 4: Global Sand Testing Equipments Market Y-o-Y Growth Comparison by Test Type , 2025–2035
  • Figure 5: Global Sand Testing Equipments Market Attractiveness Analysis by Test Type
  • Figure 6: Global Sand Testing Equipments Market Value Share and BPS Analysis by Offering, 2025 and 2035
  • Figure 7: Global Sand Testing Equipments Market Y-o-Y Growth Comparison by Offering, 2025–2035
  • Figure 8: Global Sand Testing Equipments Market Attractiveness Analysis by Offering
  • Figure 9: Global Sand Testing Equipments Market Value Share and BPS Analysis by Equipment Type, 2025 and 2035
  • Figure 10: Global Sand Testing Equipments Market Y-o-Y Growth Comparison by Equipment Type, 2025–2035
  • Figure 11: Global Sand Testing Equipments Market Attractiveness Analysis by Equipment Type
  • Figure 12: Global Sand Testing Equipments Market Value (USD Mn) Share and BPS Analysis by Region, 2025 and 2035
  • Figure 13: Global Sand Testing Equipments Market Y-o-Y Growth Comparison by Region, 2025–2035
  • Figure 14: Global Sand Testing Equipments Market Attractiveness Analysis by Region
  • Figure 15: North America Sand Testing Equipments Market Incremental Dollar Opportunity, 2025–2035
  • Figure 16: Latin America Sand Testing Equipments Market Incremental Dollar Opportunity, 2025–2035
  • Figure 17: Western Europe Sand Testing Equipments Market Incremental Dollar Opportunity, 2025–2035
  • Figure 18: Eastern Europe Sand Testing Equipments Market Incremental Dollar Opportunity, 2025–2035
  • Figure 19: East Asia Sand Testing Equipments Market Incremental Dollar Opportunity, 2025–2035
  • Figure 20: South Asia and Pacific Sand Testing Equipments Market Incremental Dollar Opportunity, 2025–2035
  • Figure 21: Middle East & Africa Sand Testing Equipments Market Incremental Dollar Opportunity, 2025–2035
  • Figure 22: North America Sand Testing Equipments Market Value Share and BPS Analysis by Country, 2025 and 2035
  • Figure 23: North America Sand Testing Equipments Market Value Share and BPS Analysis by Test Type , 2025 and 2035
  • Figure 24: North America Sand Testing Equipments Market Y-o-Y Growth Comparison by Test Type , 2025–2035
  • Figure 25: North America Sand Testing Equipments Market Attractiveness Analysis by Test Type
  • Figure 26: North America Sand Testing Equipments Market Value Share and BPS Analysis by Offering, 2025 and 2035
  • Figure 27: North America Sand Testing Equipments Market Y-o-Y Growth Comparison by Offering, 2025–2035
  • Figure 28: North America Sand Testing Equipments Market Attractiveness Analysis by Offering
  • Figure 29: North America Sand Testing Equipments Market Value Share and BPS Analysis by Equipment Type, 2025 and 2035
  • Figure 30: North America Sand Testing Equipments Market Y-o-Y Growth Comparison by Equipment Type, 2025–2035
  • Figure 31: North America Sand Testing Equipments Market Attractiveness Analysis by Equipment Type
  • Figure 32: Latin America Sand Testing Equipments Market Value Share and BPS Analysis by Country, 2025 and 2035
  • Figure 33: Latin America Sand Testing Equipments Market Value Share and BPS Analysis by Test Type , 2025 and 2035
  • Figure 34: Latin America Sand Testing Equipments Market Y-o-Y Growth Comparison by Test Type , 2025–2035
  • Figure 35: Latin America Sand Testing Equipments Market Attractiveness Analysis by Test Type
  • Figure 36: Latin America Sand Testing Equipments Market Value Share and BPS Analysis by Offering, 2025 and 2035
  • Figure 37: Latin America Sand Testing Equipments Market Y-o-Y Growth Comparison by Offering, 2025–2035
  • Figure 38: Latin America Sand Testing Equipments Market Attractiveness Analysis by Offering
  • Figure 39: Latin America Sand Testing Equipments Market Value Share and BPS Analysis by Equipment Type, 2025 and 2035
  • Figure 40: Latin America Sand Testing Equipments Market Y-o-Y Growth Comparison by Equipment Type, 2025–2035
  • Figure 41: Latin America Sand Testing Equipments Market Attractiveness Analysis by Equipment Type
  • Figure 42: Western Europe Sand Testing Equipments Market Value Share and BPS Analysis by Country, 2025 and 2035
  • Figure 43: Western Europe Sand Testing Equipments Market Value Share and BPS Analysis by Test Type , 2025 and 2035
  • Figure 44: Western Europe Sand Testing Equipments Market Y-o-Y Growth Comparison by Test Type , 2025–2035
  • Figure 45: Western Europe Sand Testing Equipments Market Attractiveness Analysis by Test Type
  • Figure 46: Western Europe Sand Testing Equipments Market Value Share and BPS Analysis by Offering, 2025 and 2035
  • Figure 47: Western Europe Sand Testing Equipments Market Y-o-Y Growth Comparison by Offering, 2025–2035
  • Figure 48: Western Europe Sand Testing Equipments Market Attractiveness Analysis by Offering
  • Figure 49: Western Europe Sand Testing Equipments Market Value Share and BPS Analysis by Equipment Type, 2025 and 2035
  • Figure 50: Western Europe Sand Testing Equipments Market Y-o-Y Growth Comparison by Equipment Type, 2025–2035
  • Figure 51: Western Europe Sand Testing Equipments Market Attractiveness Analysis by Equipment Type
  • Figure 52: Eastern Europe Sand Testing Equipments Market Value Share and BPS Analysis by Country, 2025 and 2035
  • Figure 53: Eastern Europe Sand Testing Equipments Market Value Share and BPS Analysis by Test Type , 2025 and 2035
  • Figure 54: Eastern Europe Sand Testing Equipments Market Y-o-Y Growth Comparison by Test Type , 2025–2035
  • Figure 55: Eastern Europe Sand Testing Equipments Market Attractiveness Analysis by Test Type
  • Figure 56: Eastern Europe Sand Testing Equipments Market Value Share and BPS Analysis by Offering, 2025 and 2035
  • Figure 57: Eastern Europe Sand Testing Equipments Market Y-o-Y Growth Comparison by Offering, 2025–2035
  • Figure 58: Eastern Europe Sand Testing Equipments Market Attractiveness Analysis by Offering
  • Figure 59: Eastern Europe Sand Testing Equipments Market Value Share and BPS Analysis by Equipment Type, 2025 and 2035
  • Figure 60: Eastern Europe Sand Testing Equipments Market Y-o-Y Growth Comparison by Equipment Type, 2025–2035
  • Figure 61: Eastern Europe Sand Testing Equipments Market Attractiveness Analysis by Equipment Type
  • Figure 62: East Asia Sand Testing Equipments Market Value Share and BPS Analysis by Country, 2025 and 2035
  • Figure 63: East Asia Sand Testing Equipments Market Value Share and BPS Analysis by Test Type , 2025 and 2035
  • Figure 64: East Asia Sand Testing Equipments Market Y-o-Y Growth Comparison by Test Type , 2025–2035
  • Figure 65: East Asia Sand Testing Equipments Market Attractiveness Analysis by Test Type
  • Figure 66: East Asia Sand Testing Equipments Market Value Share and BPS Analysis by Offering, 2025 and 2035
  • Figure 67: East Asia Sand Testing Equipments Market Y-o-Y Growth Comparison by Offering, 2025–2035
  • Figure 68: East Asia Sand Testing Equipments Market Attractiveness Analysis by Offering
  • Figure 69: East Asia Sand Testing Equipments Market Value Share and BPS Analysis by Equipment Type, 2025 and 2035
  • Figure 70: East Asia Sand Testing Equipments Market Y-o-Y Growth Comparison by Equipment Type, 2025–2035
  • Figure 71: East Asia Sand Testing Equipments Market Attractiveness Analysis by Equipment Type
  • Figure 72: South Asia and Pacific Sand Testing Equipments Market Value Share and BPS Analysis by Country, 2025 and 2035
  • Figure 73: South Asia and Pacific Sand Testing Equipments Market Value Share and BPS Analysis by Test Type , 2025 and 2035
  • Figure 74: South Asia and Pacific Sand Testing Equipments Market Y-o-Y Growth Comparison by Test Type , 2025–2035
  • Figure 75: South Asia and Pacific Sand Testing Equipments Market Attractiveness Analysis by Test Type
  • Figure 76: South Asia and Pacific Sand Testing Equipments Market Value Share and BPS Analysis by Offering, 2025 and 2035
  • Figure 77: South Asia and Pacific Sand Testing Equipments Market Y-o-Y Growth Comparison by Offering, 2025–2035
  • Figure 78: South Asia and Pacific Sand Testing Equipments Market Attractiveness Analysis by Offering
  • Figure 79: South Asia and Pacific Sand Testing Equipments Market Value Share and BPS Analysis by Equipment Type, 2025 and 2035
  • Figure 80: South Asia and Pacific Sand Testing Equipments Market Y-o-Y Growth Comparison by Equipment Type, 2025–2035
  • Figure 81: South Asia and Pacific Sand Testing Equipments Market Attractiveness Analysis by Equipment Type
  • Figure 82: Middle East & Africa Sand Testing Equipments Market Value Share and BPS Analysis by Country, 2025 and 2035
  • Figure 83: Middle East & Africa Sand Testing Equipments Market Value Share and BPS Analysis by Test Type , 2025 and 2035
  • Figure 84: Middle East & Africa Sand Testing Equipments Market Y-o-Y Growth Comparison by Test Type , 2025–2035
  • Figure 85: Middle East & Africa Sand Testing Equipments Market Attractiveness Analysis by Test Type
  • Figure 86: Middle East & Africa Sand Testing Equipments Market Value Share and BPS Analysis by Offering, 2025 and 2035
  • Figure 87: Middle East & Africa Sand Testing Equipments Market Y-o-Y Growth Comparison by Offering, 2025–2035
  • Figure 88: Middle East & Africa Sand Testing Equipments Market Attractiveness Analysis by Offering
  • Figure 89: Middle East & Africa Sand Testing Equipments Market Value Share and BPS Analysis by Equipment Type, 2025 and 2035
  • Figure 90: Middle East & Africa Sand Testing Equipments Market Y-o-Y Growth Comparison by Equipment Type, 2025–2035
  • Figure 91: Middle East & Africa Sand Testing Equipments Market Attractiveness Analysis by Equipment Type
  • Figure 92: Global Sand Testing Equipments Market – Tier Structure Analysis
  • Figure 93: Global Sand Testing Equipments Market – Company Share Analysis

Frequently Asked Questions

How big is the sand testing equipments market in 2025?

The global sand testing equipments market is estimated to be valued at USD 470.3 million in 2025.

What will be the size of sand testing equipments market in 2035?

The market size for the sand testing equipments market is projected to reach USD 730.3 million by 2035.

How much will be the sand testing equipments market growth between 2025 and 2035?

The sand testing equipments market is expected to grow at a 4.5% CAGR between 2025 and 2035.

What are the key product types in the sand testing equipments market?

The key product types in sand testing equipments market are organic impurities tests, silt content tests, particle size tests and deleterious materials tests.

Which offering segment to contribute significant share in the sand testing equipments market in 2025?

In terms of offering, durability segment to command 35.0% share in the sand testing equipments market in 2025.

Explore Similar Insights

Future Market Insights

Sand Testing Equipments Market

Chat With MaRIA

Chat With

MaRIA

Hi There, I am MaRIA, Your Market Research Intelligence Assistant. How may I help you?