Wi-Fi Test Equipment Market Size and Share Forecast Outlook 2025 to 2035

The Wi-Fi Test Equipment Market is estimated to be valued at USD 15.6 billion in 2025 and is projected to reach USD 31.1 billion by 2035, registering a compound annual growth rate (CAGR) of 7.1% over the forecast period.
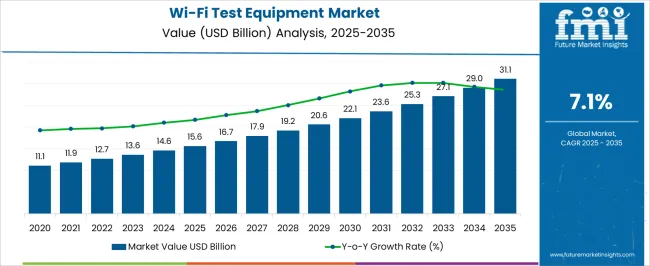
Quick Stats for Wi-Fi Test Equipment Market

  • Wi-Fi Test Equipment Market Industry Value (2025): USD 15.6 billion
  • Wi-Fi Test Equipment Market Forecast Value (2035): USD 31.1 billion
  • Wi-Fi Test Equipment Market Forecast CAGR: 7.1%
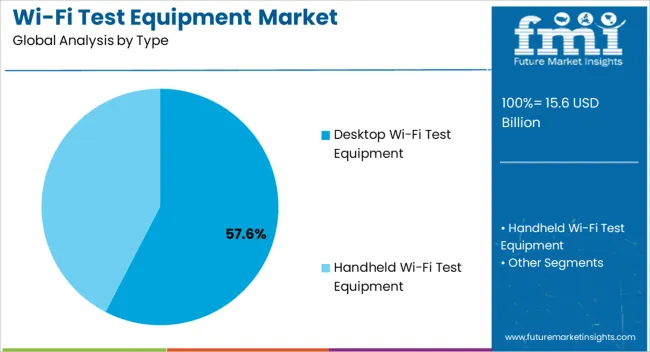
  • Leading Segment in Wi-Fi Test Equipment Market in 2025: Desktop Wi-Fi Test Equipment (57.6%)
  • Key Growth Region in Wi-Fi Test Equipment Market: North America, Asia-Pacific, Europe
  • Top Key Players in Wi-Fi Test Equipment Market: Danaher Corporation, Cobham PLC, NetScout Systems Inc., Viavi Solutions Inc., Spirent Communications, Ixia, Greenlee, Anritsu Electric Corporation, TESCOM, Dycon, Vonaq Ltd

Wi Fi Test Equipment Market Market Value Analysis

Metric Value
Wi-Fi Test Equipment Market Estimated Value in (2025 E) USD 15.6 billion
Wi-Fi Test Equipment Market Forecast Value in (2035 F) USD 31.1 billion
Forecast CAGR (2025 to 2035) 7.1%

Rationale for Segmental Growth in the Wi-Fi Test Equipment Market

The Wi-Fi test equipment market is expanding steadily, supported by the rapid adoption of high-speed wireless technologies and the growing complexity of communication networks. Industry updates and company disclosures have emphasized the importance of advanced testing solutions to validate performance, security, and interoperability across diverse Wi-Fi standards, including Wi-Fi 6 and Wi-Fi 7. The proliferation of connected devices in both consumer and enterprise environments has created heightened demand for reliable Wi-Fi testing to ensure seamless user experience.

Research investments by technology providers have focused on enhancing throughput measurement, latency analysis, and coverage optimization, fueling product innovation in this space. Additionally, the increasing deployment of smart infrastructure, IoT ecosystems, and cloud-based services has underscored the need for comprehensive Wi-Fi validation tools.

Future growth is expected to be driven by the integration of artificial intelligence into testing solutions, real-time analytics, and the expansion of 5G-to-Wi-Fi interoperability assessments. Segmental momentum is anticipated to be led by desktop Wi-Fi test equipment, R&D applications, and adoption among large enterprises due to their infrastructure needs and scale of operations.
Segmental Analysis

Insights into the Type Segment: Desktop Wi-Fi Test Equipment

Wi Fi Test Equipment Market Analysis By Type

The Desktop Wi-Fi Test Equipment segment is projected to contribute 57.60% of the market revenue in 2025, maintaining its position as the dominant type. Growth in this segment has been influenced by the precision, stability, and comprehensive testing capabilities that desktop systems provide compared to portable alternatives. These systems have been widely used for advanced testing scenarios, including throughput, spectral efficiency, and interference analysis, which require stable laboratory conditions.

Reports from technology developers have noted that desktop platforms are preferred in environments where long-term testing, simulation, and certification are critical. The ability to integrate with other laboratory instruments and provide scalable testing options has further reinforced their adoption.

As Wi-Fi standards continue to evolve and become more complex, desktop Wi-Fi test equipment is expected to remain indispensable for ensuring compliance, reliability, and performance validation.
Insights into the Application Segment: Research & Development

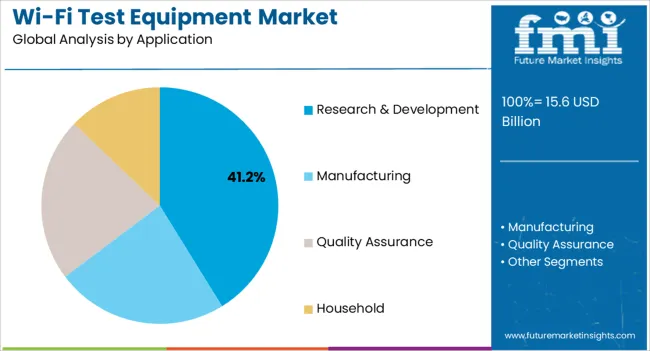
Wi Fi Test Equipment Market Analysis By Application

The Research & Development segment is projected to account for 41.20% of the Wi-Fi test equipment market revenue in 2025, reflecting its critical role in product innovation and technology advancement. R&D teams in technology firms, chipset manufacturers, and academic institutions have relied heavily on Wi-Fi testing solutions to validate new protocols and ensure seamless device connectivity. Industry publications and company reports have indicated significant investments in R&D facilities to accelerate the commercialization of Wi-Fi 6E and Wi-Fi 7 technologies.

These efforts have been reinforced by growing demand for enhanced spectrum utilization, reduced latency, and improved device coexistence in dense environments. Moreover, research labs and development centers have required advanced test equipment to simulate real-world conditions and validate emerging use cases such as AR/VR and industrial IoT.

With continued innovation driving the wireless ecosystem, the Research & Development segment is expected to sustain its leadership in application adoption.
Insights into the Organization Size Segment: Large Enterprises

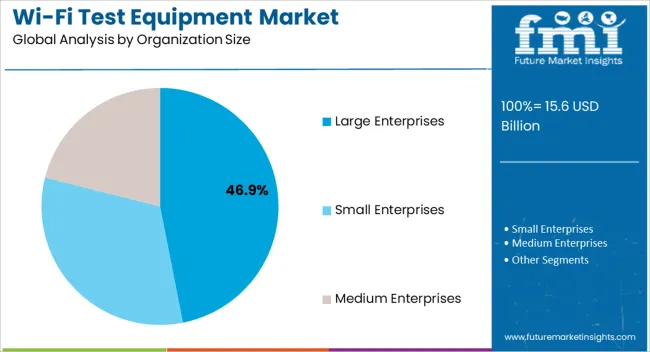
Wi Fi Test Equipment Market Analysis By Organization Size

The Large Enterprises segment is projected to contribute 46.90% of the Wi-Fi test equipment market revenue in 2025, securing its place as the leading organizational size category. Growth in this segment has been driven by the large-scale deployment of Wi-Fi infrastructure in corporate campuses, manufacturing facilities, and data-intensive industries. Large enterprises have prioritized advanced test equipment to ensure network stability, cybersecurity compliance, and uninterrupted connectivity for mission-critical operations.

Investor updates and corporate reports have highlighted growing IT infrastructure budgets among large organizations, enabling investment in high-precision testing systems. Furthermore, large enterprises have increasingly incorporated Wi-Fi testing into their digital transformation strategies to support IoT device integration and hybrid work models.

The scale of operations and the necessity of maintaining reliable, secure wireless connectivity have positioned large enterprises as consistent demand drivers, ensuring that this segment maintains its leading role in the market.

Current Market Dynamics Pertaining to Wi-Fi Test Equipment Market

  • The Wi-Fi test equipment also has this amazing capability of optimizing our wireless network and ascertains the fact that wireless network optimization is not a costly process. This is expected to surge the sales of Wi-Fi test equipment.
  • The sales of Wi-Fi test equipment are driven by the fact that this equipment tells us the type of encryption a wireless network is secured with. This becomes crucial when certain businesses are dealing with critical and secret information.
  • The Wi-Fi test equipment assists in analyzing the network coverage. This is done by creating a heatmap, and through this heatmap, we can identify the weak spots of the signal. This is anticipated to increase the Wi-Fi test equipment market size.
  • There is growth in the IoT industry, which has led to all the major players making use of Wi-Fi test equipment. Increased consumption of electronic devices like smartphones, laptops, and tablets has also led to an increase in the adoption of Wi-Fi test equipment.

The Restraints of the Wi-Fi Test Equipment Market Growth

There are certain entry barriers like lack of technological advances in developing and developed countries, which has not allowed the wi-fi test equipment market to grow to its potential. The test time of the wi-fi test equipment is quite low, because of which there might be issues of reduced efficiency.

Regional Analysis

Performance of the North American Wi-Fi Test Equipment Market

North America, which currently has a market share of 36% and is the leading market, is expected to dominate the market during the forecast period.

Increased adoption of Wi-Fi test equipment by small and medium enterprises is expected to drive the Wi-Fi test equipment market. A rapid increase in the usage of electronic devices is also expected to drive the market in the region.
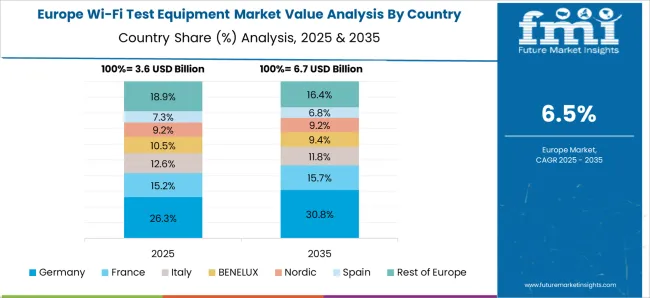
Performance of the European Wi-Fi Test Equipment Market

Wi Fi Test Equipment Market Europe Country Market Share Analysis, 2025 & 2035

Europe, which currently has a market share of 24%, is expected to be one of the most significant markets for Wi-Fi test equipment.

Increased focus on data security along with the growth of the IoT industry in this region is expected to drive the wi-fi test equipment market. Rapid technological advancements in this region are also expected to surge the market for Wi-Fi test equipment.

Category Wise Insights

Quality Assurance Segment to Witness Major Demand

These tools can be used to help companies not only guarantee their items but also to incorporate them into product development as well as assurance procedures. Wi-Fi Test Suite open-source parts are made accessible to the market to help promote the Wi-Fi Alliance's scalability and quality agenda. Wi-Fi Test Suite supports technological evolution by adapting to a wide range of distinct, diverse, and cutting-edge gadgets. The quality assurance segment is likely to grow rapidly in the future years.

The Start-up Ecosystem in the Wi-Fi Test Equipment Market

With raid developments happening in the electronics and IoT industry, the start-up community in the Wi-Fi test equipment market is actively pursuing innovative ways to make internet connections more accessible. Some of the start-ups are Meter, Plume, eero, and Celona.

These start-ups are mainly focusing on making the internet using Wi-Fi test equipment omnipresent, just like air and water. These companies are also working on a full-stack approach that combines hardware, software, and operations so that any company can function seamlessly on a reliable network.
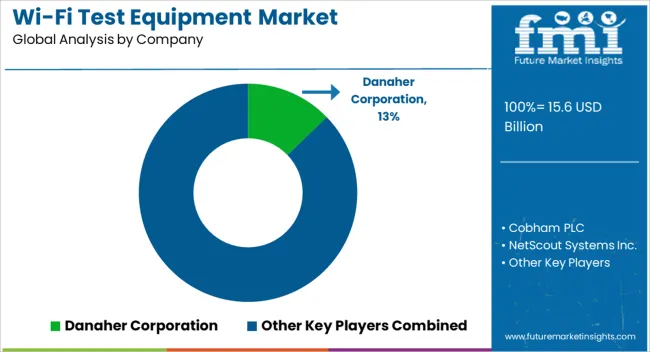
Some of the Key Market Players in the Wi-Fi Test Equipment Market

Wi Fi Test Equipment Market Analysis By Company

Some of the key players in the Wi-Fi test equipment market are Danaher Corporation, Cobham PLC, NetScout Systems Inc., Viavi solutions Inc., Spirent Communications, and Ixia.

With the developments shaping up across industries, and these industries looking for more options for effective Wi-Fi solutions such as Wi-Fi troubleshooting, Wi-Fi modem tester, Wi-Fi adapter tester, Wi-Fi compliance tester. All the major players are now focusing on increasing their operations either through mergers and acquisitions or by setting up new factories in various parts of the world. This will ensure that these major players continue providing seamless Wi-Fi service to their clients.

  • In July 2025, Viavi provided benchmarking and validation for Global O-RAN PlugFest, demonstrating technology maturity, performance, and security.
  • In February 2025, NetScout launched nGeniusEDGE server to quickly identify and resolve user experience performance issues.
  • Spirent Communications plc., the premier provider of testing and verification solutions for next-generation equipment and networks, introduced an innovative "Send Us Your Device" Test as a Service (TaaS) solution for Wi-Fi clients in August 2025. The offering, which is the first of its type from a producer of powerful Wi-Fi testbeds, provides organizations with access to the sophisticated features of Spirent's OCTOBOX emulation and testing system.
  • Keysight Technologies Inc., a global technology leader that provides innovative design and assurance solutions that help speed up breakthroughs to link and safeguard the world, implemented in May 2025 that Celona has chosen Keysight's Open RAN Architect (KORA) solution portfolio to confirm the efficacy and dependability of 5G private network implementations for firms.

Report Scope

Report Attribute Details
Growth Rate CAGR of 7.5% from 2025 to 2035
Wi-Fi Test Equipment Market Valuation as on 2025 USD USD 15.6 billion
Wi-Fi Test Equipment Market Anticipated Forecast Value (2035) USD USD 31.1 billion
Base Year for Estimation 2025
Historical Data 2020 to 2025
Forecast Period 2025 to 2035
Quantitative Units Revenue in USD million and CAGR from 2025 to 2035
Report Coverage Revenue Forecast, Volume Forecast, Company Ranking, Competitive Landscape, Growth Factors, Trends and Pricing Analysis
Segments Covered Type, Application, Organization Size, Region
Regions Covered North America; Latin America; Western Europe; Eastern Europe; South Asia & Pacific; East Asia; Middle East & Africa
Key Countries Profiled United States, Canada, Brazil, Mexico, Germany, United Kingdom, France, Spain, Italy, Poland, Russia, Czech Republic, Romania, India, Bangladesh, Australia, New Zealand, China, Japan, South Korea, GCC Countries, South Africa, Israel
Key Companies Profiled Danaher Corporation; Cobham PLC; NetScout Systems Inc.; Viavi solutions Inc.; Spirent Communications; Ixia.
Customization & Pricing Available Upon Request

Key Segments Profiled in the Wi-Fi Test Equipment Market Survey

By Type:

  • Desktop Wi-Fi Test Equipment
  • Handheld Wi-Fi Test Equipment

By Application:

  • Research & Development
  • Manufacturing
  • Quality Assurance
  • Household

By Organization Size:

  • Small Enterprises
  • Medium Enterprises
  • Large Enterprises

By Region:

  • North America
  • Latin America
  • Western Europe
  • Eastern Europe
  • South Asia & Pacific
  • East Asia
  • Middle East & Africa

Table of Content

  1. Executive Summary
    • Global Market Outlook
    • Demand-side Trends
    • Supply-side Trends
    • Technology Roadmap Analysis
    • Analysis and Recommendations
  2. Market Overview
    • Market Coverage / Taxonomy
    • Market Definition / Scope / Limitations
  3. Market Background
    • Market Dynamics
      • Drivers
      • Restraints
      • Opportunity
      • Trends
    • Scenario Forecast
      • Demand in Optimistic Scenario
      • Demand in Likely Scenario
      • Demand in Conservative Scenario
    • Opportunity Map Analysis
    • Product Life Cycle Analysis
    • Supply Chain Analysis
    • Investment Feasibility Matrix
    • Value Chain Analysis
    • PESTLE and Porter’s Analysis
    • Regulatory Landscape
    • Regional Parent Market Outlook
    • Production and Consumption Statistics
    • Import and Export Statistics
  4. Global Market Analysis 2020 to 2024 and Forecast, 2025 to 2035
    • Historical Market Size Value (USD Million) Analysis, 2020 to 2024
    • Current and Future Market Size Value (USD Million) Projections, 2025 to 2035
      • Y-o-Y Growth Trend Analysis
      • Absolute $ Opportunity Analysis
  5. Global Market Pricing Analysis 2020 to 2024 and Forecast 2025 to 2035
  6. Global Market Analysis 2020 to 2024 and Forecast 2025 to 2035, By Type
    • Introduction / Key Findings
    • Historical Market Size Value (USD Million) Analysis By Type , 2020 to 2024
    • Current and Future Market Size Value (USD Million) Analysis and Forecast By Type , 2025 to 2035
      • Desktop
      • Handheld
    • Y-o-Y Growth Trend Analysis By Type , 2020 to 2024
    • Absolute $ Opportunity Analysis By Type , 2025 to 2035
  7. Global Market Analysis 2020 to 2024 and Forecast 2025 to 2035, By Application
    • Introduction / Key Findings
    • Historical Market Size Value (USD Million) Analysis By Application, 2020 to 2024
    • Current and Future Market Size Value (USD Million) Analysis and Forecast By Application, 2025 to 2035
      • Research & Development
      • Manufacturing
      • Quality Assurance
      • Household
    • Y-o-Y Growth Trend Analysis By Application, 2020 to 2024
    • Absolute $ Opportunity Analysis By Application, 2025 to 2035
  8. Global Market Analysis 2020 to 2024 and Forecast 2025 to 2035, By Organization Size
    • Introduction / Key Findings
    • Historical Market Size Value (USD Million) Analysis By Organization Size, 2020 to 2024
    • Current and Future Market Size Value (USD Million) Analysis and Forecast By Organization Size, 2025 to 2035
      • Large Enterprises
      • Small Enterprises
      • Medium Enterprises
    • Y-o-Y Growth Trend Analysis By Organization Size, 2020 to 2024
    • Absolute $ Opportunity Analysis By Organization Size, 2025 to 2035
  9. Global Market Analysis 2020 to 2024 and Forecast 2025 to 2035, By Region
    • Introduction
    • Historical Market Size Value (USD Million) Analysis By Region, 2020 to 2024
    • Current Market Size Value (USD Million) Analysis and Forecast By Region, 2025 to 2035
      • North America
      • Latin America
      • Western Europe
      • Eastern Europe
      • East Asia
      • South Asia and Pacific
      • Middle East & Africa
    • Market Attractiveness Analysis By Region
  10. North America Market Analysis 2020 to 2024 and Forecast 2025 to 2035, By Country
    • Historical Market Size Value (USD Million) Trend Analysis By Market Taxonomy, 2020 to 2024
    • Market Size Value (USD Million) Forecast By Market Taxonomy, 2025 to 2035
      • By Country
        • USA
        • Canada
        • Mexico
      • By Type
      • By Application
      • By Organization Size
    • Market Attractiveness Analysis
      • By Country
      • By Type
      • By Application
      • By Organization Size
    • Key Takeaways
  11. Latin America Market Analysis 2020 to 2024 and Forecast 2025 to 2035, By Country
    • Historical Market Size Value (USD Million) Trend Analysis By Market Taxonomy, 2020 to 2024
    • Market Size Value (USD Million) Forecast By Market Taxonomy, 2025 to 2035
      • By Country
        • Brazil
        • Chile
        • Rest of Latin America
      • By Type
      • By Application
      • By Organization Size
    • Market Attractiveness Analysis
      • By Country
      • By Type
      • By Application
      • By Organization Size
    • Key Takeaways
  12. Western Europe Market Analysis 2020 to 2024 and Forecast 2025 to 2035, By Country
    • Historical Market Size Value (USD Million) Trend Analysis By Market Taxonomy, 2020 to 2024
    • Market Size Value (USD Million) Forecast By Market Taxonomy, 2025 to 2035
      • By Country
        • Germany
        • UK
        • Italy
        • Spain
        • France
        • Nordic
        • BENELUX
        • Rest of Western Europe
      • By Type
      • By Application
      • By Organization Size
    • Market Attractiveness Analysis
      • By Country
      • By Type
      • By Application
      • By Organization Size
    • Key Takeaways
  13. Eastern Europe Market Analysis 2020 to 2024 and Forecast 2025 to 2035, By Country
    • Historical Market Size Value (USD Million) Trend Analysis By Market Taxonomy, 2020 to 2024
    • Market Size Value (USD Million) Forecast By Market Taxonomy, 2025 to 2035
      • By Country
        • Russia
        • Poland
        • Hungary
        • Balkan & Baltic
        • Rest of Eastern Europe
      • By Type
      • By Application
      • By Organization Size
    • Market Attractiveness Analysis
      • By Country
      • By Type
      • By Application
      • By Organization Size
    • Key Takeaways
  14. East Asia Market Analysis 2020 to 2024 and Forecast 2025 to 2035, By Country
    • Historical Market Size Value (USD Million) Trend Analysis By Market Taxonomy, 2020 to 2024
    • Market Size Value (USD Million) Forecast By Market Taxonomy, 2025 to 2035
      • By Country
        • China
        • Japan
        • South Korea
      • By Type
      • By Application
      • By Organization Size
    • Market Attractiveness Analysis
      • By Country
      • By Type
      • By Application
      • By Organization Size
    • Key Takeaways
  15. South Asia and Pacific Market Analysis 2020 to 2024 and Forecast 2025 to 2035, By Country
    • Historical Market Size Value (USD Million) Trend Analysis By Market Taxonomy, 2020 to 2024
    • Market Size Value (USD Million) Forecast By Market Taxonomy, 2025 to 2035
      • By Country
        • India
        • ASEAN
        • Australia & New Zealand
        • Rest of South Asia and Pacific
      • By Type
      • By Application
      • By Organization Size
    • Market Attractiveness Analysis
      • By Country
      • By Type
      • By Application
      • By Organization Size
    • Key Takeaways
  16. Middle East & Africa Market Analysis 2020 to 2024 and Forecast 2025 to 2035, By Country
    • Historical Market Size Value (USD Million) Trend Analysis By Market Taxonomy, 2020 to 2024
    • Market Size Value (USD Million) Forecast By Market Taxonomy, 2025 to 2035
      • By Country
        • Kingdom of Saudi Arabia
        • Other GCC Countries
        • Turkiye
        • South Africa
        • Other African Union
        • Rest of Middle East & Africa
      • By Type
      • By Application
      • By Organization Size
    • Market Attractiveness Analysis
      • By Country
      • By Type
      • By Application
      • By Organization Size
    • Key Takeaways
  17. Key Countries Market Analysis
    • USA
      • Pricing Analysis
      • Market Share Analysis, 2024
        • By Type
        • By Application
        • By Organization Size
    • Canada
      • Pricing Analysis
      • Market Share Analysis, 2024
        • By Type
        • By Application
        • By Organization Size
    • Mexico
      • Pricing Analysis
      • Market Share Analysis, 2024
        • By Type
        • By Application
        • By Organization Size
    • Brazil
      • Pricing Analysis
      • Market Share Analysis, 2024
        • By Type
        • By Application
        • By Organization Size
    • Chile
      • Pricing Analysis
      • Market Share Analysis, 2024
        • By Type
        • By Application
        • By Organization Size
    • Germany
      • Pricing Analysis
      • Market Share Analysis, 2024
        • By Type
        • By Application
        • By Organization Size
    • UK
      • Pricing Analysis
      • Market Share Analysis, 2024
        • By Type
        • By Application
        • By Organization Size
    • Italy
      • Pricing Analysis
      • Market Share Analysis, 2024
        • By Type
        • By Application
        • By Organization Size
    • Spain
      • Pricing Analysis
      • Market Share Analysis, 2024
        • By Type
        • By Application
        • By Organization Size
    • France
      • Pricing Analysis
      • Market Share Analysis, 2024
        • By Type
        • By Application
        • By Organization Size
    • India
      • Pricing Analysis
      • Market Share Analysis, 2024
        • By Type
        • By Application
        • By Organization Size
    • ASEAN
      • Pricing Analysis
      • Market Share Analysis, 2024
        • By Type
        • By Application
        • By Organization Size
    • Australia & New Zealand
      • Pricing Analysis
      • Market Share Analysis, 2024
        • By Type
        • By Application
        • By Organization Size
    • China
      • Pricing Analysis
      • Market Share Analysis, 2024
        • By Type
        • By Application
        • By Organization Size
    • Japan
      • Pricing Analysis
      • Market Share Analysis, 2024
        • By Type
        • By Application
        • By Organization Size
    • South Korea
      • Pricing Analysis
      • Market Share Analysis, 2024
        • By Type
        • By Application
        • By Organization Size
    • Russia
      • Pricing Analysis
      • Market Share Analysis, 2024
        • By Type
        • By Application
        • By Organization Size
    • Poland
      • Pricing Analysis
      • Market Share Analysis, 2024
        • By Type
        • By Application
        • By Organization Size
    • Hungary
      • Pricing Analysis
      • Market Share Analysis, 2024
        • By Type
        • By Application
        • By Organization Size
    • Kingdom of Saudi Arabia
      • Pricing Analysis
      • Market Share Analysis, 2024
        • By Type
        • By Application
        • By Organization Size
    • Turkiye
      • Pricing Analysis
      • Market Share Analysis, 2024
        • By Type
        • By Application
        • By Organization Size
    • South Africa
      • Pricing Analysis
      • Market Share Analysis, 2024
        • By Type
        • By Application
        • By Organization Size
  18. Market Structure Analysis
    • Competition Dashboard
    • Competition Benchmarking
    • Market Share Analysis of Top Players
      • By Regional
      • By Type
      • By Application
      • By Organization Size
  19. Competition Analysis
    • Competition Deep Dive
      • Danaher Corporation
        • Overview
        • Product Portfolio
        • Profitability by Market Segments (Product/Age /Sales Channel/Region)
        • Sales Footprint
        • Strategy Overview
          • Marketing Strategy
          • Product Strategy
          • Channel Strategy
      • Cobham PLC
      • NetScout Systems Inc.
      • Viavi Solutions Inc.
      • Spirent Communications
      • Ixia
      • Greenlee
      • Anritsu Electric Corporation
      • TESCOM
      • Dycon
      • Vonaq Ltd
  20. Assumptions & Acronyms Used
  21. Research Methodology

List of Tables

  • Table 1: Global Market Value (USD Million) Forecast by Region, 2020 to 2035
  • Table 2: Global Market Value (USD Million) Forecast by Type , 2020 to 2035
  • Table 3: Global Market Value (USD Million) Forecast by Application, 2020 to 2035
  • Table 4: Global Market Value (USD Million) Forecast by Organization Size, 2020 to 2035
  • Table 5: North America Market Value (USD Million) Forecast by Country, 2020 to 2035
  • Table 6: North America Market Value (USD Million) Forecast by Type , 2020 to 2035
  • Table 7: North America Market Value (USD Million) Forecast by Application, 2020 to 2035
  • Table 8: North America Market Value (USD Million) Forecast by Organization Size, 2020 to 2035
  • Table 9: Latin America Market Value (USD Million) Forecast by Country, 2020 to 2035
  • Table 10: Latin America Market Value (USD Million) Forecast by Type , 2020 to 2035
  • Table 11: Latin America Market Value (USD Million) Forecast by Application, 2020 to 2035
  • Table 12: Latin America Market Value (USD Million) Forecast by Organization Size, 2020 to 2035
  • Table 13: Western Europe Market Value (USD Million) Forecast by Country, 2020 to 2035
  • Table 14: Western Europe Market Value (USD Million) Forecast by Type , 2020 to 2035
  • Table 15: Western Europe Market Value (USD Million) Forecast by Application, 2020 to 2035
  • Table 16: Western Europe Market Value (USD Million) Forecast by Organization Size, 2020 to 2035
  • Table 17: Eastern Europe Market Value (USD Million) Forecast by Country, 2020 to 2035
  • Table 18: Eastern Europe Market Value (USD Million) Forecast by Type , 2020 to 2035
  • Table 19: Eastern Europe Market Value (USD Million) Forecast by Application, 2020 to 2035
  • Table 20: Eastern Europe Market Value (USD Million) Forecast by Organization Size, 2020 to 2035
  • Table 21: East Asia Market Value (USD Million) Forecast by Country, 2020 to 2035
  • Table 22: East Asia Market Value (USD Million) Forecast by Type , 2020 to 2035
  • Table 23: East Asia Market Value (USD Million) Forecast by Application, 2020 to 2035
  • Table 24: East Asia Market Value (USD Million) Forecast by Organization Size, 2020 to 2035
  • Table 25: South Asia and Pacific Market Value (USD Million) Forecast by Country, 2020 to 2035
  • Table 26: South Asia and Pacific Market Value (USD Million) Forecast by Type , 2020 to 2035
  • Table 27: South Asia and Pacific Market Value (USD Million) Forecast by Application, 2020 to 2035
  • Table 28: South Asia and Pacific Market Value (USD Million) Forecast by Organization Size, 2020 to 2035
  • Table 29: Middle East & Africa Market Value (USD Million) Forecast by Country, 2020 to 2035
  • Table 30: Middle East & Africa Market Value (USD Million) Forecast by Type , 2020 to 2035
  • Table 31: Middle East & Africa Market Value (USD Million) Forecast by Application, 2020 to 2035
  • Table 32: Middle East & Africa Market Value (USD Million) Forecast by Organization Size, 2020 to 2035

List of Figures

  • Figure 1: Global Market Pricing Analysis
  • Figure 2: Global Market Value (USD Million) Forecast 2020-2035
  • Figure 3: Global Market Value Share and BPS Analysis by Type , 2025 and 2035
  • Figure 4: Global Market Y-o-Y Growth Comparison by Type , 2025-2035
  • Figure 5: Global Market Attractiveness Analysis by Type
  • Figure 6: Global Market Value Share and BPS Analysis by Application, 2025 and 2035
  • Figure 7: Global Market Y-o-Y Growth Comparison by Application, 2025-2035
  • Figure 8: Global Market Attractiveness Analysis by Application
  • Figure 9: Global Market Value Share and BPS Analysis by Organization Size, 2025 and 2035
  • Figure 10: Global Market Y-o-Y Growth Comparison by Organization Size, 2025-2035
  • Figure 11: Global Market Attractiveness Analysis by Organization Size
  • Figure 12: Global Market Value (USD Million) Share and BPS Analysis by Region, 2025 and 2035
  • Figure 13: Global Market Y-o-Y Growth Comparison by Region, 2025-2035
  • Figure 14: Global Market Attractiveness Analysis by Region
  • Figure 15: North America Market Incremental Dollar Opportunity, 2025-2035
  • Figure 16: Latin America Market Incremental Dollar Opportunity, 2025-2035
  • Figure 17: Western Europe Market Incremental Dollar Opportunity, 2025-2035
  • Figure 18: Eastern Europe Market Incremental Dollar Opportunity, 2025-2035
  • Figure 19: East Asia Market Incremental Dollar Opportunity, 2025-2035
  • Figure 20: South Asia and Pacific Market Incremental Dollar Opportunity, 2025-2035
  • Figure 21: Middle East & Africa Market Incremental Dollar Opportunity, 2025-2035
  • Figure 22: North America Market Value Share and BPS Analysis by Country, 2025 and 2035
  • Figure 23: North America Market Value Share and BPS Analysis by Type , 2025 and 2035
  • Figure 24: North America Market Y-o-Y Growth Comparison by Type , 2025-2035
  • Figure 25: North America Market Attractiveness Analysis by Type
  • Figure 26: North America Market Value Share and BPS Analysis by Application, 2025 and 2035
  • Figure 27: North America Market Y-o-Y Growth Comparison by Application, 2025-2035
  • Figure 28: North America Market Attractiveness Analysis by Application
  • Figure 29: North America Market Value Share and BPS Analysis by Organization Size, 2025 and 2035
  • Figure 30: North America Market Y-o-Y Growth Comparison by Organization Size, 2025-2035
  • Figure 31: North America Market Attractiveness Analysis by Organization Size
  • Figure 32: Latin America Market Value Share and BPS Analysis by Country, 2025 and 2035
  • Figure 33: Latin America Market Value Share and BPS Analysis by Type , 2025 and 2035
  • Figure 34: Latin America Market Y-o-Y Growth Comparison by Type , 2025-2035
  • Figure 35: Latin America Market Attractiveness Analysis by Type
  • Figure 36: Latin America Market Value Share and BPS Analysis by Application, 2025 and 2035
  • Figure 37: Latin America Market Y-o-Y Growth Comparison by Application, 2025-2035
  • Figure 38: Latin America Market Attractiveness Analysis by Application
  • Figure 39: Latin America Market Value Share and BPS Analysis by Organization Size, 2025 and 2035
  • Figure 40: Latin America Market Y-o-Y Growth Comparison by Organization Size, 2025-2035
  • Figure 41: Latin America Market Attractiveness Analysis by Organization Size
  • Figure 42: Western Europe Market Value Share and BPS Analysis by Country, 2025 and 2035
  • Figure 43: Western Europe Market Value Share and BPS Analysis by Type , 2025 and 2035
  • Figure 44: Western Europe Market Y-o-Y Growth Comparison by Type , 2025-2035
  • Figure 45: Western Europe Market Attractiveness Analysis by Type
  • Figure 46: Western Europe Market Value Share and BPS Analysis by Application, 2025 and 2035
  • Figure 47: Western Europe Market Y-o-Y Growth Comparison by Application, 2025-2035
  • Figure 48: Western Europe Market Attractiveness Analysis by Application
  • Figure 49: Western Europe Market Value Share and BPS Analysis by Organization Size, 2025 and 2035
  • Figure 50: Western Europe Market Y-o-Y Growth Comparison by Organization Size, 2025-2035
  • Figure 51: Western Europe Market Attractiveness Analysis by Organization Size
  • Figure 52: Eastern Europe Market Value Share and BPS Analysis by Country, 2025 and 2035
  • Figure 53: Eastern Europe Market Value Share and BPS Analysis by Type , 2025 and 2035
  • Figure 54: Eastern Europe Market Y-o-Y Growth Comparison by Type , 2025-2035
  • Figure 55: Eastern Europe Market Attractiveness Analysis by Type
  • Figure 56: Eastern Europe Market Value Share and BPS Analysis by Application, 2025 and 2035
  • Figure 57: Eastern Europe Market Y-o-Y Growth Comparison by Application, 2025-2035
  • Figure 58: Eastern Europe Market Attractiveness Analysis by Application
  • Figure 59: Eastern Europe Market Value Share and BPS Analysis by Organization Size, 2025 and 2035
  • Figure 60: Eastern Europe Market Y-o-Y Growth Comparison by Organization Size, 2025-2035
  • Figure 61: Eastern Europe Market Attractiveness Analysis by Organization Size
  • Figure 62: East Asia Market Value Share and BPS Analysis by Country, 2025 and 2035
  • Figure 63: East Asia Market Value Share and BPS Analysis by Type , 2025 and 2035
  • Figure 64: East Asia Market Y-o-Y Growth Comparison by Type , 2025-2035
  • Figure 65: East Asia Market Attractiveness Analysis by Type
  • Figure 66: East Asia Market Value Share and BPS Analysis by Application, 2025 and 2035
  • Figure 67: East Asia Market Y-o-Y Growth Comparison by Application, 2025-2035
  • Figure 68: East Asia Market Attractiveness Analysis by Application
  • Figure 69: East Asia Market Value Share and BPS Analysis by Organization Size, 2025 and 2035
  • Figure 70: East Asia Market Y-o-Y Growth Comparison by Organization Size, 2025-2035
  • Figure 71: East Asia Market Attractiveness Analysis by Organization Size
  • Figure 72: South Asia and Pacific Market Value Share and BPS Analysis by Country, 2025 and 2035
  • Figure 73: South Asia and Pacific Market Value Share and BPS Analysis by Type , 2025 and 2035
  • Figure 74: South Asia and Pacific Market Y-o-Y Growth Comparison by Type , 2025-2035
  • Figure 75: South Asia and Pacific Market Attractiveness Analysis by Type
  • Figure 76: South Asia and Pacific Market Value Share and BPS Analysis by Application, 2025 and 2035
  • Figure 77: South Asia and Pacific Market Y-o-Y Growth Comparison by Application, 2025-2035
  • Figure 78: South Asia and Pacific Market Attractiveness Analysis by Application
  • Figure 79: South Asia and Pacific Market Value Share and BPS Analysis by Organization Size, 2025 and 2035
  • Figure 80: South Asia and Pacific Market Y-o-Y Growth Comparison by Organization Size, 2025-2035
  • Figure 81: South Asia and Pacific Market Attractiveness Analysis by Organization Size
  • Figure 82: Middle East & Africa Market Value Share and BPS Analysis by Country, 2025 and 2035
  • Figure 83: Middle East & Africa Market Value Share and BPS Analysis by Type , 2025 and 2035
  • Figure 84: Middle East & Africa Market Y-o-Y Growth Comparison by Type , 2025-2035
  • Figure 85: Middle East & Africa Market Attractiveness Analysis by Type
  • Figure 86: Middle East & Africa Market Value Share and BPS Analysis by Application, 2025 and 2035
  • Figure 87: Middle East & Africa Market Y-o-Y Growth Comparison by Application, 2025-2035
  • Figure 88: Middle East & Africa Market Attractiveness Analysis by Application
  • Figure 89: Middle East & Africa Market Value Share and BPS Analysis by Organization Size, 2025 and 2035
  • Figure 90: Middle East & Africa Market Y-o-Y Growth Comparison by Organization Size, 2025-2035
  • Figure 91: Middle East & Africa Market Attractiveness Analysis by Organization Size
  • Figure 92: Global Market - Tier Structure Analysis
  • Figure 93: Global Market - Company Share Analysis

Frequently Asked Questions

How big is the Wi-Fi test equipment market in 2025?

The global Wi-Fi test equipment market is estimated to be valued at USD 15.6 billion in 2025.

What will be the size of Wi-Fi test equipment market in 2035?

The market size for the Wi-Fi test equipment market is projected to reach USD 31.1 billion by 2035.

How much will be the Wi-Fi test equipment market growth between 2025 and 2035?

The Wi-Fi test equipment market is expected to grow at a 7.1% CAGR between 2025 and 2035.

What are the key product types in the Wi-Fi test equipment market?

The key product types in Wi-Fi test equipment market are desktop Wi-Fi test equipment and handheld Wi-Fi test equipment.

Which application segment to contribute significant share in the Wi-Fi test equipment market in 2025?

In terms of application, research & development segment to command 41.2% share in the Wi-Fi test equipment market in 2025.

Explore Similar Insights

Future Market Insights

Wi-Fi Test Equipment Market

Chat With MaRIA

Chat With

MaRIA

Hi There, I am MaRIA, Your Market Research Intelligence Assistant. How may I help you?