Radiometric Detectors Market Size and Share Forecast Outlook 2025 to 2035

The Radiometric Detectors Market is estimated to be valued at USD 3.6 billion in 2025 and is projected to reach USD 7.0 billion by 2035, registering a compound annual growth rate (CAGR) of 6.7% over the forecast period.
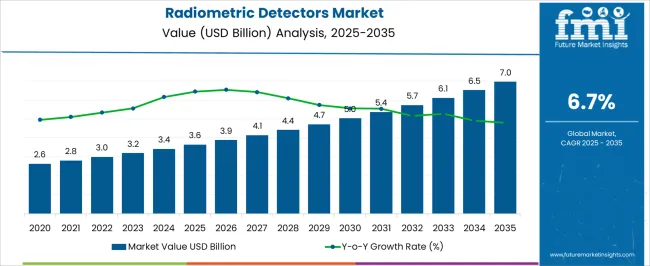
Quick Stats for Radiometric Detectors Market

  • Radiometric Detectors Market Value (2025): USD 3.6 billion
  • Radiometric Detectors Market Forecast Value (2035): USD 7.0 billion
  • Radiometric Detectors Market Forecast CAGR: 6.7%
  • Leading Segment in Radiometric Detectors Market in 2025: Semiconductor Detectors (46.8%)
  • Key Growth Regions in Radiometric Detectors Market: North America, Asia-Pacific, Europe
  • Top Key Players in Radiometric Detectors Market: Thermo Fisher Scientific Inc., Canberra Industries, Inc. (a part of Mirion Technologies), Mirion Technologies, Inc., Ludlum Measurements, Inc., AMETEK, Inc. (including Ortec, SII, and Landauer), Becton, Dickinson and Company (BD), FLIR Systems, Inc., Honeywell International Inc., Berthold Technologies GmbH & Co. KG, Arrow-Tech, Inc.
Radiometric Detectors Market Market Value Analysis

Radiometric Detectors Market Key Takeaways

Metric Value
Radiometric Detectors Market Estimated Value in (2025 E) USD 3.6 billion
Radiometric Detectors Market Forecast Value in (2035 F) USD 7.0 billion
Forecast CAGR (2025 to 2035) 6.7%

Why is the Radiometric Detectors Market Growing?

The Radiometric Detectors market is experiencing consistent growth due to the rising adoption of advanced detection technologies in scientific research, industrial monitoring, and healthcare applications. The market is being driven by the need for precise measurement of radiation levels, rapid data acquisition, and reliable performance across diverse operational environments. Increasing investments in biotechnology and pharmaceutical research, along with the demand for high-sensitivity detection in laboratory and industrial settings, are shaping the market trajectory.

Technological advancements, including enhanced semiconductor materials, compact detector designs, and integration with automated data systems, are facilitating broader application of radiometric detection solutions. The growing focus on safety compliance and regulatory monitoring has also accelerated demand, particularly in research institutes and industrial facilities.

Future opportunities are expected in integrating these detectors with IoT-enabled monitoring systems and analytical software platforms, which allow remote management, real-time alerts, and improved operational efficiency As industries increasingly emphasize precision, safety, and data-driven decision-making, radiometric detectors are expected to play a critical role in maintaining standards and supporting advanced scientific research.

Segmental Analysis

The radiometric detectors market is segmented by product type, application, end users, and geographic regions. By product type, radiometric detectors market is divided into Semiconductor Detectors, Gas Ionization Detectors, Solid Scintillators, Liquid Scintillators, Geiger Counter Radiometric Detectors, Magnetic Spectrometers, and Cerenkov Detectors. In terms of application, radiometric detectors market is classified into Proximity Detection, RGB Color Sensing, Gesture Recognition, Light Sensing, and UB/IR Detection. Based on end users, radiometric detectors market is segmented into Biotechnology And Pharmaceutical Institutes, Diagnostic Laboratories, and Research Institutes. Regionally, the radiometric detectors industry is classified into North America, Latin America, Western Europe, Eastern Europe, Balkan & Baltic Countries, Russia & Belarus, Central Asia, East Asia, South Asia & Pacific, and the Middle East & Africa.
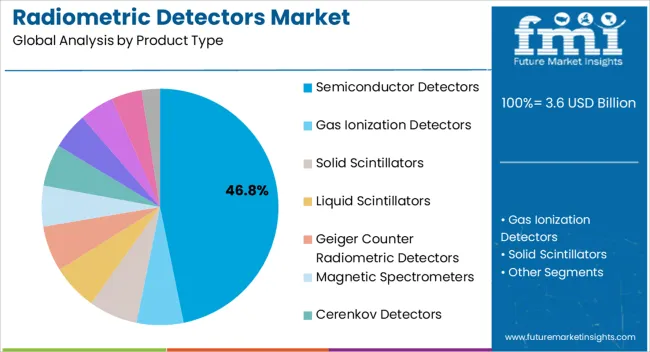
Insights into the Semiconductor Detectors Segment

Radiometric Detectors Market Analysis By Product Type

The semiconductor detectors segment is projected to hold 46.80% of the Radiometric Detectors market revenue in 2025, positioning it as the leading product type. This dominance is being attributed to the high sensitivity, rapid response time, and compact design offered by semiconductor-based technologies, which allow precise measurement of low-intensity radiation. Semiconductor detectors have been widely adopted in laboratory research, industrial quality control, and safety monitoring applications, where accuracy and reliability are critical.

The ability to integrate these detectors with digital data acquisition systems and automated monitoring platforms has further increased their value proposition. Growth is also supported by advancements in material science and microfabrication techniques, which have improved detector efficiency and reduced operational costs.

Additionally, the scalability and modularity of semiconductor detectors have facilitated their deployment across multiple end-use environments without extensive modifications As demand for highly precise and real-time radiation detection grows, semiconductor detectors are expected to maintain a leading position in the market.
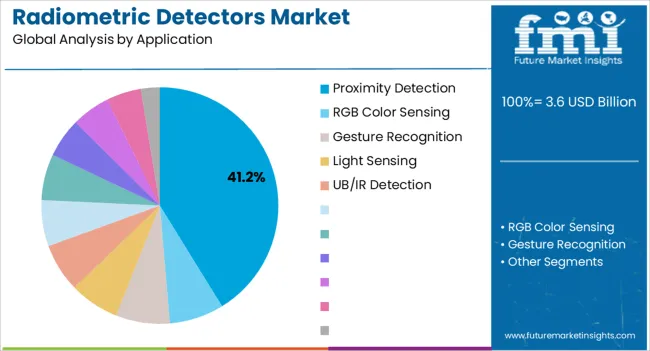
Insights into the Proximity Detection Segment

Radiometric Detectors Market Analysis By Application

The proximity detection application segment is anticipated to account for 41.20% of the Radiometric Detectors market revenue in 2025, establishing it as the most prominent application area. This leading position is being driven by the need for accurate, real-time detection of radiation presence in sensitive environments such as laboratories, cleanrooms, and industrial process monitoring.

Proximity detection is favored due to its ability to deliver immediate alerts for radiation exposure, thereby supporting safety compliance and operational efficiency. The adoption has been accelerated by the integration of these detectors with automated control systems and monitoring software, which allow remote management and rapid response to potential hazards.

Technological enhancements, including improved sensor resolution and signal processing algorithms, have further strengthened the segment’s market share As the demand for workplace safety, regulatory compliance, and precise monitoring continues to grow, proximity detection applications are expected to remain a key driver of radiometric detector adoption.
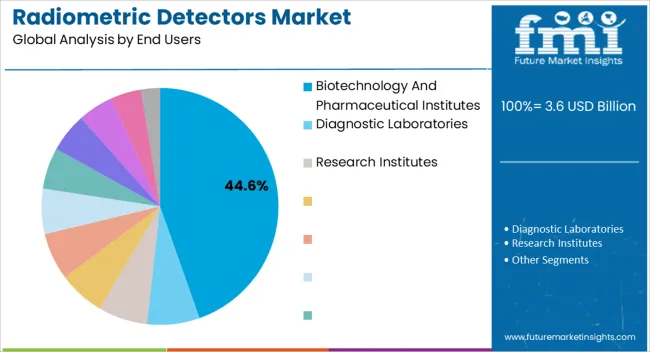
Insights into the Biotechnology and Pharmaceutical Institutes Segment

Radiometric Detectors Market Analysis By End Users

The biotechnology and pharmaceutical institutes end-use industry segment is projected to hold 44.60% of the Radiometric Detectors market revenue in 2025, making it the largest consumer segment. The growth of this segment is being driven by the increasing use of radiometric detection in drug development, genomic research, clinical diagnostics, and quality control processes.

These institutes require highly sensitive, accurate, and reliable detection systems to monitor radioactive tracers, assay results, and contamination levels, which has bolstered demand for advanced radiometric detectors. The segment benefits from the ability to integrate detectors with automated laboratory equipment, enabling high-throughput analysis and minimizing human error.

Additionally, regulatory guidelines and safety protocols in pharmaceutical and biotechnology research have necessitated the adoption of sophisticated detection systems, further supporting market expansion As investment in research activities rises globally and precision in laboratory monitoring becomes increasingly critical, biotechnology and pharmaceutical institutes are expected to continue leading the consumption of radiometric detectors.

Market Overview

Radiometric Detectors Market

This Radiometric Detectors market study offers a comprehensive analysis of the business models, key strategies, and respective market shares of some of the most prominent players in this landscape. Along with an in-depth commentary on the key influencing factors, market statistics in terms of revenues, segment-wise data, region-wise data, and country-wise data are offered in the full study.

This study is one of the most comprehensive documentation that captures all the facets of the evolving Radiometric Detectors market.

Radiometry involve techniques that uses visible light to measure electromagnetic radiations. Contrary to photometric techniques, these techniques characterize the segregation of radiation’s power in space. Radiometry is different from basic quantum techniques like photon counting. Radiometric detectors are used to analyze drug pathways, assess environmental contaminations and protect laboratory environments.

Radiometric detectors are considered to be the gold standard and are extensively used for these applications because of their high specificity and sensitivity to light. Radiometric detectors are designed for precise management of beta counting, gamma counting and related methods.

Other applications that involve radiometric detectors are color processing, transport, spectroscopy, imaging applications in pharmaceutical and chemical industries and other medical communication sectors. Commonly used radiometric detectors produce several changes in their electrical attributes; mainly, voltage, current, temperature, or resistance. It is then measured electrically. Majority of the cases involve the output to be displayed by the detectors, and is then calibrated to analyze the amount of light absorbed by radiometric detectors.
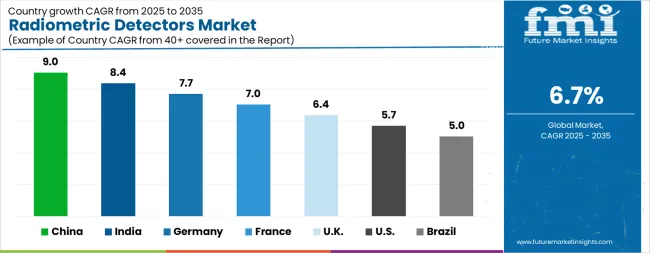
Analysis of Radiometric Detectors Market By Key Countries

Radiometric Detectors Market Cagr Analysis By Country
Country CAGR
China 9.0%
India 8.4%
Germany 7.7%
France 7.0%
UK 6.4%
USA 5.7%
Brazil 5.0%

Country-wise Analysis

The Radiometric Detectors Market is expected to register a CAGR of 6.7% during the forecast period, exhibiting varied country level momentum. China leads with the highest CAGR of 9.0%, followed by India at 8.4%. Developed markets such as Germany, France, and the UK continue to expand steadily, while the USA is likely to grow at consistent rates. Brazil posts the lowest CAGR at 5.0%, yet still underscores a broadly positive trajectory for the global Radiometric Detectors Market. In 2024, Germany held a dominant revenue in the Western Europe market and is expected to grow with a CAGR of 7.7%. The USA Radiometric Detectors Market is estimated to be valued at USD 1.3 billion in 2025 and is anticipated to reach a valuation of USD 2.3 billion by 2035. Sales are projected to rise at a CAGR of 5.7% over the forecast period between 2025 and 2035. While Japan and South Korea markets are estimated to be valued at USD 188.2 million and USD 112.1 million respectively in 2025.
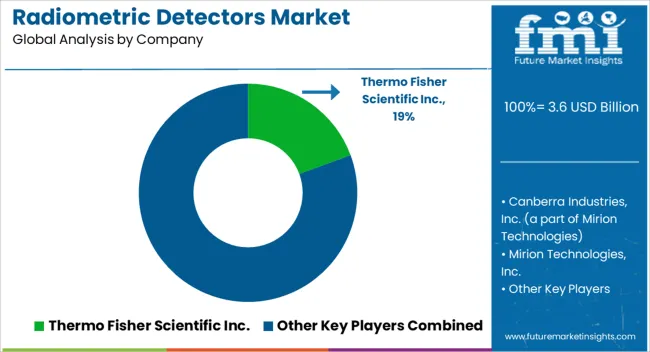
Key Players in the Radiometric Detectors Market

Radiometric Detectors Market Analysis By Company

  • Thermo Fisher Scientific Inc.
  • Canberra Industries, Inc. (a part of Mirion Technologies)
  • Mirion Technologies, Inc.
  • Ludlum Measurements, Inc.
  • AMETEK, Inc. (including Ortec, SII, and Landauer)
  • Becton, Dickinson and Company (BD)
  • FLIR Systems, Inc.
  • Honeywell International Inc.
  • Berthold Technologies GmbH & Co. KG
  • Arrow-Tech, Inc.

Scope of the Report

Item Value
Quantitative Units USD 3.6 Billion
Product Type Semiconductor Detectors, Gas Ionization Detectors, Solid Scintillators, Liquid Scintillators, Geiger Counter Radiometric Detectors, Magnetic Spectrometers, and Cerenkov Detectors
Application Proximity Detection, RGB Color Sensing, Gesture Recognition, Light Sensing, and UB/IR Detection
End Users Biotechnology And Pharmaceutical Institutes, Diagnostic Laboratories, and Research Institutes
Regions Covered North America, Europe, Asia-Pacific, Latin America, Middle East & Africa
Country Covered United States, Canada, Germany, France, United Kingdom, China, Japan, India, Brazil, South Africa
Key Companies Profiled Thermo Fisher Scientific Inc., Canberra Industries, Inc. (a part of Mirion Technologies), Mirion Technologies, Inc., Ludlum Measurements, Inc., AMETEK, Inc. (including Ortec, SII, and Landauer), Becton, Dickinson and Company (BD), FLIR Systems, Inc., Honeywell International Inc., Berthold Technologies GmbH & Co. KG, and Arrow-Tech, Inc.

Radiometric Detectors Market by Segments

Product Type:

  • Semiconductor Detectors
  • Gas Ionization Detectors
  • Solid Scintillators
  • Liquid Scintillators
  • Geiger Counter Radiometric Detectors
  • Magnetic Spectrometers
  • Cerenkov Detectors

Application:

  • Proximity Detection
  • RGB Color Sensing
  • Gesture Recognition
  • Light Sensing
  • UB/IR Detection

End Users:

  • Biotechnology And Pharmaceutical Institutes
  • Diagnostic Laboratories
  • Research Institutes

Region:

  • North America
    • USA
    • Canada
    • Mexico
  • Latin America
    • Brazil
    • Chile
    • Rest of Latin America
  • Western Europe
    • Germany
    • UK
    • Italy
    • Spain
    • France
    • Nordic
    • BENELUX
    • Rest of Western Europe
  • Eastern Europe
    • Russia
    • Poland
    • Hungary
    • Balkan & Baltic
    • Rest of Eastern Europe
  • East Asia
    • China
    • Japan
    • South Korea
  • South Asia and Pacific
    • India
    • ASEAN
    • Australia & New Zealand
    • Rest of South Asia and Pacific
  • Middle East & Africa
    • Kingdom of Saudi Arabia
    • Other GCC Countries
    • Turkiye
    • South Africa
    • Other African Union
    • Rest of Middle East & Africa

Table of Content

  1. Executive Summary
    • Global Market Outlook
    • Demand-side Trends
    • Supply-side Trends
    • Technology Roadmap Analysis
    • Analysis and Recommendations
  2. Market Overview
    • Market Coverage / Taxonomy
    • Market Definition / Scope / Limitations
  3. Market Background
    • Market Dynamics
      • Drivers
      • Restraints
      • Opportunity
      • Trends
    • Scenario Forecast
      • Demand in Optimistic Scenario
      • Demand in Likely Scenario
      • Demand in Conservative Scenario
    • Opportunity Map Analysis
    • Product Life Cycle Analysis
    • Supply Chain Analysis
    • Investment Feasibility Matrix
    • Value Chain Analysis
    • PESTLE and Porter’s Analysis
    • Regulatory Landscape
    • Regional Parent Market Outlook
    • Production and Consumption Statistics
    • Import and Export Statistics
  4. Global Market Analysis 2020 to 2024 and Forecast, 2025 to 2035
    • Historical Market Size Value (USD Million) Analysis, 2020 to 2024
    • Current and Future Market Size Value (USD Million) Projections, 2025 to 2035
      • Y-o-Y Growth Trend Analysis
      • Absolute $ Opportunity Analysis
  5. Global Market Pricing Analysis 2020 to 2024 and Forecast 2025 to 2035
  6. Global Market Analysis 2020 to 2024 and Forecast 2025 to 2035, By Product Type
    • Introduction / Key Findings
    • Historical Market Size Value (USD Million) Analysis By Product Type , 2020 to 2024
    • Current and Future Market Size Value (USD Million) Analysis and Forecast By Product Type , 2025 to 2035
      • Semiconductor Detectors
      • Gas Ionization Detectors
      • Solid Scintillators
      • Liquid Scintillators
      • Geiger Counter Radiometric Detectors
      • Magnetic Spectrometers
      • Cerenkov Detectors
    • Y-o-Y Growth Trend Analysis By Product Type , 2020 to 2024
    • Absolute $ Opportunity Analysis By Product Type , 2025 to 2035
  7. Global Market Analysis 2020 to 2024 and Forecast 2025 to 2035, By Application
    • Introduction / Key Findings
    • Historical Market Size Value (USD Million) Analysis By Application, 2020 to 2024
    • Current and Future Market Size Value (USD Million) Analysis and Forecast By Application, 2025 to 2035
      • Proximity Detection
      • RGB Color Sensing
      • Gesture Recognition
      • Light Sensing
      • UB/IR Detection
    • Y-o-Y Growth Trend Analysis By Application, 2020 to 2024
    • Absolute $ Opportunity Analysis By Application, 2025 to 2035
  8. Global Market Analysis 2020 to 2024 and Forecast 2025 to 2035, By End Users
    • Introduction / Key Findings
    • Historical Market Size Value (USD Million) Analysis By End Users, 2020 to 2024
    • Current and Future Market Size Value (USD Million) Analysis and Forecast By End Users, 2025 to 2035
      • Biotechnology And Pharmaceutical Institutes
      • Diagnostic Laboratories
      • Research Institutes
    • Y-o-Y Growth Trend Analysis By End Users, 2020 to 2024
    • Absolute $ Opportunity Analysis By End Users, 2025 to 2035
  9. Global Market Analysis 2020 to 2024 and Forecast 2025 to 2035, By Region
    • Introduction
    • Historical Market Size Value (USD Million) Analysis By Region, 2020 to 2024
    • Current Market Size Value (USD Million) Analysis and Forecast By Region, 2025 to 2035
      • North America
      • Latin America
      • Western Europe
      • Eastern Europe
      • East Asia
      • South Asia and Pacific
      • Middle East & Africa
    • Market Attractiveness Analysis By Region
  10. North America Market Analysis 2020 to 2024 and Forecast 2025 to 2035, By Country
    • Historical Market Size Value (USD Million) Trend Analysis By Market Taxonomy, 2020 to 2024
    • Market Size Value (USD Million) Forecast By Market Taxonomy, 2025 to 2035
      • By Country
        • USA
        • Canada
        • Mexico
      • By Product Type
      • By Application
      • By End Users
    • Market Attractiveness Analysis
      • By Country
      • By Product Type
      • By Application
      • By End Users
    • Key Takeaways
  11. Latin America Market Analysis 2020 to 2024 and Forecast 2025 to 2035, By Country
    • Historical Market Size Value (USD Million) Trend Analysis By Market Taxonomy, 2020 to 2024
    • Market Size Value (USD Million) Forecast By Market Taxonomy, 2025 to 2035
      • By Country
        • Brazil
        • Chile
        • Rest of Latin America
      • By Product Type
      • By Application
      • By End Users
    • Market Attractiveness Analysis
      • By Country
      • By Product Type
      • By Application
      • By End Users
    • Key Takeaways
  12. Western Europe Market Analysis 2020 to 2024 and Forecast 2025 to 2035, By Country
    • Historical Market Size Value (USD Million) Trend Analysis By Market Taxonomy, 2020 to 2024
    • Market Size Value (USD Million) Forecast By Market Taxonomy, 2025 to 2035
      • By Country
        • Germany
        • UK
        • Italy
        • Spain
        • France
        • Nordic
        • BENELUX
        • Rest of Western Europe
      • By Product Type
      • By Application
      • By End Users
    • Market Attractiveness Analysis
      • By Country
      • By Product Type
      • By Application
      • By End Users
    • Key Takeaways
  13. Eastern Europe Market Analysis 2020 to 2024 and Forecast 2025 to 2035, By Country
    • Historical Market Size Value (USD Million) Trend Analysis By Market Taxonomy, 2020 to 2024
    • Market Size Value (USD Million) Forecast By Market Taxonomy, 2025 to 2035
      • By Country
        • Russia
        • Poland
        • Hungary
        • Balkan & Baltic
        • Rest of Eastern Europe
      • By Product Type
      • By Application
      • By End Users
    • Market Attractiveness Analysis
      • By Country
      • By Product Type
      • By Application
      • By End Users
    • Key Takeaways
  14. East Asia Market Analysis 2020 to 2024 and Forecast 2025 to 2035, By Country
    • Historical Market Size Value (USD Million) Trend Analysis By Market Taxonomy, 2020 to 2024
    • Market Size Value (USD Million) Forecast By Market Taxonomy, 2025 to 2035
      • By Country
        • China
        • Japan
        • South Korea
      • By Product Type
      • By Application
      • By End Users
    • Market Attractiveness Analysis
      • By Country
      • By Product Type
      • By Application
      • By End Users
    • Key Takeaways
  15. South Asia and Pacific Market Analysis 2020 to 2024 and Forecast 2025 to 2035, By Country
    • Historical Market Size Value (USD Million) Trend Analysis By Market Taxonomy, 2020 to 2024
    • Market Size Value (USD Million) Forecast By Market Taxonomy, 2025 to 2035
      • By Country
        • India
        • ASEAN
        • Australia & New Zealand
        • Rest of South Asia and Pacific
      • By Product Type
      • By Application
      • By End Users
    • Market Attractiveness Analysis
      • By Country
      • By Product Type
      • By Application
      • By End Users
    • Key Takeaways
  16. Middle East & Africa Market Analysis 2020 to 2024 and Forecast 2025 to 2035, By Country
    • Historical Market Size Value (USD Million) Trend Analysis By Market Taxonomy, 2020 to 2024
    • Market Size Value (USD Million) Forecast By Market Taxonomy, 2025 to 2035
      • By Country
        • Kingdom of Saudi Arabia
        • Other GCC Countries
        • Turkiye
        • South Africa
        • Other African Union
        • Rest of Middle East & Africa
      • By Product Type
      • By Application
      • By End Users
    • Market Attractiveness Analysis
      • By Country
      • By Product Type
      • By Application
      • By End Users
    • Key Takeaways
  17. Key Countries Market Analysis
    • USA
      • Pricing Analysis
      • Market Share Analysis, 2024
        • By Product Type
        • By Application
        • By End Users
    • Canada
      • Pricing Analysis
      • Market Share Analysis, 2024
        • By Product Type
        • By Application
        • By End Users
    • Mexico
      • Pricing Analysis
      • Market Share Analysis, 2024
        • By Product Type
        • By Application
        • By End Users
    • Brazil
      • Pricing Analysis
      • Market Share Analysis, 2024
        • By Product Type
        • By Application
        • By End Users
    • Chile
      • Pricing Analysis
      • Market Share Analysis, 2024
        • By Product Type
        • By Application
        • By End Users
    • Germany
      • Pricing Analysis
      • Market Share Analysis, 2024
        • By Product Type
        • By Application
        • By End Users
    • UK
      • Pricing Analysis
      • Market Share Analysis, 2024
        • By Product Type
        • By Application
        • By End Users
    • Italy
      • Pricing Analysis
      • Market Share Analysis, 2024
        • By Product Type
        • By Application
        • By End Users
    • Spain
      • Pricing Analysis
      • Market Share Analysis, 2024
        • By Product Type
        • By Application
        • By End Users
    • France
      • Pricing Analysis
      • Market Share Analysis, 2024
        • By Product Type
        • By Application
        • By End Users
    • India
      • Pricing Analysis
      • Market Share Analysis, 2024
        • By Product Type
        • By Application
        • By End Users
    • ASEAN
      • Pricing Analysis
      • Market Share Analysis, 2024
        • By Product Type
        • By Application
        • By End Users
    • Australia & New Zealand
      • Pricing Analysis
      • Market Share Analysis, 2024
        • By Product Type
        • By Application
        • By End Users
    • China
      • Pricing Analysis
      • Market Share Analysis, 2024
        • By Product Type
        • By Application
        • By End Users
    • Japan
      • Pricing Analysis
      • Market Share Analysis, 2024
        • By Product Type
        • By Application
        • By End Users
    • South Korea
      • Pricing Analysis
      • Market Share Analysis, 2024
        • By Product Type
        • By Application
        • By End Users
    • Russia
      • Pricing Analysis
      • Market Share Analysis, 2024
        • By Product Type
        • By Application
        • By End Users
    • Poland
      • Pricing Analysis
      • Market Share Analysis, 2024
        • By Product Type
        • By Application
        • By End Users
    • Hungary
      • Pricing Analysis
      • Market Share Analysis, 2024
        • By Product Type
        • By Application
        • By End Users
    • Kingdom of Saudi Arabia
      • Pricing Analysis
      • Market Share Analysis, 2024
        • By Product Type
        • By Application
        • By End Users
    • Turkiye
      • Pricing Analysis
      • Market Share Analysis, 2024
        • By Product Type
        • By Application
        • By End Users
    • South Africa
      • Pricing Analysis
      • Market Share Analysis, 2024
        • By Product Type
        • By Application
        • By End Users
  18. Market Structure Analysis
    • Competition Dashboard
    • Competition Benchmarking
    • Market Share Analysis of Top Players
      • By Regional
      • By Product Type
      • By Application
      • By End Users
  19. Competition Analysis
    • Competition Deep Dive
      • Thermo Fisher Scientific Inc.
        • Overview
        • Product Portfolio
        • Profitability by Market Segments (Product/Age /Sales Channel/Region)
        • Sales Footprint
        • Strategy Overview
          • Marketing Strategy
          • Product Strategy
          • Channel Strategy
      • Canberra Industries, Inc. (a part of Mirion Technologies)
      • Mirion Technologies, Inc.
      • Ludlum Measurements, Inc.
      • AMETEK, Inc. (including Ortec, SII, and Landauer)
      • Becton, Dickinson and Company (BD)
      • FLIR Systems, Inc.
      • Honeywell International Inc.
      • Berthold Technologies GmbH & Co. KG
      • Arrow-Tech, Inc.
  20. Assumptions & Acronyms Used
  21. Research Methodology

List of Tables

  • Table 1: Global Market Value (USD Million) Forecast by Region, 2020-2035
  • Table 2: Global Market Value (USD Million) Forecast by Product Type , 2020-2035
  • Table 3: Global Market Value (USD Million) Forecast by Application, 2020-2035
  • Table 4: Global Market Value (USD Million) Forecast by End Users, 2020-2035
  • Table 5: North America Market Value (USD Million) Forecast by Country, 2020-2035
  • Table 6: North America Market Value (USD Million) Forecast by Product Type , 2020-2035
  • Table 7: North America Market Value (USD Million) Forecast by Application, 2020-2035
  • Table 8: North America Market Value (USD Million) Forecast by End Users, 2020-2035
  • Table 9: Latin America Market Value (USD Million) Forecast by Country, 2020-2035
  • Table 10: Latin America Market Value (USD Million) Forecast by Product Type , 2020-2035
  • Table 11: Latin America Market Value (USD Million) Forecast by Application, 2020-2035
  • Table 12: Latin America Market Value (USD Million) Forecast by End Users, 2020-2035
  • Table 13: Western Europe Market Value (USD Million) Forecast by Country, 2020-2035
  • Table 14: Western Europe Market Value (USD Million) Forecast by Product Type , 2020-2035
  • Table 15: Western Europe Market Value (USD Million) Forecast by Application, 2020-2035
  • Table 16: Western Europe Market Value (USD Million) Forecast by End Users, 2020-2035
  • Table 17: Eastern Europe Market Value (USD Million) Forecast by Country, 2020-2035
  • Table 18: Eastern Europe Market Value (USD Million) Forecast by Product Type , 2020-2035
  • Table 19: Eastern Europe Market Value (USD Million) Forecast by Application, 2020-2035
  • Table 20: Eastern Europe Market Value (USD Million) Forecast by End Users, 2020-2035
  • Table 21: East Asia Market Value (USD Million) Forecast by Country, 2020-2035
  • Table 22: East Asia Market Value (USD Million) Forecast by Product Type , 2020-2035
  • Table 23: East Asia Market Value (USD Million) Forecast by Application, 2020-2035
  • Table 24: East Asia Market Value (USD Million) Forecast by End Users, 2020-2035
  • Table 25: South Asia and Pacific Market Value (USD Million) Forecast by Country, 2020-2035
  • Table 26: South Asia and Pacific Market Value (USD Million) Forecast by Product Type , 2020-2035
  • Table 27: South Asia and Pacific Market Value (USD Million) Forecast by Application, 2020-2035
  • Table 28: South Asia and Pacific Market Value (USD Million) Forecast by End Users, 2020-2035
  • Table 29: Middle East & Africa Market Value (USD Million) Forecast by Country, 2020-2035
  • Table 30: Middle East & Africa Market Value (USD Million) Forecast by Product Type , 2020-2035
  • Table 31: Middle East & Africa Market Value (USD Million) Forecast by Application, 2020-2035
  • Table 32: Middle East & Africa Market Value (USD Million) Forecast by End Users, 2020-2035

List of Figures

  • Figure 1: Global Market Pricing Analysis
  • Figure 2: Global Market Value (USD Million) Forecast 2020-2035
  • Figure 3: Global Market Value Share and BPS Analysis by Product Type , 2025 and 2035
  • Figure 4: Global Market Y-o-Y Growth Comparison by Product Type , 2025-2035
  • Figure 5: Global Market Attractiveness Analysis by Product Type
  • Figure 6: Global Market Value Share and BPS Analysis by Application, 2025 and 2035
  • Figure 7: Global Market Y-o-Y Growth Comparison by Application, 2025-2035
  • Figure 8: Global Market Attractiveness Analysis by Application
  • Figure 9: Global Market Value Share and BPS Analysis by End Users, 2025 and 2035
  • Figure 10: Global Market Y-o-Y Growth Comparison by End Users, 2025-2035
  • Figure 11: Global Market Attractiveness Analysis by End Users
  • Figure 12: Global Market Value (USD Million) Share and BPS Analysis by Region, 2025 and 2035
  • Figure 13: Global Market Y-o-Y Growth Comparison by Region, 2025-2035
  • Figure 14: Global Market Attractiveness Analysis by Region
  • Figure 15: North America Market Incremental Dollar Opportunity, 2025-2035
  • Figure 16: Latin America Market Incremental Dollar Opportunity, 2025-2035
  • Figure 17: Western Europe Market Incremental Dollar Opportunity, 2025-2035
  • Figure 18: Eastern Europe Market Incremental Dollar Opportunity, 2025-2035
  • Figure 19: East Asia Market Incremental Dollar Opportunity, 2025-2035
  • Figure 20: South Asia and Pacific Market Incremental Dollar Opportunity, 2025-2035
  • Figure 21: Middle East & Africa Market Incremental Dollar Opportunity, 2025-2035
  • Figure 22: North America Market Value Share and BPS Analysis by Country, 2025 and 2035
  • Figure 23: North America Market Value Share and BPS Analysis by Product Type , 2025 and 2035
  • Figure 24: North America Market Y-o-Y Growth Comparison by Product Type , 2025-2035
  • Figure 25: North America Market Attractiveness Analysis by Product Type
  • Figure 26: North America Market Value Share and BPS Analysis by Application, 2025 and 2035
  • Figure 27: North America Market Y-o-Y Growth Comparison by Application, 2025-2035
  • Figure 28: North America Market Attractiveness Analysis by Application
  • Figure 29: North America Market Value Share and BPS Analysis by End Users, 2025 and 2035
  • Figure 30: North America Market Y-o-Y Growth Comparison by End Users, 2025-2035
  • Figure 31: North America Market Attractiveness Analysis by End Users
  • Figure 32: Latin America Market Value Share and BPS Analysis by Country, 2025 and 2035
  • Figure 33: Latin America Market Value Share and BPS Analysis by Product Type , 2025 and 2035
  • Figure 34: Latin America Market Y-o-Y Growth Comparison by Product Type , 2025-2035
  • Figure 35: Latin America Market Attractiveness Analysis by Product Type
  • Figure 36: Latin America Market Value Share and BPS Analysis by Application, 2025 and 2035
  • Figure 37: Latin America Market Y-o-Y Growth Comparison by Application, 2025-2035
  • Figure 38: Latin America Market Attractiveness Analysis by Application
  • Figure 39: Latin America Market Value Share and BPS Analysis by End Users, 2025 and 2035
  • Figure 40: Latin America Market Y-o-Y Growth Comparison by End Users, 2025-2035
  • Figure 41: Latin America Market Attractiveness Analysis by End Users
  • Figure 42: Western Europe Market Value Share and BPS Analysis by Country, 2025 and 2035
  • Figure 43: Western Europe Market Value Share and BPS Analysis by Product Type , 2025 and 2035
  • Figure 44: Western Europe Market Y-o-Y Growth Comparison by Product Type , 2025-2035
  • Figure 45: Western Europe Market Attractiveness Analysis by Product Type
  • Figure 46: Western Europe Market Value Share and BPS Analysis by Application, 2025 and 2035
  • Figure 47: Western Europe Market Y-o-Y Growth Comparison by Application, 2025-2035
  • Figure 48: Western Europe Market Attractiveness Analysis by Application
  • Figure 49: Western Europe Market Value Share and BPS Analysis by End Users, 2025 and 2035
  • Figure 50: Western Europe Market Y-o-Y Growth Comparison by End Users, 2025-2035
  • Figure 51: Western Europe Market Attractiveness Analysis by End Users
  • Figure 52: Eastern Europe Market Value Share and BPS Analysis by Country, 2025 and 2035
  • Figure 53: Eastern Europe Market Value Share and BPS Analysis by Product Type , 2025 and 2035
  • Figure 54: Eastern Europe Market Y-o-Y Growth Comparison by Product Type , 2025-2035
  • Figure 55: Eastern Europe Market Attractiveness Analysis by Product Type
  • Figure 56: Eastern Europe Market Value Share and BPS Analysis by Application, 2025 and 2035
  • Figure 57: Eastern Europe Market Y-o-Y Growth Comparison by Application, 2025-2035
  • Figure 58: Eastern Europe Market Attractiveness Analysis by Application
  • Figure 59: Eastern Europe Market Value Share and BPS Analysis by End Users, 2025 and 2035
  • Figure 60: Eastern Europe Market Y-o-Y Growth Comparison by End Users, 2025-2035
  • Figure 61: Eastern Europe Market Attractiveness Analysis by End Users
  • Figure 62: East Asia Market Value Share and BPS Analysis by Country, 2025 and 2035
  • Figure 63: East Asia Market Value Share and BPS Analysis by Product Type , 2025 and 2035
  • Figure 64: East Asia Market Y-o-Y Growth Comparison by Product Type , 2025-2035
  • Figure 65: East Asia Market Attractiveness Analysis by Product Type
  • Figure 66: East Asia Market Value Share and BPS Analysis by Application, 2025 and 2035
  • Figure 67: East Asia Market Y-o-Y Growth Comparison by Application, 2025-2035
  • Figure 68: East Asia Market Attractiveness Analysis by Application
  • Figure 69: East Asia Market Value Share and BPS Analysis by End Users, 2025 and 2035
  • Figure 70: East Asia Market Y-o-Y Growth Comparison by End Users, 2025-2035
  • Figure 71: East Asia Market Attractiveness Analysis by End Users
  • Figure 72: South Asia and Pacific Market Value Share and BPS Analysis by Country, 2025 and 2035
  • Figure 73: South Asia and Pacific Market Value Share and BPS Analysis by Product Type , 2025 and 2035
  • Figure 74: South Asia and Pacific Market Y-o-Y Growth Comparison by Product Type , 2025-2035
  • Figure 75: South Asia and Pacific Market Attractiveness Analysis by Product Type
  • Figure 76: South Asia and Pacific Market Value Share and BPS Analysis by Application, 2025 and 2035
  • Figure 77: South Asia and Pacific Market Y-o-Y Growth Comparison by Application, 2025-2035
  • Figure 78: South Asia and Pacific Market Attractiveness Analysis by Application
  • Figure 79: South Asia and Pacific Market Value Share and BPS Analysis by End Users, 2025 and 2035
  • Figure 80: South Asia and Pacific Market Y-o-Y Growth Comparison by End Users, 2025-2035
  • Figure 81: South Asia and Pacific Market Attractiveness Analysis by End Users
  • Figure 82: Middle East & Africa Market Value Share and BPS Analysis by Country, 2025 and 2035
  • Figure 83: Middle East & Africa Market Value Share and BPS Analysis by Product Type , 2025 and 2035
  • Figure 84: Middle East & Africa Market Y-o-Y Growth Comparison by Product Type , 2025-2035
  • Figure 85: Middle East & Africa Market Attractiveness Analysis by Product Type
  • Figure 86: Middle East & Africa Market Value Share and BPS Analysis by Application, 2025 and 2035
  • Figure 87: Middle East & Africa Market Y-o-Y Growth Comparison by Application, 2025-2035
  • Figure 88: Middle East & Africa Market Attractiveness Analysis by Application
  • Figure 89: Middle East & Africa Market Value Share and BPS Analysis by End Users, 2025 and 2035
  • Figure 90: Middle East & Africa Market Y-o-Y Growth Comparison by End Users, 2025-2035
  • Figure 91: Middle East & Africa Market Attractiveness Analysis by End Users
  • Figure 92: Global Market - Tier Structure Analysis
  • Figure 93: Global Market - Company Share Analysis

Frequently Asked Questions

How big is the radiometric detectors market in 2025?

The global radiometric detectors market is estimated to be valued at USD 3.6 billion in 2025.

What will be the size of radiometric detectors market in 2035?

The market size for the radiometric detectors market is projected to reach USD 7.0 billion by 2035.

How much will be the radiometric detectors market growth between 2025 and 2035?

The radiometric detectors market is expected to grow at a 6.7% CAGR between 2025 and 2035.

What are the key product types in the radiometric detectors market?

The key product types in radiometric detectors market are semiconductor detectors, gas ionization detectors, solid scintillators, liquid scintillators, geiger counter radiometric detectors, magnetic spectrometers and cerenkov detectors.

Which application segment to contribute significant share in the radiometric detectors market in 2025?

In terms of application, proximity detection segment to command 41.2% share in the radiometric detectors market in 2025.

Explore Similar Insights

Future Market Insights

Radiometric Detectors Market

Chat With

MaRIA

Hi There, I am MaRIA, Your Market Research Intelligence Assistant. How may I help you?