Neutron Detectors Market Forecast and Outlook 2025 to 2035

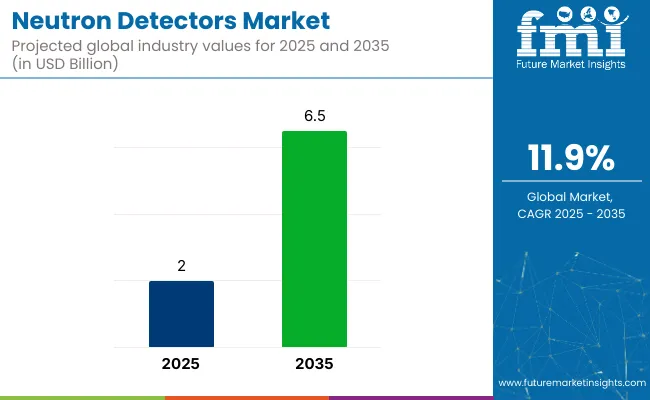
The neutron detectors market is valued at USD 2.0 billion in 2025 and is poised to reach USD 6.5 billion by 2035, reflecting a compound annual growth rate (CAGR) of 11.9%. This growth is primarily driven by increased demand in the nuclear power, defense, and healthcare sectors, with a strong emphasis on safety, security, and regulatory compliance. The rising global focus on clean energy, particularly nuclear power, is expected to accelerate demand for neutron detection systems further to ensure safety and environmental compliance.
Quick Stats for Neutron Detectors Market

  • Market Value (2025): USD 2.0 billion
  • Forecast Value (2035): USD 6.5 billion
  • Forecast CAGR: 11.9%
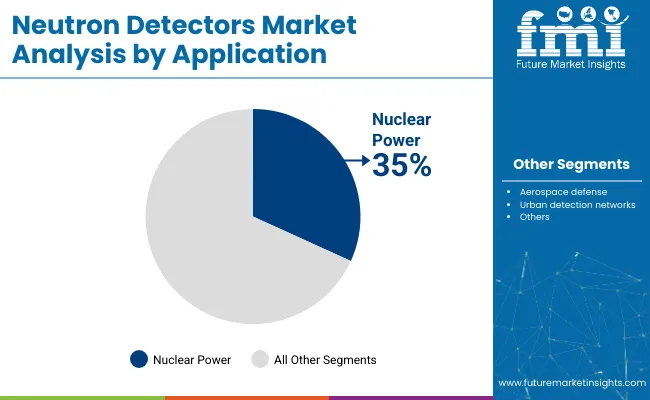
  • Top Application in 2025: Nuclear Power (35% Market Share)
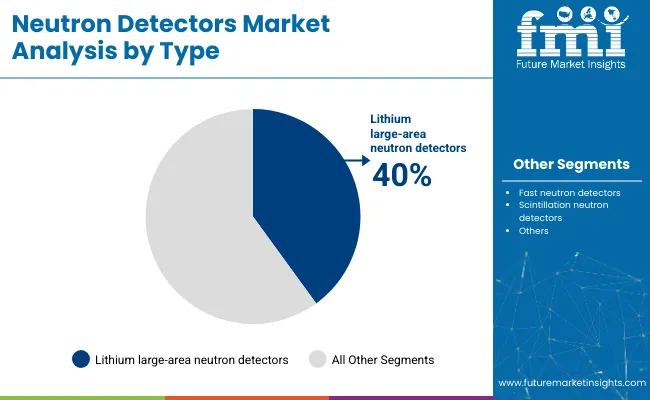
  • Leading Type Segment: Lithium Large-Area Neutron Detectors (40% Market Share)
  • Fastest Growing Region: North America (fastest-growing market in the USA with 13.2% CAGR)

Neutron Detectors Market

Metric Value
Estimated Size (2025) USD 2.0 billion
Projected Value (2035) USD 6.5 billion
CAGR (2025-2035) 11.9%

North America is expected to maintain the largest market share, especially in the USA, growing at a significant CAGR of 13.2%. Additionally, countries like France and the UK are projected to experience the fastest growth rates, CAGRs of 11.0% and 10.8%. The nuclear power application segment will dominate the market, with a market share of 35% in 2025. Meanwhile, lithium large-area neutron detectors account for 40% market share.

The market represents approximately 18-22% of the broader radiation detection market, which includes gamma, alpha, and beta detection technologies. Within the nuclear safety market, neutron detectors account for nearly 25-30%, due to their critical role in real-time monitoring of nuclear reactors.

In the defense and security sector, neutron detectors make up about 15-18%, focused on border protection and threat detection. Their contribution to healthcare radiation monitoring is smaller, around 8-10%, while in environmental monitoring, they represent an estimated 12-15% of the total detection equipment market.

Looking ahead, the future of the neutron detectors market is marked by the integration of artificial intelligence and machine learning technologies. These innovations are expected to improve the real-time monitoring capabilities and predictive analytics of neutron detectors.

Companies are increasingly investing in R&D to develop more efficient detection systems with greater sensitivity. At the same time, governments are expected to continue implementing stringent regulations to ensure safety and compliance in the nuclear and healthcare sectors. These developments will solidify the role of neutron detectors in critical safety applications.

Neutron Detectors Market Analysis by Top Investment Segments

The global neutron detectors market is segmented by type, application, and region. The major types include lithium large-area neutron detectors, fast neutron detectors, scintillation neutron detectors, and semiconductor neutron detectors. The primary applications include nuclear power, aerospace & defense, urban detection networks, and others (including medical imaging, environmental monitoring, and security). The regions covered are North America, Latin America, Western Europe, Eastern Europe, South Asia and Pacific, East Asia, the Middle East and Africa.

By Type, Lithium Large-area detectors account for 40% of the Market Share

Among the various types of neutron detectors, the Lithium Large-area Neutron Detectors segment is expected to dominate the market due to its ability to provide high precision in radiation monitoring, accounting for 40% of the market share in 2025. This segment is anticipated to hold a significant market share, as demand for advanced detection systems continues to rise across industries like nuclear power, defense, and healthcare.
  • Lithium large-area detectors are projected to dominate with the highest growth.
  • Technological advancements are improving the detectors' sensitivity and cost-effectiveness.
  • Demand is increasing in the nuclear safety and defense sectors due to enhanced accuracy.

Neutron Detectors Market Analysis By Type

By Application, Nuclear Power Segment Accounts for 35% Market Share in 2025

The Nuclear Power application segment leads the market, driven by increasing demand for clean energy sources and the need for advanced safety measures in nuclear power plants. This segment is expected to capture the largest share, around 35%, as neutron detectors play a critical role in ensuring the safety and efficiency of nuclear energy facilities, and regulatory standards are tightening worldwide.
  • The Nuclear Power application segment is the largest contributor.
  • The growing focus on clean energy and safety regulations in nuclear plants fuels this demand.
  • Adoption of detectors for real-time radiation monitoring is increasing.

Neutron Detectors Market Analysis By Application

Top Neutron Detectors Market Dynamics

Recent Trends in Neutron Detectors Market

  • Increasing adoption of AI and machine learning in neutron detection systems for improved accuracy.
  • Growing demand in healthcare applications, especially in medical imaging and cancer treatment.
  • Rising focus on nuclear power as a clean energy source, driving demand for radiation detection technologies.
  • Advancements in neutron detector materials, such as high-performance scintillators and semiconductors, are enhancing efficiency and sensitivity.

Challenges Neutron Detectors Market is Facing

  • High costs of advanced neutron detection systems limit adoption in emerging markets.
  • Regulatory compliance complexities across different regions, hindering market expansion.
  • Limited availability of skilled labor for the integration of sophisticated detector technologies.
  • Slow adoption of cutting-edge technology in certain regions, such as Japan and South Korea, due to cost concerns.

Analyzing Top Countries Manufacturing and Supplying Neutron Detectors

Among the top five countries, the United States is projected to lead the neutron detectors market with the highest CAGR of 13.2% from 2025 to 2035, driven by robust nuclear, defense, and AI integration efforts. France follows with a CAGR of 11.0%, supported by its heavy reliance on nuclear power.

The United Kingdom and Germany show similar, stable growth rates at 10.8% and 10.5%, respectively, owing to regulatory compliance and sustainability focus. Japan, while maintaining steady demand, trails slightly with a 9.7% CAGR, limited by cost sensitivity and slower adoption of cutting-edge detection technologies.

The report covers in-depth analysis of 40+ countries; five top-performing OECD countries are highlighted below.

USA Neutron Detectors Market Analysis

The USA is set to dominate the neutron detectors market with a projected CAGR of 13.2% from 2025 to 2035. The country's well-established nuclear energy infrastructure, defense sector, and advancements in healthcare are key drivers of growth. Regulatory frameworks ensuring radiation safety and the integration of AI in detection technologies will continue to propel demand for neutron detectors.

  • Strong nuclear energy and defense sectors are driving demand.
  • Significant investments in research and development for detector technologies.
  • Increasing adoption of AI and automation in neutron detection systems.

Neutron Detectors Sales Analysis in the UK

The sales of neutron detectors in the UKare expected to experience steady growth in the neutron detectors market, with a CAGR of 10.8%. Strong regulatory standards in the nuclear and healthcare sectors and the country's focus on sustainability and clean energy will continue to influence market dynamics, along with growing demand for advanced radiation monitoring solutions.

  • Stringent safety and regulatory standards for radiation detectors.
  • Growing demand in the healthcare and nuclear energy sectors.
  • The government pushes for eco-friendly technologies, fostering innovation.

Germany Neutron Detectors Market Analysis

The neutron detectors market in Germany is poised for steady expansion, growing at a CAGR of 10.5%. As a leader in nuclear energy production and environmental safety initiatives, Germany is leveraging regulatory pressure and technological advancements to ensure the continuous growth of radiation detection solutions across various industries.

  • Strong nuclear energy presence driving the demand for detection systems.
  • High regulatory standards supporting the adoption of advanced technologies.
  • Focus on eco-friendly and energy-efficient detection systems.

Neutron Detectors Demand Analysis in France

The revenue from neutron detectors in France is projected to grow at a CAGR of 11.0%, supported by its reliance on nuclear power and its commitment to sustainable energy practices. The need for advanced neutron detection systems in atomic energy and healthcare, particularly for cancer treatment, is expected to boost market growth in the region further.

  • Leading position in nuclear power generation, increasing detection demand.
  • Emphasis on sustainable and green technologies driving innovation.
  • Growing healthcare demand for radiation-based diagnostic tools.

Japan Neutron Detectors Industry Analysis

The neutron detectors industry in Japan is expected to experience a CAGR of 9.7% in the neutron detectors market, mainly due to its ongoing focus on nuclear safety and energy efficiency. However, adoption of advanced technologies such as AI-powered detection systems is slower due to high costs and conservative investment approaches.

  • Strong nuclear safety regulations create consistent demand.
  • Cautious adoption of cutting-edge technology due to high costs.
  • Increasing emphasis on improving operational efficiency in nuclear plants.

Leading Neutron Detectors Market Suppliers

The neutron detectors market is moderately consolidated, with a few global leaders commanding a significant portion of the market share. Major players such as Thermo Fisher Scientific, Mirion Technologies, and ORTEC (a subsidiary of AMETEK) dominate the landscape, competing primarily on the basis of product innovation, technological advancements, and regulatory compliance. These companies focus on improving the precision, sensitivity, and cost-effectiveness of their neutron detectors, with ongoing investments in R&D to meet the growing demand across various sectors, including nuclear power, defense, and healthcare.

Company strategies revolve around maintaining competitive pricing, expanding product offerings, and forming strategic partnerships to strengthen their market position. Companies like Thermo Fisher Scientific and Mirion Technologies are investing heavily in AI and automation technologies to improve detector performance. Partnerships with government agencies, research institutions, and energy companies play a crucial role in advancing their product development and expanding into emerging markets.

Recent Neutron Detectors Industry News

  • In June 2025, Thermo Fisher Scientific was awarded a five-year, USD 94.5 million contract by the USA Department of Defense to supply the USA Navy with next-generation dosimetry systems and updated radiation health and database management software, supporting advanced occupational radiation exposure monitoring for Navy personnel.
  • In June 2025, Mirion Technologies and Westinghouse Electric announced a strategic partnership to provide digital Ex-core Nuclear Instrumentation Systems based on Mirion’s proTK product line, aiming to modernize and enhance performance in nuclear power plants worldwide.

Neutron Detectors Market Report Scope

Report Attributes Details
Current Total Market Size (2025) USD 2.0 billion
Projected Market Size (2035) USD 6.5 billion
CAGR (2025 to 2035) 11.9%
Base Year for Estimation 2024
Historical Period 2020 to 2024
Projections Period 2025 to 2035
Market Analysis Parameters Revenue in USD billions /Volume in Units
By Type Lithium Large-area Neutron Detectors, Fast Neutron Detectors, Scintillation Neutron Detectors, Semiconductor Neutron Detectors
By Application Nuclear Power, Aerospace & Defense, Urban Detection Networks, Others
Regions Covered North America, Latin America, Western Europe, Eastern Europe, South Asia , Pacific, East Asia, Middle East and Africa
Countries Covered United States, Canada, United Kingdom, Germany, France, China, Japan, South Korea, Brazil, Australia
Key Players Thermo Fisher Scientific, Mirion Technologies, Lanthan Biosciences, RADEX, Fluke Corporation, Canberra (A subsidiary of Mirion Technologies), Leidos , Qualtrex , ORTEC (A subsidiary of AMETEK), Harshaw Tracer
Additional Attributes Dollar sales by value, market share analysis by region, and country-wise analysis

Key Segments

By Type:

The industry is divided into Lithium large-area neutron detectors, fast neutron detectors, scintillation neutron detectors, semiconductor neutron detectors.

By Application:

It is segmented into nuclear power, aerospace defense, urban detection networks, and others.

By Region:

The landscape is studied across North America, Latin America, Western Europe, Eastern Europe, South Asia and Pacific, East Asia, and Middle East and Africa.

Table of Content

  1. Executive Summary
    • Global Market Outlook
    • Demand-side Trends
    • Supply-side Trends
    • Technology Roadmap Analysis
    • Analysis and Recommendations
  2. Market Overview
    • Market Coverage / Taxonomy
    • Market Definition / Scope / Limitations
  3. Market Background
    • Market Dynamics
      • Drivers
      • Restraints
      • Opportunity
      • Trends
    • Scenario Forecast
      • Demand in Optimistic Scenario
      • Demand in Likely Scenario
      • Demand in Conservative Scenario
    • Opportunity Map Analysis
    • Product Life Cycle Analysis
    • Supply Chain Analysis
      • Supply Side Participants and their Roles
        • Producers
        • Mid-Level Participants (Traders/ Agents/ Brokers)
        • Wholesalers and Distributors
      • Value Added and Value Created at Node in the Supply Chain
      • List of Raw Material Suppliers
      • List of Existing and Potential Buyer’s
    • Investment Feasibility Matrix
    • Value Chain Analysis
      • Profit Margin Analysis
      • Wholesalers and Distributors
      • Retailers
    • PESTLE and Porter’s Analysis
    • Regulatory Landscape
      • By Key Regions
      • By Key Countries
    • Regional Parent Market Outlook
    • Production and Consumption Statistics
    • Import and Export Statistics
  4. Global Market Analysis 2020 to 2024 and Forecast, 2025 to 2035
    • Historical Market Size Value (USD Billion) & Volume (Units) Analysis, 2020 to 2024
    • Current and Future Market Size Value (USD Billion) & Volume (Units) Projections, 2025 to 2035
      • Y-o-Y Growth Trend Analysis
      • Absolute $ Opportunity Analysis
  5. Global Market Pricing Analysis 2020 to 2024 and Forecast 2025 to 2035
  6. Global Market Analysis 2020 to 2024 and Forecast 2025 to 2035, By Type
    • Introduction / Key Findings
    • Historical Market Size Value (USD Billion) & Volume (Units) Analysis By Type, 2020 to 2024
    • Current and Future Market Size Value (USD Billion) & Volume (Units) Analysis and Forecast By Type, 2025 to 2035
      • Lithium Large-area Neutron Detectors
      • Fast Neutron Detectors
      • Scintillation Neutron Detectors
      • Semiconductor Neutron Detectors
    • Y-o-Y Growth Trend Analysis By Type, 2020 to 2024
    • Absolute $ Opportunity Analysis By Type, 2025 to 2035
  7. Global Market Analysis 2020 to 2024 and Forecast 2025 to 2035, By Application
    • Introduction / Key Findings
    • Historical Market Size Value (USD Billion) & Volume (Units) Analysis By Application, 2020 to 2024
    • Current and Future Market Size Value (USD Billion) & Volume (Units) Analysis and Forecast By Application, 2025 to 2035
      • Nuclear Power
      • Aerospace & Defense
      • Urban Detection Networks
      • Others
    • Y-o-Y Growth Trend Analysis By Application, 2020 to 2024
    • Absolute $ Opportunity Analysis By Application, 2025 to 2035
  8. Global Market Analysis 2020 to 2024 and Forecast 2025 to 2035, By Region
    • Introduction
    • Historical Market Size Value (USD Billion) & Volume (Units) Analysis By Region, 2020 to 2024
    • Current Market Size Value (USD Billion) & Volume (Units) Analysis and Forecast By Region, 2025 to 2035
      • North America
      • Latin America
      • Western Europe
      • Eastern Europe
      • East Asia
      • South Asia & Pacific
      • Middle East and Africa
    • Market Attractiveness Analysis By Region
  9. North America Market Analysis 2020 to 2024 and Forecast 2025 to 2035, By Country
    • Historical Market Size Value (USD Billion) & Volume (Units) Trend Analysis By Market Taxonomy, 2020 to 2024
    • Market Size Value (USD Billion) & Volume (Units) Forecast By Market Taxonomy, 2025 to 2035
      • By Country
        • USA
        • Canada
        • Mexico
      • By Type
      • By Application
    • Market Attractiveness Analysis
      • By Country
      • By Type
      • By Application
    • Key Takeaways
  10. Latin America Market Analysis 2020 to 2024 and Forecast 2025 to 2035, By Country
    • Historical Market Size Value (USD Billion) & Volume (Units) Trend Analysis By Market Taxonomy, 2020 to 2024
    • Market Size Value (USD Billion) & Volume (Units) Forecast By Market Taxonomy, 2025 to 2035
      • By Country
        • Brazil
        • Argentina
        • Rest of LATAM
      • By Type
      • By Application
    • Market Attractiveness Analysis
      • By Country
      • By Type
      • By Application
    • Key Takeaways
  11. Western Europe Market Analysis 2020 to 2024 and Forecast 2025 to 2035, By Country
    • Historical Market Size Value (USD Billion) & Volume (Units) Trend Analysis By Market Taxonomy, 2020 to 2024
    • Market Size Value (USD Billion) & Volume (Units) Forecast By Market Taxonomy, 2025 to 2035
      • By Country
        • Germany
        • Italy
        • France
        • UK
        • Spain
        • BENELUX
        • Nordic
        • Rest of W.Europe
      • By Type
      • By Application
    • Market Attractiveness Analysis
      • By Country
      • By Type
      • By Application
    • Key Takeaways
  12. Eastern Europe Market Analysis 2020 to 2024 and Forecast 2025 to 2035, By Country
    • Historical Market Size Value (USD Billion) & Volume (Units) Trend Analysis By Market Taxonomy, 2020 to 2024
    • Market Size Value (USD Billion) & Volume (Units) Forecast By Market Taxonomy, 2025 to 2035
      • By Country
        • Russia
        • Hungary
        • Poland
        • Balkan & Baltics
        • Rest of E. Europe
      • By Type
      • By Application
    • Market Attractiveness Analysis
      • By Country
      • By Type
      • By Application
    • Key Takeaways
  13. East Asia Market Analysis 2020 to 2024 and Forecast 2025 to 2035, By Country
    • Historical Market Size Value (USD Billion) & Volume (Units) Trend Analysis By Market Taxonomy, 2020 to 2024
    • Market Size Value (USD Billion) & Volume (Units) Forecast By Market Taxonomy, 2025 to 2035
      • By Country
        • China
        • Japan
        • South Korea
      • By Type
      • By Application
    • Market Attractiveness Analysis
      • By Country
      • By Type
      • By Application
    • Key Takeaways
  14. South Asia & Pacific Market Analysis 2020 to 2024 and Forecast 2025 to 2035, By Country
    • Historical Market Size Value (USD Billion) & Volume (Units) Trend Analysis By Market Taxonomy, 2020 to 2024
    • Market Size Value (USD Billion) & Volume (Units) Forecast By Market Taxonomy, 2025 to 2035
      • By Country
        • India
        • Australia & New Zealand
        • ASEAN
        • Rest of SAP
      • By Type
      • By Application
    • Market Attractiveness Analysis
      • By Country
      • By Type
      • By Application
    • Key Takeaways
  15. Middle East and Africa Market Analysis 2020 to 2024 and Forecast 2025 to 2035, By Country
    • Historical Market Size Value (USD Billion) & Volume (Units) Trend Analysis By Market Taxonomy, 2020 to 2024
    • Market Size Value (USD Billion) & Volume (Units) Forecast By Market Taxonomy, 2025 to 2035
      • By Country
        • GCC Countries
        • Northern Africa
        • South Africa
        • Turkiye
        • Rest of MEA
      • By Type
      • By Application
    • Market Attractiveness Analysis
      • By Country
      • By Type
      • By Application
    • Key Takeaways
  16. Key Countries Market Analysis
    • USA
      • Pricing Analysis
      • Market Share Analysis, 2024
        • By Type
        • By Application
    • Canada
      • Pricing Analysis
      • Market Share Analysis, 2024
        • By Type
        • By Application
    • Brazil
      • Pricing Analysis
      • Market Share Analysis, 2024
        • By Type
        • By Application
    • Mexico
      • Pricing Analysis
      • Market Share Analysis, 2024
        • By Type
        • By Application
    • Argentina
      • Pricing Analysis
      • Market Share Analysis, 2024
        • By Type
        • By Application
  17. Market Structure Analysis
    • Competition Dashboard
    • Competition Benchmarking
    • Market Share Analysis of Top Players
      • By Regional
      • By Type
      • By Application
  18. Competition Analysis
    • Competition Deep Dive
      • Thermo Fisher Scientific
        • Overview
        • Product Portfolio
        • Profitability by Market Segments (Product/Age /Sales Channel/Region)
        • Sales Footprint
        • Strategy Overview
          • Marketing Strategy
          • Product Strategy
          • Channel Strategy
      • Mirion Technologies
        • Overview
        • Product Portfolio
        • Profitability by Market Segments (Product/Age /Sales Channel/Region)
        • Sales Footprint
        • Strategy Overview
          • Marketing Strategy
          • Product Strategy
          • Channel Strategy
      • Lanthan Biosciences
        • Overview
        • Product Portfolio
        • Profitability by Market Segments (Product/Age /Sales Channel/Region)
        • Sales Footprint
        • Strategy Overview
          • Marketing Strategy
          • Product Strategy
          • Channel Strategy
      • RADEX
        • Overview
        • Product Portfolio
        • Profitability by Market Segments (Product/Age /Sales Channel/Region)
        • Sales Footprint
        • Strategy Overview
          • Marketing Strategy
          • Product Strategy
          • Channel Strategy
      • Fluke Corporation
        • Overview
        • Product Portfolio
        • Profitability by Market Segments (Product/Age /Sales Channel/Region)
        • Sales Footprint
        • Strategy Overview
          • Marketing Strategy
          • Product Strategy
          • Channel Strategy
      • Canberra (A subsidiary of Mirion Technologies)
        • Overview
        • Product Portfolio
        • Profitability by Market Segments (Product/Age /Sales Channel/Region)
        • Sales Footprint
        • Strategy Overview
          • Marketing Strategy
          • Product Strategy
          • Channel Strategy
      • Leidos
        • Overview
        • Product Portfolio
        • Profitability by Market Segments (Product/Age /Sales Channel/Region)
        • Sales Footprint
        • Strategy Overview
          • Marketing Strategy
          • Product Strategy
          • Channel Strategy
      • Qualtrex
        • Overview
        • Product Portfolio
        • Profitability by Market Segments (Product/Age /Sales Channel/Region)
        • Sales Footprint
        • Strategy Overview
          • Marketing Strategy
          • Product Strategy
          • Channel Strategy
      • ORTEC (A subsidiary of AMETEK)
        • Overview
        • Product Portfolio
        • Profitability by Market Segments (Product/Age /Sales Channel/Region)
        • Sales Footprint
        • Strategy Overview
          • Marketing Strategy
          • Product Strategy
          • Channel Strategy
      • Harshaw Tracer
        • Overview
        • Product Portfolio
        • Profitability by Market Segments (Product/Age /Sales Channel/Region)
        • Sales Footprint
        • Strategy Overview
          • Marketing Strategy
          • Product Strategy
          • Channel Strategy
  19. Assumptions & Acronyms Used
  20. Research Methodology

List of Tables

  • Table 1: Global Market Value (USD Billion) Forecast by Region, 2020-2035
  • Table 2: Global Market Volume (Units) Forecast by Region, 2020-2035
  • Table 3: Global Market Value (USD Billion) Forecast by Type, 2020-2035
  • Table 4: Global Market Volume (Units) Forecast by Type, 2020-2035
  • Table 5: Global Market Value (USD Billion) Forecast by Application, 2020-2035
  • Table 6: Global Market Volume (Units) Forecast by Application, 2020-2035
  • Table 7: North America Market Value (USD Billion) Forecast by Country, 2020-2035
  • Table 8: North America Market Volume (Units) Forecast by Country, 2020-2035
  • Table 9: North America Market Value (USD Billion) Forecast by Type, 2020-2035
  • Table 10: North America Market Volume (Units) Forecast by Type, 2020-2035
  • Table 11: North America Market Value (USD Billion) Forecast by Application, 2020-2035
  • Table 12: North America Market Volume (Units) Forecast by Application, 2020-2035
  • Table 13: Latin America Market Value (USD Billion) Forecast by Country, 2020-2035
  • Table 14: Latin America Market Volume (Units) Forecast by Country, 2020-2035
  • Table 15: Latin America Market Value (USD Billion) Forecast by Type, 2020-2035
  • Table 16: Latin America Market Volume (Units) Forecast by Type, 2020-2035
  • Table 17: Latin America Market Value (USD Billion) Forecast by Application, 2020-2035
  • Table 18: Latin America Market Volume (Units) Forecast by Application, 2020-2035
  • Table 19: Western Europe Market Value (USD Billion) Forecast by Country, 2020-2035
  • Table 20: Western Europe Market Volume (Units) Forecast by Country, 2020-2035
  • Table 21: Western Europe Market Value (USD Billion) Forecast by Type, 2020-2035
  • Table 22: Western Europe Market Volume (Units) Forecast by Type, 2020-2035
  • Table 23: Western Europe Market Value (USD Billion) Forecast by Application, 2020-2035
  • Table 24: Western Europe Market Volume (Units) Forecast by Application, 2020-2035
  • Table 25: Eastern Europe Market Value (USD Billion) Forecast by Country, 2020-2035
  • Table 26: Eastern Europe Market Volume (Units) Forecast by Country, 2020-2035
  • Table 27: Eastern Europe Market Value (USD Billion) Forecast by Type, 2020-2035
  • Table 28: Eastern Europe Market Volume (Units) Forecast by Type, 2020-2035
  • Table 29: Eastern Europe Market Value (USD Billion) Forecast by Application, 2020-2035
  • Table 30: Eastern Europe Market Volume (Units) Forecast by Application, 2020-2035
  • Table 31: East Asia Market Value (USD Billion) Forecast by Country, 2020-2035
  • Table 32: East Asia Market Volume (Units) Forecast by Country, 2020-2035
  • Table 33: East Asia Market Value (USD Billion) Forecast by Type, 2020-2035
  • Table 34: East Asia Market Volume (Units) Forecast by Type, 2020-2035
  • Table 35: East Asia Market Value (USD Billion) Forecast by Application, 2020-2035
  • Table 36: East Asia Market Volume (Units) Forecast by Application, 2020-2035
  • Table 37: South Asia & Pacific Market Value (USD Billion) Forecast by Country, 2020-2035
  • Table 38: South Asia & Pacific Market Volume (Units) Forecast by Country, 2020-2035
  • Table 39: South Asia & Pacific Market Value (USD Billion) Forecast by Type, 2020-2035
  • Table 40: South Asia & Pacific Market Volume (Units) Forecast by Type, 2020-2035
  • Table 41: South Asia & Pacific Market Value (USD Billion) Forecast by Application, 2020-2035
  • Table 42: South Asia & Pacific Market Volume (Units) Forecast by Application, 2020-2035
  • Table 43: Middle East and Africa Market Value (USD Billion) Forecast by Country, 2020-2035
  • Table 44: Middle East and Africa Market Volume (Units) Forecast by Country, 2020-2035
  • Table 45: Middle East and Africa Market Value (USD Billion) Forecast by Type, 2020-2035
  • Table 46: Middle East and Africa Market Volume (Units) Forecast by Type, 2020-2035
  • Table 47: Middle East and Africa Market Value (USD Billion) Forecast by Application, 2020-2035
  • Table 48: Middle East and Africa Market Volume (Units) Forecast by Application, 2020-2035

List of Figures

  • Figure 1: Global Market Volume (Units) Forecast 2020-2035
  • Figure 2: Global Market Pricing Analysis
  • Figure 3: Global Market Value (USD Billion) Forecast 2020-2035
  • Figure 4: Global Market Value Share and BPS Analysis by Type, 2025 and 2035
  • Figure 5: Global Market Y-o-Y Growth Comparison by Type, 2025-2035
  • Figure 6: Global Market Attractiveness Analysis by Type
  • Figure 7: Global Market Value Share and BPS Analysis by Application, 2025 and 2035
  • Figure 8: Global Market Y-o-Y Growth Comparison by Application, 2025-2035
  • Figure 9: Global Market Attractiveness Analysis by Application
  • Figure 10: Global Market Value (USD Billion) Share and BPS Analysis by Region, 2025 and 2035
  • Figure 11: Global Market Y-o-Y Growth Comparison by Region, 2025-2035
  • Figure 12: Global Market Attractiveness Analysis by Region
  • Figure 13: North America Market Incremental $ Opportunity, 2025-2035
  • Figure 14: Latin America Market Incremental $ Opportunity, 2025-2035
  • Figure 15: Western Europe Market Incremental $ Opportunity, 2025-2035
  • Figure 16: Eastern Europe Market Incremental $ Opportunity, 2025-2035
  • Figure 17: East Asia Market Incremental $ Opportunity, 2025-2035
  • Figure 18: South Asia & Pacific Market Incremental $ Opportunity, 2025-2035
  • Figure 19: Middle East and Africa Market Incremental $ Opportunity, 2025-2035
  • Figure 20: North America Market Value Share and BPS Analysis by Country, 2025 and 2035
  • Figure 21: North America Market Value Share and BPS Analysis by Type, 2025 and 2035
  • Figure 22: North America Market Y-o-Y Growth Comparison by Type, 2025-2035
  • Figure 23: North America Market Attractiveness Analysis by Type
  • Figure 24: North America Market Value Share and BPS Analysis by Application, 2025 and 2035
  • Figure 25: North America Market Y-o-Y Growth Comparison by Application, 2025-2035
  • Figure 26: North America Market Attractiveness Analysis by Application
  • Figure 27: Latin America Market Value Share and BPS Analysis by Country, 2025 and 2035
  • Figure 28: Latin America Market Value Share and BPS Analysis by Type, 2025 and 2035
  • Figure 29: Latin America Market Y-o-Y Growth Comparison by Type, 2025-2035
  • Figure 30: Latin America Market Attractiveness Analysis by Type
  • Figure 31: Latin America Market Value Share and BPS Analysis by Application, 2025 and 2035
  • Figure 32: Latin America Market Y-o-Y Growth Comparison by Application, 2025-2035
  • Figure 33: Latin America Market Attractiveness Analysis by Application
  • Figure 34: Western Europe Market Value Share and BPS Analysis by Country, 2025 and 2035
  • Figure 35: Western Europe Market Value Share and BPS Analysis by Type, 2025 and 2035
  • Figure 36: Western Europe Market Y-o-Y Growth Comparison by Type, 2025-2035
  • Figure 37: Western Europe Market Attractiveness Analysis by Type
  • Figure 38: Western Europe Market Value Share and BPS Analysis by Application, 2025 and 2035
  • Figure 39: Western Europe Market Y-o-Y Growth Comparison by Application, 2025-2035
  • Figure 40: Western Europe Market Attractiveness Analysis by Application
  • Figure 41: Eastern Europe Market Value Share and BPS Analysis by Country, 2025 and 2035
  • Figure 42: Eastern Europe Market Value Share and BPS Analysis by Type, 2025 and 2035
  • Figure 43: Eastern Europe Market Y-o-Y Growth Comparison by Type, 2025-2035
  • Figure 44: Eastern Europe Market Attractiveness Analysis by Type
  • Figure 45: Eastern Europe Market Value Share and BPS Analysis by Application, 2025 and 2035
  • Figure 46: Eastern Europe Market Y-o-Y Growth Comparison by Application, 2025-2035
  • Figure 47: Eastern Europe Market Attractiveness Analysis by Application
  • Figure 48: East Asia Market Value Share and BPS Analysis by Country, 2025 and 2035
  • Figure 49: East Asia Market Value Share and BPS Analysis by Type, 2025 and 2035
  • Figure 50: East Asia Market Y-o-Y Growth Comparison by Type, 2025-2035
  • Figure 51: East Asia Market Attractiveness Analysis by Type
  • Figure 52: East Asia Market Value Share and BPS Analysis by Application, 2025 and 2035
  • Figure 53: East Asia Market Y-o-Y Growth Comparison by Application, 2025-2035
  • Figure 54: East Asia Market Attractiveness Analysis by Application
  • Figure 55: South Asia & Pacific Market Value Share and BPS Analysis by Country, 2025 and 2035
  • Figure 56: South Asia & Pacific Market Value Share and BPS Analysis by Type, 2025 and 2035
  • Figure 57: South Asia & Pacific Market Y-o-Y Growth Comparison by Type, 2025-2035
  • Figure 58: South Asia & Pacific Market Attractiveness Analysis by Type
  • Figure 59: South Asia & Pacific Market Value Share and BPS Analysis by Application, 2025 and 2035
  • Figure 60: South Asia & Pacific Market Y-o-Y Growth Comparison by Application, 2025-2035
  • Figure 61: South Asia & Pacific Market Attractiveness Analysis by Application
  • Figure 62: Middle East and Africa Market Value Share and BPS Analysis by Country, 2025 and 2035
  • Figure 63: Middle East and Africa Market Value Share and BPS Analysis by Type, 2025 and 2035
  • Figure 64: Middle East and Africa Market Y-o-Y Growth Comparison by Type, 2025-2035
  • Figure 65: Middle East and Africa Market Attractiveness Analysis by Type
  • Figure 66: Middle East and Africa Market Value Share and BPS Analysis by Application, 2025 and 2035
  • Figure 67: Middle East and Africa Market Y-o-Y Growth Comparison by Application, 2025-2035
  • Figure 68: Middle East and Africa Market Attractiveness Analysis by Application
  • Figure 69: Global Market - Tier Structure Analysis
  • Figure 70: Global Market - Company Share Analysis

Frequently Asked Questions

What is the projected size of the neutron detectors market in 2025?

The market is valued at USD 2.0 billion in 2025.

What is the forecasted size of the neutron detectors market by 2035?

The market is projected to reach USD 6.5 billion by 2035, reflecting a CAGR of 11.9%.

Which application leads the neutron detectors market in 2025?

The nuclear power application is expected to lead with a 35% market share in 2025.

Which region holds the largest share of the neutron detectors market in 2025?

North America is projected to hold the largest regional share, driven by nuclear energy and defense sectors.

Which of the type segments is leading the neutron detectors market in 2025?

Lithium Large-area neutron detectors are leading the type segment with a prominent market share of 40%.

Explore Similar Insights

Future Market Insights

Neutron Detectors Market