Transparent Coating Market Size and Share Forecast Outlook for 2025 to 2035

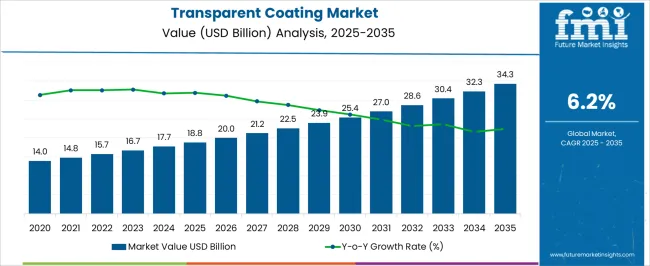
The global market of transparent coatings is projected to worth USD 16.6 billion in 2023. The market is likely to surpass USD 31.2 billion by 2033 at a significant CAGR of 6.5% during the forecast period.

The rising demand for transparent coatings from optical glass, wood and solar panel applications is expected to drive the market growth. These coatings are used for protection of glass from operational and environmental factors such as moisture, UV rays, abrasion, scratch, etc.

The transparent coating industry is benefiting from increased customer demand for transparent and clear thin layer coatings to maintain product visibility while improving surface qualities. In the coming years, the use of nanotechnology in transparent coatings will offer up new application prospects for these coatings.

Other Drivers Propelling the Demand for Transparent Coating include:

  • Rising demand for surface protection is driving the market of transparent coatings
  • Increasing use of transparent hydrophobic coatings for water resistant applications
  • The growing use of glass facades in commercial infrastructure spurring the demand for transparent glass coatings
  • Transparent coatings to increase the efficiency of solar panels is expected to drive the market growth
  • Rising use of transparent coatings as wood and metal preservative to augment the market growth

Challenges for Companies /Manufacturers in the Market:

  • High cost of transparent coatings to impede the market growth
  • High capital investment to establish nano-technology based equipment setup for transparent coatings
  • Degradation of coatings cannot be identified due to transparent nature

Opportunities in the Market:

  • R&D to produce multifunctional transparent coatings for addressing multiple issues in same product
  • Introducing transparent coatings for consumer products to boost the product sales
  • Market participants can benefit from entering in emerging markets
  • Launch of sustainable transparent coatings for a long run in the market
  • Advancement in coating technology is likely to create opportunities for the market in the coming years.

Latest Trends in the Market:

  • Rising consumer preference for transparent coatings
  • Growing adoption of transparent protective coatings over displays of electronic devices
  • Launch of Easy-to-use and Ready-to-use transparent coatings on e-commerce platform
  • Transparent coatings made of Eco-friendly materials is a growing trend in the product market
  • The growing use of nanotechnology to produce highly efficient coatings in minimal material usage
Attribute Details
Transparent Coating Market Size (2023) USD 16.6 billion
Transparent Coating Market Projected Size (2033) USD 31.2 billion
Value CAGR (2023 to 2033) 6.5%

Transparent Coating Demand Analysis (2018 to 2022) vs Projected Forecast (2023 to 2033)

During 2018 and 2022, the global transparent coating market grew with 4.7% CAGR. The product witnessed increasing demand from end-use industries as its benefits and methods of applications became vibrant.

The demand for transparent coatings remained high from electronics applications where these coatings are primarily used over electronic display to protect it from water, scratches and absorb the UV radiation.

Long-Term Forecast for the Transparent Coating Industry Across Key Sectors

During the forecast period of 2023 to 2033, the transparent Coating market is anticipated to grow at a CAGR of 6.5%. The product’s demand will spur due to their growing usage in multiple end-uses that are set to capture significant portion of market share.

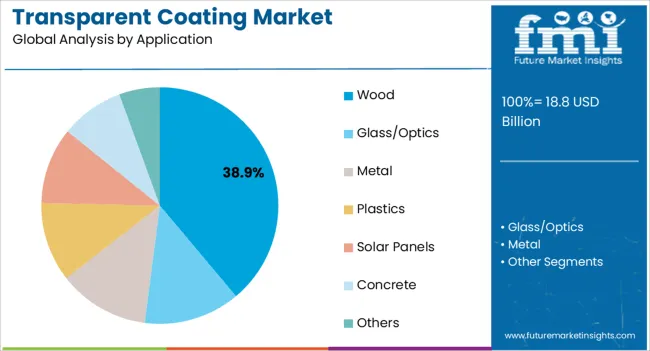
The solar panel application of the transparent coatings is expected to lead the market expansion in the coming years. The rising inclination towards renewable energy and thereby growing solar energy market is bolstering the demand for self-cleaning transparent coatings. Similarly, the expansion in optics industry is set to fuel the growth for transparent coatings market. The rising adoption of these coatings for UV resistance, anti-glare, anti-fogging and night-vision applications is anticipated to create lucrative growth opportunities for the product market in coming years.

Analysis of Top Countries Promoting Transparent Coating Utilization and Development

Increasing usage of transparent coatings in wood surface Applications will propel the product demand in United States

Country The United States
Market Size (USD billion) by End of Forecast Period (2033) USD 5.0 billion
CAGR % 2023 to End of Forecast (2033) 6.0%

The transparent coating market in the United States is expected to reach USD 5.0 billion by the end of forecast period. The market will expand at a CAGR of 6.0% during this period. The growing usage of transparent coating in wood surface coating applications in furniture and construction industry is expected to be the key growth driver for the market in the country.
Rising usage of Transparent Coating in solar panel applications to drive the market growth in India

Country India
Market Size (USD billion) by End of Forecast Period (2033) USD 3.7 billion
CAGR % 2023 to End of Forecast (2033) 7.2%

In India, the transparent coatings market is anticipated to grow at a 7.2% CAGR to reach the market size of USD 3.7 billion by the end of 2033. The increasing use of transparent coatings in solar panel applications to enhance the efficiency and self-cleaning properties of the solar panel surface from dirt and pollution is the key growth driver for the market in India.

Expanding plastics industry in China to fuel the market demand for Transparent Coating

Country China
Market Size (USD billion) by End of Forecast Period (2033) USD 4.4 billion
CAGR % 2023 to End of Forecast (2033) 6.8%

China has the world’s largest plastic industry where transparent coatings are used to increase the strength, durability and antimicrobial activity of the plastics. With the growing production of plastics and bio-plastics in the country and rising demand for quality products from the end-users the market for transparent coatings in china is anticipated to grow at a considerable CAGR of 6.8% from 2023 to 2033 and reach a market size of USD 4.4 billion by the end of forecast period.

Germany to lead the growth of transparent coatings market in European region

Country Germany
Market Size (USD billion) by End of Forecast Period (2033) USD 3.1 billion
CAGR % 2023 to End of Forecast (2033) 5.7%

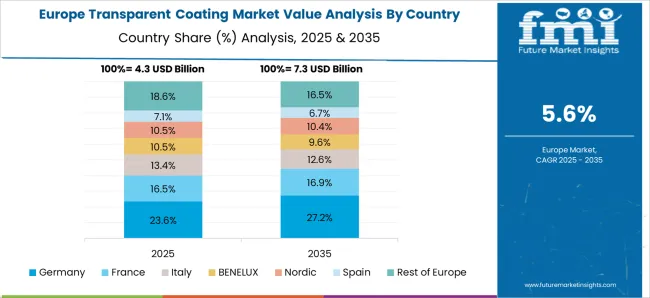
In the European region, Germany will be the key country to lead the expansion of transparent coating market. The country’s demand for transparent coating is expected to grow at 5.7% CAGR in terms of value to reach a market size of USD 3.1 billion by 2033. Steady growth among the end-use industries coupled with the introduction of advanced coating technologies will cater to the growth of the market.
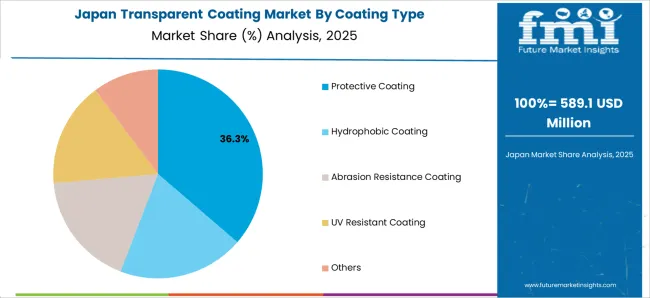
Growing technological advancement in transparent coatings for optical applications to augment the market growth in Japan

Country Japan
Market Size (USD billion) by End of Forecast Period (2033) USD 2.5 billion
CAGR % 2023 to End of Forecast (2033) 5.9%

Japan is ranked second in the global optical industry. The country offers substantial growth potential in the optical coatings market, with transparent coatings projected to play a crucial role. By 2033, the country’s transparent coatings market is projected to worth more than USD 2.5 billion.

Transparent Coating Market Insights by Coating Type and Industry Application

Which segment dominate the market based on coating type?

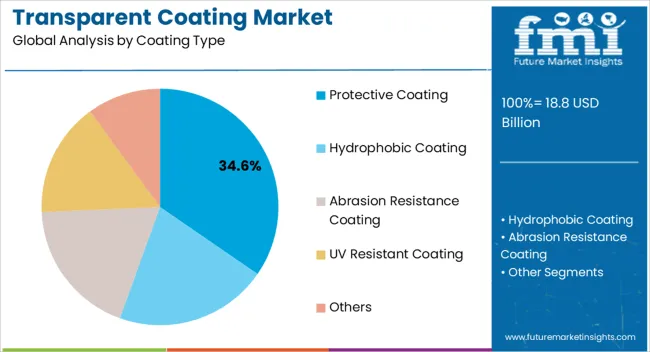
Based on the coating type, the protective coating segment dominates the market with more than 40% of the market share. These coatings are preferably applied on wood, glass, metal, and solar panels to protect the surface from environmental factors.

The main advantage of using protective coatings is that they not only shield the surface of the material they're applied to, but also maintain its appearance, preserving the aesthetic appeal of the product. For instance, coatings applied to wood or metal surfaces in the furniture industry protect the surface from wear and tear, corrosion, and degradation, while also enhancing their visual appeal. As a result, the demand for these coatings is expected to grow significantly in the coming years.

What are the growth prospects for Transparent Coating in solar panel applications?

With a CAGR of more than 10%, the solar panel applications segment is anticipated to lead the market expansion of transparent coatings during the forecast period. Particularly, transparent self-cleaning coatings have gained significant traction from the solar panel application where these coatings are used to protect the surface from dirt and dust. These coatings reduce the excess efforts of brushing, blowing and washing the debris from the panel surface and improve their efficiency to produce electricity.

The global solar panel market is anticipated to grow at an 8.9% CAGR during the forecast period which will benefit the transparent coatings market all over the world.
Competitive Landscape and Strategic Outlook of the Transparent Coating Market

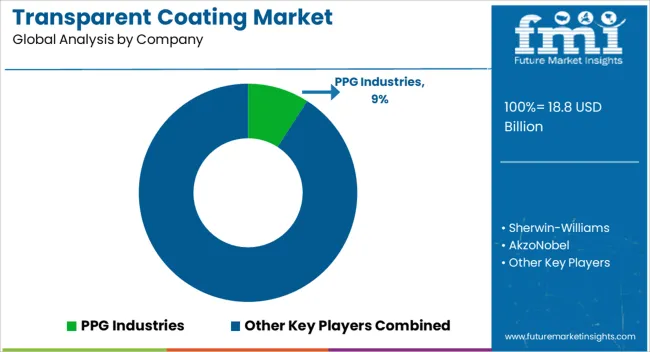
The global transparent coatings market is fragmented in nature where a few leading players occupy less than 30% of the market share. In order to drive the market's expansion into new areas, leading manufacturers have embraced the important industry trend of investigating consumer product applications for transparent coatings.

Some manufacturers of transparent coatings are also offering user-friendly, ready-to-use products through e-commerce platforms, which helps them to reach a wider audience and educate their customers on innovative products.

Apart from this following strategies are adopted by the key market participants:

Product Innovation and Differentiation

Companies invest hugely in research and development to introduce innovative products that offer enhanced efficiency, reliability, sustainability, recyclability and cost-effectiveness. Product innovation enables companies to differentiate themselves from their competitors and cater to the evolving needs of customers.

In October 2022, In order to encourage the cyclical use of paper products, Shin-Etsu Chemical has created a transparent, water-resistant covering material.

Strategic Partnerships and Collaborations

Key players in the industry often form strategic partnerships and collaborations with other companies to leverage their strengths and expand their reach in the market. Such collaborations also allow companies to gain access to new technologies and markets.

Expansion into Emerging Markets

The Transparent Coating industry is witnessing significant growth in emerging markets such as India and Middle East. Key players are expanding their presence in these markets by establishing local manufacturing facilities and strengthening their distribution networks.

Mergers and Acquisitions

Key players in the Transparent Coating industry often engage in mergers and acquisitions to consolidate their market position, expand their product portfolio, and gain access to new markets.

In April 2022, Sherwin-Williams Company announced the acquisition of European Industrial Coatings business of Sika AG.

Key Players in the Market

  • Woodver
  • Wincoat
  • TWI Ltd.
  • NEI Corporation
  • Holland Shielding Systems BV
  • HeiQ Materials AG
  • Denton Vacuum
  • IRO Coating Additive Co. Ltd.
  • MAC Thin Films
  • Isonem Paint & Insulation Technologies
  • Maris (Saint-Gobain)
  • Nippon Paint (India) Private Limited
  • NEXT Energy Technologies
  • SolarWindow
  • Evaporated Coatings Inc.
  • Axalta Coating Systems
  • AkzoNobel
  • PPG Industries
  • Hempel
  • 3M
  • Sherwin-Williams

Transparent Coating Market Segmentation by Material Composition, Substrate Type, and End Use Sector

By Coating Type:

  • Protective Coating
  • Hydrophobic Coating
  • Abrasion resistance Coating
  • UV Resistant Coating
  • Others

By Application:

  • Wood
  • Glass/Optics
  • Metal
  • Plastics
  • Solar Panels
  • Concrete
  • Others

By Region:

  • North America
  • Latin America
  • Western Europe
  • Eastern Europe
  • East Asia
  • South Asia and Pacific
  • The Middle East and Africa

Table of Content

  • 1. Executive Summary
  • 2. Market Overview
  • 3. Key Market Trends
  • 4. Key Success Factors
  • 5. Global Market Demand Analysis 2018 to 2022 and Forecast, 2023 to 2033
  • 6. Global Market - Pricing Analysis
  • 7. Global Market Demand (in Value or Size in USD Billion) Analysis 2018 to 2022 and Forecast, 2023 to 2033
  • 8. Market Background
  • 9. Global Market Analysis 2018 to 2022 and Forecast 2023 to 2033, By Coating Type
    • 9.1. Protective Coating
    • 9.2. Hydrophobic Coating
    • 9.3. Abrasion Resistant Coating
    • 9.4. UV Resistant Coating
    • 9.5. Others
  • 10. Global Market Analysis 2018 to 2022 and Forecast 2023 to 2033, By Application
    • 10.1. Wood
    • 10.2. Glass/Optics
    • 10.3. Metal
    • 10.4. Plastics
    • 10.5. Solar Panels
    • 10.6. Concrete
    • 10.7. Others
  • 11. Global Market Analysis 2018 to 2022 and Forecast 2023 to 2033, By Region
    • 11.1. North America
    • 11.2. Latin America
    • 11.3. Western Europe
    • 11.4. Eastern Europe
    • 11.5. East Asia
    • 11.6. South Asia and Pacific
    • 11.7. Middle East and Africa
  • 12. North America Market Analysis 2018 to 2022 and Forecast 2023 to 2033
  • 13. Latin America Market Analysis 2018 to 2022 and Forecast 2023 to 2033
  • 14. Western Europe Market Analysis 2018 to 2022 and Forecast 2023 to 2033
  • 15. Eastern Europe Market Analysis 2018 to 2022 and Forecast 2023 to 2033
  • 16. East Asia Market Analysis 2018 to 2022 and Forecast 2023 to 2033
  • 17. South Asia and Pacific Market Analysis 2018 to 2022 and Forecast 2023 to 2033
  • 18. Middle East and Africa Market Analysis 2018 to 2022 and Forecast 2023 to 2033
  • 19. Key Countries Market Analysis
  • 20. Market Structure Analysis
  • 21. Competition Analysis
    • 21.1. Axalta Coating Systems
    • 21.2. AkzoNobel
    • 21.3. PPG Industries
    • 21.4. Hempel
    • 21.5. 3M
    • 21.6. Sherwin-Williams
    • 21.7. Woodver
    • 21.8. Wincoat
    • 21.9. TWI Ltd.
    • 21.10. NEI Corporation
    • 21.11. Holland Shielding Systems BV
    • 21.12. HeiQ Materials AG
    • 21.13. Denton Vacuum
    • 21.14. IRO Coating Additive Co. Ltd.
    • 21.15. MAC Thin Films
    • 21.16. Isonem Paint & Insulation Technologies
    • 21.17. Maris (Saint-Gobain)
    • 21.18. Nippon Paint (India) Private Limited
    • 21.19. NEXT Energy Technologies
    • 21.20. SolarWindow
    • 21.21. Evaporated Coatings Inc.
  • 22. Assumptions and Acronyms Used
  • 23. Research Methodology

List of Tables

Table 1: Global Market Value (US$ Billion) Forecast by Region, 2018 to 2033

Table 2: Global Market Volume (Tons) Forecast by Region, 2018 to 2033

Table 3: Global Market Value (US$ Billion) Forecast by Coating Type, 2018 to 2033

Table 4: Global Market Volume (Tons) Forecast by Coating Type, 2018 to 2033

Table 5: Global Market Value (US$ Billion) Forecast by Application, 2018 to 2033

Table 6: Global Market Volume (Tons) Forecast by Application, 2018 to 2033

Table 7: North America Market Value (US$ Billion) Forecast by Country, 2018 to 2033

Table 8: North America Market Volume (Tons) Forecast by Country, 2018 to 2033

Table 9: North America Market Value (US$ Billion) Forecast by Coating Type, 2018 to 2033

Table 10: North America Market Volume (Tons) Forecast by Coating Type, 2018 to 2033

Table 11: North America Market Value (US$ Billion) Forecast by Application, 2018 to 2033

Table 12: North America Market Volume (Tons) Forecast by Application, 2018 to 2033

Table 13: Latin America Market Value (US$ Billion) Forecast by Country, 2018 to 2033

Table 14: Latin America Market Volume (Tons) Forecast by Country, 2018 to 2033

Table 15: Latin America Market Value (US$ Billion) Forecast by Coating Type, 2018 to 2033

Table 16: Latin America Market Volume (Tons) Forecast by Coating Type, 2018 to 2033

Table 17: Latin America Market Value (US$ Billion) Forecast by Application, 2018 to 2033

Table 18: Latin America Market Volume (Tons) Forecast by Application, 2018 to 2033

Table 19: Western Europe Market Value (US$ Billion) Forecast by Country, 2018 to 2033

Table 20: Western Europe Market Volume (Tons) Forecast by Country, 2018 to 2033

Table 21: Western Europe Market Value (US$ Billion) Forecast by Coating Type, 2018 to 2033

Table 22: Western Europe Market Volume (Tons) Forecast by Coating Type, 2018 to 2033

Table 23: Western Europe Market Value (US$ Billion) Forecast by Application, 2018 to 2033

Table 24: Western Europe Market Volume (Tons) Forecast by Application, 2018 to 2033

Table 25: Eastern Europe Market Value (US$ Billion) Forecast by Country, 2018 to 2033

Table 26: Eastern Europe Market Volume (Tons) Forecast by Country, 2018 to 2033

Table 27: Eastern Europe Market Value (US$ Billion) Forecast by Coating Type, 2018 to 2033

Table 28: Eastern Europe Market Volume (Tons) Forecast by Coating Type, 2018 to 2033

Table 29: Eastern Europe Market Value (US$ Billion) Forecast by Application, 2018 to 2033

Table 30: Eastern Europe Market Volume (Tons) Forecast by Application, 2018 to 2033

Table 31: East Asia Market Value (US$ Billion) Forecast by Country, 2018 to 2033

Table 32: East Asia Market Volume (Tons) Forecast by Country, 2018 to 2033

Table 33: East Asia Market Value (US$ Billion) Forecast by Coating Type, 2018 to 2033

Table 34: East Asia Market Volume (Tons) Forecast by Coating Type, 2018 to 2033

Table 35: East Asia Market Value (US$ Billion) Forecast by Application, 2018 to 2033

Table 36: East Asia Market Volume (Tons) Forecast by Application, 2018 to 2033

Table 37: South Asia Market Value (US$ Billion) Forecast by Country, 2018 to 2033

Table 38: South Asia and Pacific Market Volume (Tons) Forecast by Country, 2018 to 2033

Table 39: South Asia and Pacific Market Value (US$ Billion) Forecast by Coating Type, 2018 to 2033

Table 40: South Asia and Pacific Market Volume (Tons) Forecast by Coating Type, 2018 to 2033

Table 41: South Asia and Pacific Market Value (US$ Billion) Forecast by Application, 2018 to 2033

Table 42: South Asia and Pacific Market Volume (Tons) Forecast by Application, 2018 to 2033

Table 43: Middle East and Africa Market Value (US$ Billion) Forecast by Country, 2018 to 2033

Table 44: Middle East and Africa Market Volume (Tons) Forecast by Country, 2018 to 2033

Table 45: Middle East and Africa Market Value (US$ Billion) Forecast by Coating Type, 2018 to 2033

Table 46: Middle East and Africa Market Volume (Tons) Forecast by Coating Type, 2018 to 2033

Table 47: Middle East and Africa Market Value (US$ Billion) Forecast by Application, 2018 to 2033

Table 48: Middle East and Africa Market Volume (Tons) Forecast by Application, 2018 to 2033

List of Figures

Figure 1: Global Market Value (US$ Billion) by Application, 2023 to 2033

Figure 2: Global Market Value (US$ Billion) by Region, 2023 to 2033

Figure 3: Global Market Value (US$ Billion) Analysis by Region, 2018 to 2033

Figure 4: Global Market Volume (Tons) Analysis by Region, 2018 to 2033

Figure 5: Global Market Share and BPS Analysis by Region, 2023 to 2033

Figure 6: Global Market Y-o-Y Growth (%) Projections by Region, 2023 to 2033

Figure 7: Global Market Value (US$ Billion) Analysis by Coating Type, 2018 to 2033

Figure 8: Global Market Volume (Tons) Analysis by Coating Type, 2018 to 2033

Figure 9: Global Market Share and BPS Analysis by Coating Type, 2023 to 2033

Figure 10: Global Market Y-o-Y Growth (%) Projections by Coating Type, 2023 to 2033

Figure 11: Global Market Attractiveness by Coating Type, 2023 to 2033

Figure 12: Global Market Value (US$ Billion) Analysis by Application, 2018 to 2033

Figure 13: Global Market Volume (Tons) Analysis by Application, 2018 to 2033

Figure 14: Global Market Share and BPS Analysis by Application, 2023 to 2033

Figure 15: Global Market Y-o-Y Growth (%) Projections by Application, 2023 to 2033

Figure 16: Global Market Attractiveness by Application, 2023 to 2033

Figure 17: Global Market Attractiveness by Region, 2023 to 2033

Figure 18: North America Market Value (US$ Billion) by Coating Type, 2023 to 2033

Figure 19: North America Market Value (US$ Billion) by Application, 2023 to 2033

Figure 20: North America Market Value (US$ Billion) by Country, 2023 to 2033

Figure 21: North America Market Value (US$ Billion) Analysis by Country, 2018 to 2033

Figure 22: North America Market Volume (Tons) Analysis by Country, 2018 to 2033

Figure 23: North America Market Share and BPS Analysis by Country, 2023 to 2033

Figure 24: North America Market Y-o-Y Growth (%) Projections by Country, 2023 to 2033

Figure 25: North America Market Attractiveness by Country, 2023 to 2033

Figure 26: North America Market Value (US$ Billion) Analysis by Coating Type, 2018 to 2033

Figure 27: North America Market Volume (Tons) Analysis by Coating Type, 2018 to 2033

Figure 28: North America Market Share and BPS Analysis by Coating Type, 2023 to 2033

Figure 29: North America Market Y-o-Y Growth (%) Projections by Coating Type, 2023 to 2033

Figure 30: North America Market Attractiveness by Coating Type, 2023 to 2033

Figure 31: North America Market Value (US$ Billion) Analysis by Application, 2018 to 2033

Figure 32: North America Market Volume (Tons) Analysis by Application, 2018 to 2033

Figure 33: North America Market Share and BPS Analysis by Application, 2023 to 2033

Figure 34: North America Market Y-o-Y Growth (%) Projections by Application, 2023 to 2033

Figure 35: North America Market Attractiveness by Application, 2023 to 2033

Figure 36: Latin America Market Value (US$ Billion) by Coating Type, 2023 to 2033

Figure 37: Latin America Market Value (US$ Billion) by Application, 2023 to 2033

Figure 38: Latin America Market Value (US$ Billion) by Country, 2023 to 2033

Figure 39: Latin America Market Value (US$ Billion) Analysis by Country, 2018 to 2033

Figure 40: Latin America Market Volume (Tons) Analysis by Country, 2018 to 2033

Figure 41: Latin America Market Share and BPS Analysis by Country, 2023 to 2033

Figure 42: Latin America Market Y-o-Y Growth (%) Projections by Country, 2023 to 2033

Figure 43: Latin America Market Attractiveness by Country, 2023 to 2033

Figure 44: Latin America Market Value (US$ Billion) Analysis by Coating Type, 2018 to 2033

Figure 45: Latin America Market Volume (Tons) Analysis by Coating Type, 2018 to 2033

Figure 46: Latin America Market Share and BPS Analysis by Coating Type, 2023 to 2033

Figure 47: Latin America Market Y-o-Y Growth (%) Projections by Coating Type, 2023 to 2033

Figure 48: Latin America Market Attractiveness by Coating Type, 2023 to 2033

Figure 49: Latin America Market Value (US$ Billion) Analysis by Application, 2018 to 2033

Figure 50: Latin America Market Volume (Tons) Analysis by Application, 2018 to 2033

Figure 51: Latin America Market Share and BPS Analysis by Application, 2023 to 2033

Figure 52: Latin America Market Y-o-Y Growth (%) Projections by Application, 2023 to 2033

Figure 53: Latin America Market Attractiveness by Application, 2023 to 2033

Figure 54: Western Europe Market Value (US$ Billion) by Coating Type, 2023 to 2033

Figure 55: Western Europe Market Value (US$ Billion) by Application, 2023 to 2033

Figure 56: Western Europe Market Value (US$ Billion) by Country, 2023 to 2033

Figure 57: Western Europe Market Value (US$ Billion) Analysis by Country, 2018 to 2033

Figure 58: Western Europe Market Volume (Tons) Analysis by Country, 2018 to 2033

Figure 59: Western Europe Market Share and BPS Analysis by Country, 2023 to 2033

Figure 60: Western Europe Market Y-o-Y Growth (%) Projections by Country, 2023 to 2033

Figure 61: Western Europe Market Attractiveness by Country, 2023 to 2033

Figure 62: Western Europe Market Value (US$ Billion) Analysis by Coating Type, 2018 to 2033

Figure 63: Western Europe Market Volume (Tons) Analysis by Coating Type, 2018 to 2033

Figure 64: Western Europe Market Share and BPS Analysis by Coating Type, 2023 to 2033

Figure 65: Western Europe Market Y-o-Y Growth (%) Projections by Coating Type, 2023 to 2033

Figure 66: Western Europe Market Attractiveness by Coating Type, 2023 to 2033

Figure 67: Western Europe Market Value (US$ Billion) Analysis by Application, 2018 to 2033

Figure 68: Western Europe Market Volume (Tons) Analysis by Application, 2018 to 2033

Figure 69: Western Europe Market Share and BPS Analysis by Application, 2023 to 2033

Figure 70: Western Europe Market Y-o-Y Growth (%) Projections by Application, 2023 to 2033

Figure 71: Western Europe Market Attractiveness by Application, 2023 to 2033

Figure 72: Eastern Europe Market Value (US$ Billion) by Coating Type, 2023 to 2033

Figure 73: Eastern Europe Market Value (US$ Billion) by Application, 2023 to 2033

Figure 74: Eastern Europe Market Value (US$ Billion) by Country, 2023 to 2033

Figure 75: Eastern Europe Market Value (US$ Billion) Analysis by Country, 2018 to 2033

Figure 76: Eastern Europe Market Volume (Tons) Analysis by Country, 2018 to 2033

Figure 77: Eastern Europe Market Share and BPS Analysis by Country, 2023 to 2033

Figure 78: Eastern Europe Market Y-o-Y Growth (%) Projections by Country, 2023 to 2033

Figure 79: Eastern Europe Market Attractiveness by Country, 2023 to 2033

Figure 80: Eastern Europe Market Value (US$ Billion) Analysis by Coating Type, 2018 to 2033

Figure 81: Eastern Europe Market Volume (Tons) Analysis by Coating Type, 2018 to 2033

Figure 82: Eastern Europe Market Share and BPS Analysis by Coating Type, 2023 to 2033

Figure 83: Eastern Europe Market Y-o-Y Growth (%) Projections by Coating Type, 2023 to 2033

Figure 84: Eastern Europe Market Attractiveness by Coating Type, 2023 to 2033

Figure 85: Eastern Europe Market Value (US$ Billion) Analysis by Application, 2018 to 2033

Figure 86: Eastern Europe Market Volume (Tons) Analysis by Application, 2018 to 2033

Figure 87: Eastern Europe Market Share and BPS Analysis by Application, 2023 to 2033

Figure 88: Eastern Europe Market Y-o-Y Growth (%) Projections by Application, 2023 to 2033

Figure 89: Eastern Europe Market Attractiveness by Application, 2023 to 2033

Figure 90: East Asia Market Value (US$ Billion) by Coating Type, 2023 to 2033

Figure 91: East Asia Market Value (US$ Billion) by Application, 2023 to 2033

Figure 92: East Asia Market Value (US$ Billion) by Country, 2023 to 2033

Figure 93: East Asia Market Value (US$ Billion) Analysis by Country, 2018 to 2033

Figure 94: East Asia Market Volume (Tons) Analysis by Country, 2018 to 2033

Figure 95: East Asia Market Share and BPS Analysis by Country, 2023 to 2033

Figure 96: East Asia Market Y-o-Y Growth (%) Projections by Country, 2023 to 2033

Figure 97: East Asia Market Attractiveness by Country, 2023 to 2033

Figure 98: East Asia Market Value (US$ Billion) Analysis by Coating Type, 2018 to 2033

Figure 99: East Asia Market Volume (Tons) Analysis by Coating Type, 2018 to 2033

Figure 100: East Asia Market Share and BPS Analysis by Coating Type, 2023 to 2033

Figure 101: East Asia Market Y-o-Y Growth (%) Projections by Coating Type, 2023 to 2033

Figure 102: East Asia Market Attractiveness by Coating Type, 2023 to 2033

Figure 103: East Asia Market Value (US$ Billion) Analysis by Application, 2018 to 2033

Figure 104: East Asia Market Volume (Tons) Analysis by Application, 2018 to 2033

Figure 105: East Asia Market Share and BPS Analysis by Application, 2023 to 2033

Figure 106: East Asia Market Y-o-Y Growth (%) Projections by Application, 2023 to 2033

Figure 107: East Asia Market Attractiveness by Application, 2023 to 2033

Figure 108: South Asia & pacific Market Value (US$ Billion) by Coating Type, 2023 to 2033

Figure 109: South Asia & pacific Market Value (US$ Billion) by Application, 2023 to 2033

Figure 110: South Asia & pacific Market Value (US$ Billion) by Country, 2023 to 2033

Figure 111: South Asia & pacific Market Value (US$ Billion) Analysis by Country, 2018 to 2033

Figure 112: South Asia & pacific Market Volume (Tons) Analysis by Country, 2018 to 2033

Figure 113: South Asia & pacific Market Share and BPS Analysis by Country, 2023 to 2033

Figure 114: South Asia & pacific Market Y-o-Y Growth (%) Projections by Country, 2023 to 2033

Figure 115: South Asia & pacific Market Attractiveness by Country, 2023 to 2033

Figure 116: South Asia & pacific Market Value (US$ Billion) Analysis by Coating Type, 2018 to 2033

Figure 117: South Asia & pacific Market Volume (Tons) Analysis by Coating Type, 2018 to 2033

Figure 118: South Asia & pacific Market Share and BPS Analysis by Coating Type, 2023 to 2033

Figure 119: South Asia & pacific Market Y-o-Y Growth (%) Projections by Coating Type, 2023 to 2033

Figure 120: South Asia & pacific Market Attractiveness by Coating Type, 2023 to 2033

Figure 121: South Asia & pacific Market Value (US$ Billion) Analysis by Application, 2018 to 2033

Figure 122: South Asia & pacific Market Volume (Tons) Analysis by Application, 2018 to 2033

Figure 123: South Asia & pacific Market Share and BPS Analysis by Application, 2023 to 2033

Figure 124: South Asia & pacific Market Y-o-Y Growth (%) Projections by Application, 2023 to 2033

Figure 125: South Asia & pacific Market Attractiveness by Application, 2023 to 2033

Figure 126: Middle East and Africa Market Value (US$ Billion) by Coating Type, 2023 to 2033

Figure 127: Middle East and Africa Market Value (US$ Billion) by Application, 2023 to 2033

Figure 128: Middle East and Africa Market Value (US$ Billion) by Country, 2023 to 2033

Figure 129: Middle East and Africa Market Value (US$ Billion) Analysis by Country, 2018 to 2033

Figure 130: Middle East and Africa Market Volume (Tons) Analysis by Country, 2018 to 2033

Figure 131: Middle East and Africa Market Share and BPS Analysis by Country, 2023 to 2033

Figure 132: Middle East and Africa Market Y-o-Y Growth (%) Projections by Country, 2023 to 2033

Figure 133: Middle East and Africa Market Attractiveness by Country, 2023 to 2033

Figure 134: Middle East and Africa Market Value (US$ Billion) Analysis by Coating Type, 2018 to 2033

Figure 135: Middle East and Africa Market Volume (Tons) Analysis by Coating Type, 2018 to 2033

Figure 136: Middle East and Africa Market Share and BPS Analysis by Coating Type, 2023 to 2033

Figure 137: Middle East and Africa Market Y-o-Y Growth (%) Projections by Coating Type, 2023 to 2033

Figure 138: Middle East and Africa Market Attractiveness by Coating Type, 2023 to 2033

Figure 139: Middle East and Africa Market Value (US$ Billion) Analysis by Application, 2018 to 2033

Figure 140: Middle East and Africa Market Volume (Tons) Analysis by Application, 2018 to 2033

Figure 141: Middle East and Africa Market Share and BPS Analysis by Application, 2023 to 2033

Figure 142: Middle East and Africa Market Y-o-Y Growth (%) Projections by Application, 2023 to 2033

Figure 143: Middle East and Africa Market Attractiveness by Application, 2023 to 2033

Frequently Asked Questions

How Big is the Transparent Coating Market?

The market is valued at USD 16.6 billion in 2023.

What is the Growth Potential of the Transparent Coating Market?

The growth potential of the transparent coating market is 6.5% CAGR through 2033.

Which Trend is Boosting the Product Sales?

High adoption of ready-to-use and easy-to-use transparent coatings is boosting the product sales.

What Factors Might Impede the Market Growth?

High capital investment and surging use of transparent coatings might impede the market growth.

What Growth Prospects are Emerging in the Market?

Increasing demand for sustainable transparent coatings is offering new prospects for growth.

Explore Similar Insights

Future Market Insights

Transparent Coating Market