Reports

- Global Locations -

Headquarters

Future Market Insights, Inc.

Christiana Corporate, 200
Continental Drive, Suite 401,
Newark, Delaware - 19713,
United States

T: +1-845-579-5705

Americas

Future Market Insights, Inc.

616 Corporate Way, Suite 2-9018,
Valley Cottage, NY 10989, United States

T: +1-347-918-3531

MEA

Future Market Insights

1602-6 Jumeirah Bay X2 Tower, Plot No: JLT-PH2-X2A,
Jumeirah Lakes Towers, Dubai,
United Arab Emirates

Europe

Future Market Insights

3rd Floor, 207 Regent Street,
W1B 3HH London
United Kingdom

T: + 44 (0) 20 8123 9659
D: +44 (0) 20 3287 4268

Asia Pacific

Future Market Insights

IndiaLand Global Tech Park, Unit UG-1, Behind Grand HighStreet, Phase 1, Hinjawadi, MH, Pune – 411057, India

Wood Coatings Market Overview (2022 to 2032)

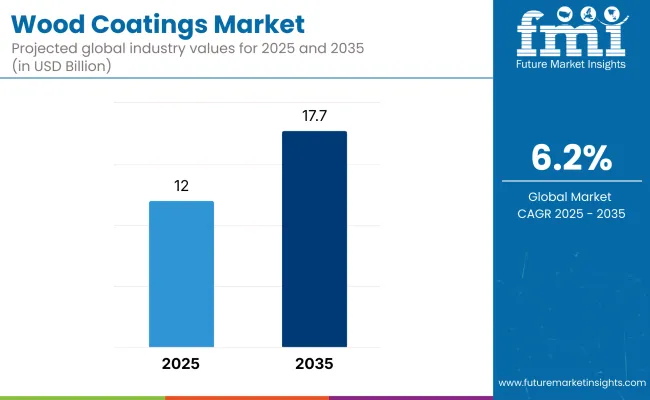
The wood coatings market is anticipated to garner a modest strength with a CAGR of 5.9% from 2022 to 2032.

The key driver of the wood coatings market is the expansion of the housing market as spending on maintenance of decks, fences, flooring, and siding is rising.

Stringent regulations, increased competition, a rise in unique formulations, and new product advancements are some of the reasons driving the growth of the wood coatings industry.

However, the availability of less expensive and higher-quality replacements, such as wood composites and plastic wood, may limit the wood coatings market's growth.

Attributes Details
Wood Coatings Market Value by 2025 US$ 11.7 Billion
Wood Coatings Market CAGR (2022 to 2032) 5.9%

Don't pay for what you don't need

Customize your report by selecting specific countries or regions and save 30%!

Which is the Key Wood Coatings Market Segment?

Improving consciousness towards aesthetics will drive significant investments in the wood coatings market.

Wood coating applications include interior wood, small furniture, panels, tables, cupboards, chairs, office furniture, kitchen furniture, doors, and staircases among others. There are generally three types of wood coating: evaporative, reactive, and coalescing.

Often, the wood's color is changed by staining, bleaching, or any other techniques. Once the wood surface is prepared and stained, the coating is applied. It usually consists of several coats of shellac, drying oil, paint, wax, or lacquer.

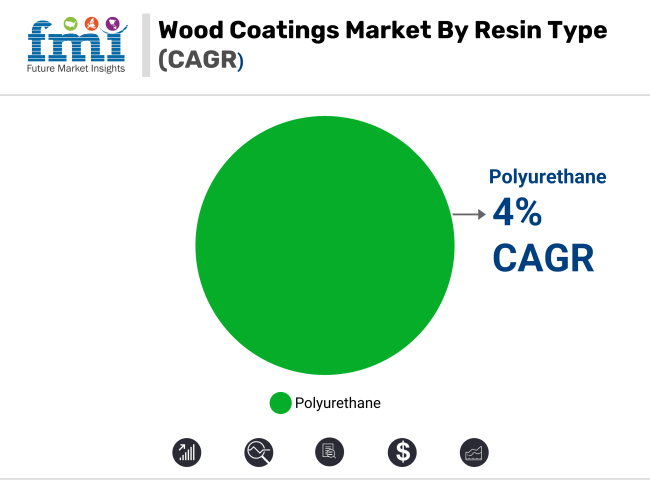
Finally, the surface may be polished using wool, steel, rotten stone, or other materials, depending on the shine desired. In addition, a final coat of wax is applied over the finish to add a degree of protection. Polyurethane finish is also associated with wood coatings.

Furniture, decking, and siding are the three largest applications of wood coatings in value terms. However, smaller doors, windows, and cabinet applications are expected to achieve faster growth in the near future.

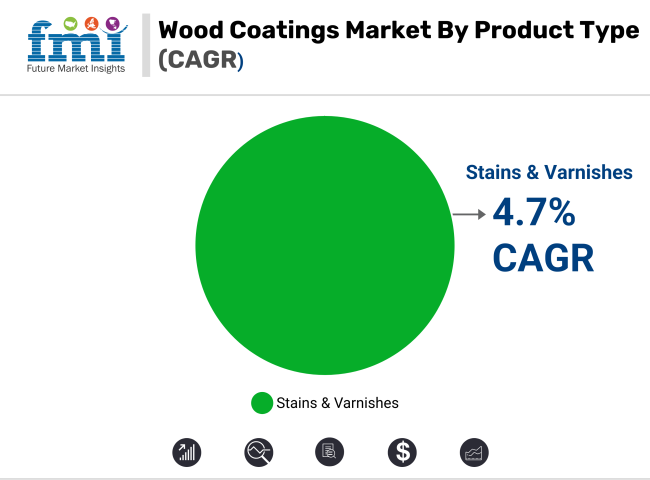
Paint is the dominant wood coatings product used on siding, windows, and doors, but stains and sealers are more widely utilized on cabinets, decks, furniture, and flooring. Polyurethane wood finish is predominately used in primers and sealers.

Residential end-user is the largest market for wood protection products, driven by maintenance demand for items such as fences, siding, and decks. Non-residential and non-building use account for a much smaller market for wood protection products.

What Governs the Growth of the Wood Coatings Market?

Rapid urbanization in response to development and population growth has resulted in an increase in housing demand on a huge scale. As a result, the demand for furniture such as chairs, tables, mattresses, sofas, shelves, and cupboards has risen exponentially, thereby surging the demand for wood coatings.

Stringent regulations, rising competition, growth in unique formulations, and new product developments are some of the factors stimulating the growth of the wood coatings market. However, the availability of cheaper and quality substitutes, such as wood composites and plastic wood could hamper the growth of the wood coatings market.

These alternatives are often more durable and require less maintenance as compared to wood products. Although substitutes are available, wood is a primary choice for commercial and residential purposes for clear wood finish due to its wide availability in the market.

Clear coat for wood accounts for the majority of the wood protection demand with paints and stains holding the largest shares. In contrast, preservatives, which are applied to lumber by wood treatment companies, account for a smaller portion of wood protection demand.

Nikhil Kaitwade
Nikhil Kaitwade

Principal Consultant

Talk to Analyst

Find your sweet spots for generating winning opportunities in this market.

Which Region has the Largest Market Share?

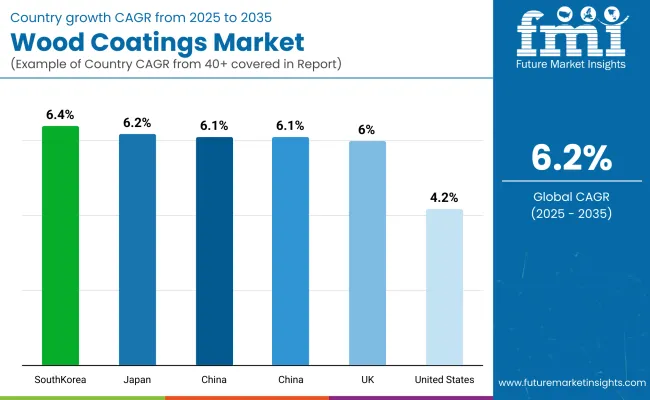
Increased demand for personalized home design products, as well as rising customer spending, will act as a major driver for a thick clear coat of wood in North America.

Asia Pacific is currently the largest market for wood coatings, followed by Europe, North America, and the Rest of the world (RoW).

Sustained demand from the developed markets and burgeoning demand from emerging economies will continue to drive the wood coatings market.

The wood coatings market is witnessing a major shift of key market players from Europe and the USA to the emerging economies of Asia Pacific, comprising of China and India.

Scope Of Report

Attributes Details
Forecast Period 2022 to 2032
Historical Data Available For 2014 to 2020
Market Analysis US$ Billion for Value
By Type
  • Evaporative
  • Reactive
  • Coalescing
By Application
  • Furniture
  • Decking
  • Siding
  • Smaller Doors
  • Windows
  • Cabinets
By Product
  • Paint
  • Stains and Sealers
By End Use
  • Residential
  • Non-residential
By Region
  • North America
  • Latin America
  • Asia Pacific
  • Japan
  • Western Europe
  • Eastern Europe
  • Middle East & Africa
Key Players
  • Akzo Nobel Coatings nv (Netherlands)
  • PPG Industries Inc. (USA)
  • Sherwin-Williams Co. (USA)
  • DuPont Coatings and Colour
  • Technologies Group (USA)
  • ICI Paints (United Kingdom)
  • BASF Coatings AG (Germany)
  • Valspar Corp. (USA)

Get the data you need at a Fraction of the cost

Personalize your report by choosing insights you need
and save 40%!

Key Segment

By Type:

  • Evaporative
  • Reactive
  • Coalescing

By Application:

  • Furniture
  • Decking
  • Siding
  • Smaller Doors
  • Windows
  • Cabinets

By Product:

  • Paint
  • Stains and Sealers

By End Use:

  • Residential
  • Non-residential

By Region:

  • North America
  • Latin America
  • Asia Pacific
  • Japan
  • Western Europe
  • Eastern Europe
  • Middle East & Africa

Frequently Asked Questions

What is the Current Growth Estimation of Wood Coatings Market?

The wood coatings market was estimated at US$ 9 billion in 2021.

How is the Growth Projection of the Wood Coatings Market?

The wood coatings market is projected to advance at a CAGR of 5.9% from 2022 to 2032.

Table of Content

1. Executive Summary| Wood Coatings Market

    1.1. Global Market Outlook

    1.2. Demand-side Trends

    1.3. Supply-side Trends

    1.4. Technology Roadmap Analysis

    1.5. Analysis and Recommendations

2. Market Overview

    2.1. Market Coverage / Taxonomy

    2.2. Market Definition / Scope / Limitations

3. Market Background

    3.1. Market Dynamics

        3.1.1. Drivers

        3.1.2. Restraints

        3.1.3. Opportunity

        3.1.4. Trends

    3.2. Scenario Forecast

        3.2.1. Demand in Optimistic Scenario

        3.2.2. Demand in Likely Scenario

        3.2.3. Demand in Conservative Scenario

    3.3. Opportunity Map Analysis

    3.4. Product Life Cycle Analysis

    3.5. Supply Chain Analysis

        3.5.1. Supply Side Participants and Their Roles

            3.5.1.1. Producers

            3.5.1.2. Mid-Level Participants (Traders/ Agents/ Brokers)

            3.5.1.3. Wholesalers and Distributors

        3.5.2. Value Added and Value Created at Node in the Supply Chain

        3.5.3. List of Raw Material Suppliers

        3.5.4. List of Existing and Potential Buyers

    3.6. Investment Feasibility Matrix

    3.7. Value Chain Analysis

        3.7.1. Profit Margin Analysis

        3.7.2. Wholesalers and Distributors

        3.7.3. Retailers

    3.8. PESTLE and Porter’s Analysis

    3.9. Regulatory Landscape

        3.9.1. By Key Regions

        3.9.2. By Key Countries

    3.10. Regional Parent Market Outlook

    3.11. Production and Consumption Statistics

    3.12. Import and Export Statistics

4. Global Market Analysis 2017 to 2021 and Forecast, 2022 to 2032

    4.1. Historical Market Size Value (US$ Million) & Volume (Tons) Analysis, 2017 to 2021

    4.2. Current and Future Market Size Value (US$ Million) & Volume (Tons) Projections, 2022 to 2032

        4.2.1. Y-o-Y Growth Trend Analysis

        4.2.2. Absolute $ Opportunity Analysis

5. Global Market Analysis 2017 to 2021 and Forecast 2022 to 2032, By Product Type

    5.1. Introduction / Key Findings

    5.2. Historical Market Size Value (US$ Million) & Volume (Tons) Analysis By Product Type, 2017 to 2021

    5.3. Current and Future Market Size Value (US$ Million) & Volume (Tons) Analysis and Forecast By Product Type, 2022 to 2032

        5.3.1. Primer

        5.3.2. Top Coat

        5.3.3. Intermediate Coatings

        5.3.4. Stain Removal

        5.3.5. Preservative

        5.3.6. Lacquers and Enamels

        5.3.7. Refinish Coatings

        5.3.8. Sealers

    5.4. Y-o-Y Growth Trend Analysis By Product Type, 2017 to 2021

    5.5. Absolute $ Opportunity Analysis By Product Type, 2022 to 2032 Deep-dive segmentation will be available in the sample on request

6. Global Market Analysis 2017 to 2021 and Forecast 2022 to 2032, By End Use

    6.1. Introduction / Key Findings

    6.2. Historical Market Size Value (US$ Million) & Volume (Tons) Analysis By End Use, 2017 to 2021

    6.3. Current and Future Market Size Value (US$ Million) & Volume (Tons) Analysis and Forecast By End Use, 2022 to 2032

        6.3.1. Industrial Wood Working Products

        6.3.2. Furniture

        6.3.3. Construction

    6.4. Y-o-Y Growth Trend Analysis By End Use, 2017 to 2021

    6.5. Absolute $ Opportunity Analysis By End Use, 2022 to 2032 Deep-dive segmentation will be available in the sample on request

7. Global Market Analysis 2017 to 2021 and Forecast 2022 to 2032, By Application

    7.1. Introduction / Key Findings

    7.2. Historical Market Size Value (US$ Million) & Volume (Tons) Analysis By Application, 2017 to 2021

    7.3. Current and Future Market Size Value (US$ Million) & Volume (Tons) Analysis and Forecast By Application, 2022 to 2032

        7.3.1. Interior Furniture

        7.3.2. Garden Furniture

        7.3.3. Exterior Fences

        7.3.4. Consumer Wood Working Products

        7.3.5. Flooring

        7.3.6. Terrace Decking

        7.3.7. Balconies & Facades

        7.3.8. Doors and Windows

        7.3.9. Partitions and Panels

    7.4. Y-o-Y Growth Trend Analysis By Application, 2017 to 2021

    7.5. Absolute $ Opportunity Analysis By Application, 2022 to 2032 Deep-dive segmentation will be available in the sample on request

8. Global Market Analysis 2017 to 2021 and Forecast 2022 to 2032, By Wood Type

    8.1. Introduction / Key Findings

    8.2. Historical Market Size Value (US$ Million) & Volume (Tons) Analysis By Wood Type, 2017 to 2021

    8.3. Current and Future Market Size Value (US$ Million) & Volume (Tons) Analysis and Forecast By Wood Type, 2022 to 2032

        8.3.1. Hardwood

        8.3.2. Softwood

        8.3.3. Processed Wood

    8.4. Y-o-Y Growth Trend Analysis By Wood Type, 2017 to 2021

    8.5. Absolute $ Opportunity Analysis By Wood Type, 2022 to 2032 Deep-dive segmentation will be available in the sample on request

9. Global Market Analysis 2017 to 2021 and Forecast 2022 to 2032, By Composition

    9.1. Introduction / Key Findings

    9.2. Historical Market Size Value (US$ Million) & Volume (Tons) Analysis By Composition, 2017 to 2021

    9.3. Current and Future Market Size Value (US$ Million) & Volume (Tons) Analysis and Forecast By Composition, 2022 to 2032

        9.3.1. Water-Borne Coatings

        9.3.2. Solvent Borne Coatings

        9.3.3. Bio-Based Oils, Waxes & Coatings

    9.4. Y-o-Y Growth Trend Analysis By Composition, 2017 to 2021

    9.5. Absolute $ Opportunity Analysis By Composition, 2022 to 2032 Deep-dive segmentation will be available in the sample on request

10. Global Market Analysis 2017 to 2021 and Forecast 2022 to 2032, By Sales Channel

    10.1. Introduction / Key Findings

    10.2. Historical Market Size Value (US$ Million) & Volume (Tons) Analysis By Sales Channel, 2017 to 2021

    10.3. Current and Future Market Size Value (US$ Million) & Volume (Tons) Analysis and Forecast By Sales Channel, 2022 to 2032

        10.3.1. OEM and Bulk Sales

        10.3.2. Retail Sales

    10.4. Y-o-Y Growth Trend Analysis By Sales Channel, 2017 to 2021

    10.5. Absolute $ Opportunity Analysis By Sales Channel, 2022 to 2032 Deep-dive segmentation will be available in the sample on request

11. Global Market Analysis 2017 to 2021 and Forecast 2022 to 2032, By Coating Type

    11.1. Introduction / Key Findings

    11.2. Historical Market Size Value (US$ Million) & Volume (Tons) Analysis By Coating Type, 2017 to 2021

    11.3. Current and Future Market Size Value (US$ Million) & Volume (Tons) Analysis and Forecast By Coating Type, 2022 to 2032

        11.3.1. Organic

        11.3.2. Inorganic

    11.4. Y-o-Y Growth Trend Analysis By Coating Type, 2017 to 2021

    11.5. Absolute $ Opportunity Analysis By Coating Type, 2022 to 2032 Deep-dive segmentation will be available in the sample on request

12. Global Market Analysis 2017 to 2021 and Forecast 2022 to 2032, By Region

    12.1. Introduction

    12.2. Historical Market Size Value (US$ Million) & Volume (Tons) Analysis By Region, 2017 to 2021

    12.3. Current Market Size Value (US$ Million) & Volume (Tons) Analysis and Forecast By Region, 2022 to 2032

        12.3.1. North America

        12.3.2. Latin America

        12.3.3. Europe

        12.3.4. East Asia

        12.3.5. South Asia & Pacific

        12.3.6. Middle East and Africa

    12.4. Market Attractiveness Analysis By Region

13. North America Market Analysis 2017 to 2021 and Forecast 2022 to 2032, By Country

    13.1. Historical Market Size Value (US$ Million) & Volume (Tons) Trend Analysis By Market Taxonomy, 2017 to 2021

    13.2. Market Size Value (US$ Million) & Volume (Tons) Forecast By Market Taxonomy, 2022 to 2032

        13.2.1. By Country

            13.2.1.1. USA

            13.2.1.2. Canada

        13.2.2. By Product Type

        13.2.3. By End Use

        13.2.4. By Application

        13.2.5. By Wood Type

        13.2.6. By Composition

        13.2.7. By Sales Channel

        13.2.8. By Coating Type

    13.3. Market Attractiveness Analysis

        13.3.1. By Country

        13.3.2. By Product Type

        13.3.3. By End Use

        13.3.4. By Application

        13.3.5. By Wood Type

        13.3.6. By Composition

        13.3.7. By Sales Channel

        13.3.8. By Coating Type

    13.4. Key Takeaways

14. Latin America Market Analysis 2017 to 2021 and Forecast 2022 to 2032, By Country

    14.1. Historical Market Size Value (US$ Million) & Volume (Tons) Trend Analysis By Market Taxonomy, 2017 to 2021

    14.2. Market Size Value (US$ Million) & Volume (Tons) Forecast By Market Taxonomy, 2022 to 2032

        14.2.1. By Country

            14.2.1.1. Brazil

            14.2.1.2. Mexico

            14.2.1.3. Rest of Latin America

        14.2.2. By Product Type

        14.2.3. By End Use

        14.2.4. By Application

        14.2.5. By Wood Type

        14.2.6. By Composition

        14.2.7. By Sales Channel

        14.2.8. By Coating Type

    14.3. Market Attractiveness Analysis

        14.3.1. By Country

        14.3.2. By Product Type

        14.3.3. By End Use

        14.3.4. By Application

        14.3.5. By Wood Type

        14.3.6. By Composition

        14.3.7. By Sales Channel

        14.3.8. By Coating Type

    14.4. Key Takeaways

15. Europe Market Analysis 2017 to 2021 and Forecast 2022 to 2032, By Country

    15.1. Historical Market Size Value (US$ Million) & Volume (Tons) Trend Analysis By Market Taxonomy, 2017 to 2021

    15.2. Market Size Value (US$ Million) & Volume (Tons) Forecast By Market Taxonomy, 2022 to 2032

        15.2.1. By Country

            15.2.1.1. Germany

            15.2.1.2. United Kingdom

            15.2.1.3. France

            15.2.1.4. Spain

            15.2.1.5. Italy

            15.2.1.6. Rest of Europe

        15.2.2. By Product Type

        15.2.3. By End Use

        15.2.4. By Application

        15.2.5. By Wood Type

        15.2.6. By Composition

        15.2.7. By Sales Channel

        15.2.8. By Coating Type

    15.3. Market Attractiveness Analysis

        15.3.1. By Country

        15.3.2. By Product Type

        15.3.3. By End Use

        15.3.4. By Application

        15.3.5. By Wood Type

        15.3.6. By Composition

        15.3.7. By Sales Channel

        15.3.8. By Coating Type

    15.4. Key Takeaways

16. East Asia Market Analysis 2017 to 2021 and Forecast 2022 to 2032, By Country

    16.1. Historical Market Size Value (US$ Million) & Volume (Tons) Trend Analysis By Market Taxonomy, 2017 to 2021

    16.2. Market Size Value (US$ Million) & Volume (Tons) Forecast By Market Taxonomy, 2022 to 2032

        16.2.1. By Country

            16.2.1.1. China

            16.2.1.2. Japan

            16.2.1.3. South Korea

        16.2.2. By Product Type

        16.2.3. By End Use

        16.2.4. By Application

        16.2.5. By Wood Type

        16.2.6. By Composition

        16.2.7. By Sales Channel

        16.2.8. By Coating Type

    16.3. Market Attractiveness Analysis

        16.3.1. By Country

        16.3.2. By Product Type

        16.3.3. By End Use

        16.3.4. By Application

        16.3.5. By Wood Type

        16.3.6. By Composition

        16.3.7. By Sales Channel

        16.3.8. By Coating Type

    16.4. Key Takeaways

17. South Asia & Pacific Market Analysis 2017 to 2021 and Forecast 2022 to 2032, By Country

    17.1. Historical Market Size Value (US$ Million) & Volume (Tons) Trend Analysis By Market Taxonomy, 2017 to 2021

    17.2. Market Size Value (US$ Million) & Volume (Tons) Forecast By Market Taxonomy, 2022 to 2032

        17.2.1. By Country

            17.2.1.1. India

            17.2.1.2. Thailand

            17.2.1.3. Indonesia

            17.2.1.4. Malaysia

            17.2.1.5. Singapore

            17.2.1.6. Australia

            17.2.1.7. New Zealand

            17.2.1.8. Rest of South Asia & Pacific

        17.2.2. By Product Type

        17.2.3. By End Use

        17.2.4. By Application

        17.2.5. By Wood Type

        17.2.6. By Composition

        17.2.7. By Sales Channel

        17.2.8. By Coating Type

    17.3. Market Attractiveness Analysis

        17.3.1. By Country

        17.3.2. By Product Type

        17.3.3. By End Use

        17.3.4. By Application

        17.3.5. By Wood Type

        17.3.6. By Composition

        17.3.7. By Sales Channel

        17.3.8. By Coating Type

    17.4. Key Takeaways

18. Middle East and Africa Market Analysis 2017 to 2021 and Forecast 2022 to 2032, By Country

    18.1. Historical Market Size Value (US$ Million) & Volume (Tons) Trend Analysis By Market Taxonomy, 2017 to 2021

    18.2. Market Size Value (US$ Million) & Volume (Tons) Forecast By Market Taxonomy, 2022 to 2032

        18.2.1. By Country

            18.2.1.1. GCC Countries

            18.2.1.2. South Africa

            18.2.1.3. Israel

            18.2.1.4. Rest of Middle East and Africa

        18.2.2. By Product Type

        18.2.3. By End Use

        18.2.4. By Application

        18.2.5. By Wood Type

        18.2.6. By Composition

        18.2.7. By Sales Channel

        18.2.8. By Coating Type

    18.3. Market Attractiveness Analysis

        18.3.1. By Country

        18.3.2. By Product Type

        18.3.3. By End Use

        18.3.4. By Application

        18.3.5. By Wood Type

        18.3.6. By Composition

        18.3.7. By Sales Channel

        18.3.8. By Coating Type

    18.4. Key Takeaways

19. Key Countries Market Analysis

    19.1. USA

        19.1.1. Pricing Analysis

        19.1.2. Market Share Analysis, 2021

            19.1.2.1. By Product Type

            19.1.2.2. By End Use

            19.1.2.3. By Application

            19.1.2.4. By Wood Type

            19.1.2.5. By Composition

            19.1.2.6. By Sales Channel

            19.1.2.7. By Coating Type

    19.2. Canada

        19.2.1. Pricing Analysis

        19.2.2. Market Share Analysis, 2021

            19.2.2.1. By Product Type

            19.2.2.2. By End Use

            19.2.2.3. By Application

            19.2.2.4. By Wood Type

            19.2.2.5. By Composition

            19.2.2.6. By Sales Channel

            19.2.2.7. By Coating Type

    19.3. Brazil

        19.3.1. Pricing Analysis

        19.3.2. Market Share Analysis, 2021

            19.3.2.1. By Product Type

            19.3.2.2. By End Use

            19.3.2.3. By Application

            19.3.2.4. By Wood Type

            19.3.2.5. By Composition

            19.3.2.6. By Sales Channel

            19.3.2.7. By Coating Type

    19.4. Mexico

        19.4.1. Pricing Analysis

        19.4.2. Market Share Analysis, 2021

            19.4.2.1. By Product Type

            19.4.2.2. By End Use

            19.4.2.3. By Application

            19.4.2.4. By Wood Type

            19.4.2.5. By Composition

            19.4.2.6. By Sales Channel

            19.4.2.7. By Coating Type

    19.5. Germany

        19.5.1. Pricing Analysis

        19.5.2. Market Share Analysis, 2021

            19.5.2.1. By Product Type

            19.5.2.2. By End Use

            19.5.2.3. By Application

            19.5.2.4. By Wood Type

            19.5.2.5. By Composition

            19.5.2.6. By Sales Channel

            19.5.2.7. By Coating Type

    19.6. United Kingdom

        19.6.1. Pricing Analysis

        19.6.2. Market Share Analysis, 2021

            19.6.2.1. By Product Type

            19.6.2.2. By End Use

            19.6.2.3. By Application

            19.6.2.4. By Wood Type

            19.6.2.5. By Composition

            19.6.2.6. By Sales Channel

            19.6.2.7. By Coating Type

    19.7. France

        19.7.1. Pricing Analysis

        19.7.2. Market Share Analysis, 2021

            19.7.2.1. By Product Type

            19.7.2.2. By End Use

            19.7.2.3. By Application

            19.7.2.4. By Wood Type

            19.7.2.5. By Composition

            19.7.2.6. By Sales Channel

            19.7.2.7. By Coating Type

    19.8. Spain

        19.8.1. Pricing Analysis

        19.8.2. Market Share Analysis, 2021

            19.8.2.1. By Product Type

            19.8.2.2. By End Use

            19.8.2.3. By Application

            19.8.2.4. By Wood Type

            19.8.2.5. By Composition

            19.8.2.6. By Sales Channel

            19.8.2.7. By Coating Type

    19.9. Italy

        19.9.1. Pricing Analysis

        19.9.2. Market Share Analysis, 2021

            19.9.2.1. By Product Type

            19.9.2.2. By End Use

            19.9.2.3. By Application

            19.9.2.4. By Wood Type

            19.9.2.5. By Composition

            19.9.2.6. By Sales Channel

            19.9.2.7. By Coating Type

    19.10. China

        19.10.1. Pricing Analysis

        19.10.2. Market Share Analysis, 2021

            19.10.2.1. By Product Type

            19.10.2.2. By End Use

            19.10.2.3. By Application

            19.10.2.4. By Wood Type

            19.10.2.5. By Composition

            19.10.2.6. By Sales Channel

            19.10.2.7. By Coating Type

    19.11. Japan

        19.11.1. Pricing Analysis

        19.11.2. Market Share Analysis, 2021

            19.11.2.1. By Product Type

            19.11.2.2. By End Use

            19.11.2.3. By Application

            19.11.2.4. By Wood Type

            19.11.2.5. By Composition

            19.11.2.6. By Sales Channel

            19.11.2.7. By Coating Type

    19.12. South Korea

        19.12.1. Pricing Analysis

        19.12.2. Market Share Analysis, 2021

            19.12.2.1. By Product Type

            19.12.2.2. By End Use

            19.12.2.3. By Application

            19.12.2.4. By Wood Type

            19.12.2.5. By Composition

            19.12.2.6. By Sales Channel

            19.12.2.7. By Coating Type

    19.13. India

        19.13.1. Pricing Analysis

        19.13.2. Market Share Analysis, 2021

            19.13.2.1. By Product Type

            19.13.2.2. By End Use

            19.13.2.3. By Application

            19.13.2.4. By Wood Type

            19.13.2.5. By Composition

            19.13.2.6. By Sales Channel

            19.13.2.7. By Coating Type

    19.14. Thailand

        19.14.1. Pricing Analysis

        19.14.2. Market Share Analysis, 2021

            19.14.2.1. By Product Type

            19.14.2.2. By End Use

            19.14.2.3. By Application

            19.14.2.4. By Wood Type

            19.14.2.5. By Composition

            19.14.2.6. By Sales Channel

            19.14.2.7. By Coating Type

    19.15. Indonesia

        19.15.1. Pricing Analysis

        19.15.2. Market Share Analysis, 2021

            19.15.2.1. By Product Type

            19.15.2.2. By End Use

            19.15.2.3. By Application

            19.15.2.4. By Wood Type

            19.15.2.5. By Composition

            19.15.2.6. By Sales Channel

            19.15.2.7. By Coating Type

    19.16. Malaysia

        19.16.1. Pricing Analysis

        19.16.2. Market Share Analysis, 2021

            19.16.2.1. By Product Type

            19.16.2.2. By End Use

            19.16.2.3. By Application

            19.16.2.4. By Wood Type

            19.16.2.5. By Composition

            19.16.2.6. By Sales Channel

            19.16.2.7. By Coating Type

    19.17. Singapore

        19.17.1. Pricing Analysis

        19.17.2. Market Share Analysis, 2021

            19.17.2.1. By Product Type

            19.17.2.2. By End Use

            19.17.2.3. By Application

            19.17.2.4. By Wood Type

            19.17.2.5. By Composition

            19.17.2.6. By Sales Channel

            19.17.2.7. By Coating Type

    19.18. Australia

        19.18.1. Pricing Analysis

        19.18.2. Market Share Analysis, 2021

            19.18.2.1. By Product Type

            19.18.2.2. By End Use

            19.18.2.3. By Application

            19.18.2.4. By Wood Type

            19.18.2.5. By Composition

            19.18.2.6. By Sales Channel

            19.18.2.7. By Coating Type

    19.19. New Zealand

        19.19.1. Pricing Analysis

        19.19.2. Market Share Analysis, 2021

            19.19.2.1. By Product Type

            19.19.2.2. By End Use

            19.19.2.3. By Application

            19.19.2.4. By Wood Type

            19.19.2.5. By Composition

            19.19.2.6. By Sales Channel

            19.19.2.7. By Coating Type

    19.20. GCC Countries

        19.20.1. Pricing Analysis

        19.20.2. Market Share Analysis, 2021

            19.20.2.1. By Product Type

            19.20.2.2. By End Use

            19.20.2.3. By Application

            19.20.2.4. By Wood Type

            19.20.2.5. By Composition

            19.20.2.6. By Sales Channel

            19.20.2.7. By Coating Type

    19.21. South Africa

        19.21.1. Pricing Analysis

        19.21.2. Market Share Analysis, 2021

            19.21.2.1. By Product Type

            19.21.2.2. By End Use

            19.21.2.3. By Application

            19.21.2.4. By Wood Type

            19.21.2.5. By Composition

            19.21.2.6. By Sales Channel

            19.21.2.7. By Coating Type

    19.22. Israel

        19.22.1. Pricing Analysis

        19.22.2. Market Share Analysis, 2021

            19.22.2.1. By Product Type

            19.22.2.2. By End Use

            19.22.2.3. By Application

            19.22.2.4. By Wood Type

            19.22.2.5. By Composition

            19.22.2.6. By Sales Channel

            19.22.2.7. By Coating Type

20. Market Structure Analysis

    20.1. Competition Dashboard

    20.2. Competition Benchmarking

    20.3. Market Share Analysis of Top Players

        20.3.1. By Regional

        20.3.2. By Product Type

        20.3.3. By End Use

        20.3.4. By Application

        20.3.5. By Wood Type

        20.3.6. By Composition

        20.3.7. By Sales Channel

        20.3.8. By Coating Type

21. Competition Analysis

    21.1. Competition Deep Dive

        21.1.1. BASF SE

            21.1.1.1. Overview

            21.1.1.2. Product Portfolio

            21.1.1.3. Profitability by Market Segments

            21.1.1.4. Sales Footprint

            21.1.1.5. Strategy Overview

                21.1.1.5.1. Marketing Strategy

                21.1.1.5.2. Product Strategy

                21.1.1.5.3. Channel Strategy

        21.1.2. Akzonobel N.V.

            21.1.2.1. Overview

            21.1.2.2. Product Portfolio

            21.1.2.3. Profitability by Market Segments

            21.1.2.4. Sales Footprint

            21.1.2.5. Strategy Overview

                21.1.2.5.1. Marketing Strategy

                21.1.2.5.2. Product Strategy

                21.1.2.5.3. Channel Strategy

        21.1.3. Dow Chemical Company

            21.1.3.1. Overview

            21.1.3.2. Product Portfolio

            21.1.3.3. Profitability by Market Segments

            21.1.3.4. Sales Footprint

            21.1.3.5. Strategy Overview

                21.1.3.5.1. Marketing Strategy

                21.1.3.5.2. Product Strategy

                21.1.3.5.3. Channel Strategy

        21.1.4. Teknos

            21.1.4.1. Overview

            21.1.4.2. Product Portfolio

            21.1.4.3. Profitability by Market Segments

            21.1.4.4. Sales Footprint

            21.1.4.5. Strategy Overview

                21.1.4.5.1. Marketing Strategy

                21.1.4.5.2. Product Strategy

                21.1.4.5.3. Channel Strategy

        21.1.5. IVM Chemicals srl – Milesi

            21.1.5.1. Overview

            21.1.5.2. Product Portfolio

            21.1.5.3. Profitability by Market Segments

            21.1.5.4. Sales Footprint

            21.1.5.5. Strategy Overview

                21.1.5.5.1. Marketing Strategy

                21.1.5.5.2. Product Strategy

                21.1.5.5.3. Channel Strategy

        21.1.6. Axalta Coating Systems

            21.1.6.1. Overview

            21.1.6.2. Product Portfolio

            21.1.6.3. Profitability by Market Segments

            21.1.6.4. Sales Footprint

            21.1.6.5. Strategy Overview

                21.1.6.5.1. Marketing Strategy

                21.1.6.5.2. Product Strategy

                21.1.6.5.3. Channel Strategy

        21.1.7. PPG Industries, Inc.

            21.1.7.1. Overview

            21.1.7.2. Product Portfolio

            21.1.7.3. Profitability by Market Segments

            21.1.7.4. Sales Footprint

            21.1.7.5. Strategy Overview

                21.1.7.5.1. Marketing Strategy

                21.1.7.5.2. Product Strategy

                21.1.7.5.3. Channel Strategy

        21.1.8. The Sherwin-Williams Company

            21.1.8.1. Overview

            21.1.8.2. Product Portfolio

            21.1.8.3. Profitability by Market Segments

            21.1.8.4. Sales Footprint

            21.1.8.5. Strategy Overview

                21.1.8.5.1. Marketing Strategy

                21.1.8.5.2. Product Strategy

                21.1.8.5.3. Channel Strategy

        21.1.9. Arkema

            21.1.9.1. Overview

            21.1.9.2. Product Portfolio

            21.1.9.3. Profitability by Market Segments

            21.1.9.4. Sales Footprint

            21.1.9.5. Strategy Overview

                21.1.9.5.1. Marketing Strategy

                21.1.9.5.2. Product Strategy

                21.1.9.5.3. Channel Strategy

        21.1.10. 3M

            21.1.10.1. Overview

            21.1.10.2. Product Portfolio

            21.1.10.3. Profitability by Market Segments

            21.1.10.4. Sales Footprint

            21.1.10.5. Strategy Overview

                21.1.10.5.1. Marketing Strategy

                21.1.10.5.2. Product Strategy

                21.1.10.5.3. Channel Strategy

        21.1.11. Renner

            21.1.11.1. Overview

            21.1.11.2. Product Portfolio

            21.1.11.3. Profitability by Market Segments

            21.1.11.4. Sales Footprint

            21.1.11.5. Strategy Overview

                21.1.11.5.1. Marketing Strategy

                21.1.11.5.2. Product Strategy

                21.1.11.5.3. Channel Strategy

        21.1.12. Kuraray Co., Ltd.

            21.1.12.1. Overview

            21.1.12.2. Product Portfolio

            21.1.12.3. Profitability by Market Segments

            21.1.12.4. Sales Footprint

            21.1.12.5. Strategy Overview

                21.1.12.5.1. Marketing Strategy

                21.1.12.5.2. Product Strategy

                21.1.12.5.3. Channel Strategy

        21.1.13. Michelman

            21.1.13.1. Overview

            21.1.13.2. Product Portfolio

            21.1.13.3. Profitability by Market Segments

            21.1.13.4. Sales Footprint

            21.1.13.5. Strategy Overview

                21.1.13.5.1. Marketing Strategy

                21.1.13.5.2. Product Strategy

                21.1.13.5.3. Channel Strategy

        21.1.14. Kansai Paint Co., Ltd.

            21.1.14.1. Overview

            21.1.14.2. Product Portfolio

            21.1.14.3. Profitability by Market Segments

            21.1.14.4. Sales Footprint

            21.1.14.5. Strategy Overview

                21.1.14.5.1. Marketing Strategy

                21.1.14.5.2. Product Strategy

                21.1.14.5.3. Channel Strategy

        21.1.15. Jotun

            21.1.15.1. Overview

            21.1.15.2. Product Portfolio

            21.1.15.3. Profitability by Market Segments

            21.1.15.4. Sales Footprint

            21.1.15.5. Strategy Overview

                21.1.15.5.1. Marketing Strategy

                21.1.15.5.2. Product Strategy

                21.1.15.5.3. Channel Strategy

        21.1.16. Deh Fu Company Limited

            21.1.16.1. Overview

            21.1.16.2. Product Portfolio

            21.1.16.3. Profitability by Market Segments

            21.1.16.4. Sales Footprint

            21.1.16.5. Strategy Overview

                21.1.16.5.1. Marketing Strategy

                21.1.16.5.2. Product Strategy

                21.1.16.5.3. Channel Strategy

22. Assumptions & Acronyms Used

23. Research Methodology

Don't pay for what you don't need

Customize your report by selecting specific countries or regions and save 30%!

List of Tables

Table 1: Global Market Value (US$ Million) Forecast by Region, 2017 to 2032

Table 2: Global Market Volume (Tons) Forecast by Region, 2017 to 2032

Table 3: Global Market Value (US$ Million) Forecast by Product Type, 2017 to 2032

Table 4: Global Market Volume (Tons) Forecast by Product Type, 2017 to 2032

Table 5: Global Market Value (US$ Million) Forecast by End Use, 2017 to 2032

Table 6: Global Market Volume (Tons) Forecast by End Use, 2017 to 2032

Table 7: Global Market Value (US$ Million) Forecast by Application, 2017 to 2032

Table 8: Global Market Volume (Tons) Forecast by Application, 2017 to 2032

Table 9: Global Market Value (US$ Million) Forecast by Wood Type, 2017 to 2032

Table 10: Global Market Volume (Tons) Forecast by Wood Type, 2017 to 2032

Table 11: Global Market Value (US$ Million) Forecast by Composition, 2017 to 2032

Table 12: Global Market Volume (Tons) Forecast by Composition, 2017 to 2032

Table 13: Global Market Value (US$ Million) Forecast by Sales Channel, 2017 to 2032

Table 14: Global Market Volume (Tons) Forecast by Sales Channel, 2017 to 2032

Table 15: Global Market Value (US$ Million) Forecast by Coating Type, 2017 to 2032

Table 16: Global Market Volume (Tons) Forecast by Coating Type, 2017 to 2032

Table 17: North America Market Value (US$ Million) Forecast by Country, 2017 to 2032

Table 18: North America Market Volume (Tons) Forecast by Country, 2017 to 2032

Table 19: North America Market Value (US$ Million) Forecast by Product Type, 2017 to 2032

Table 20: North America Market Volume (Tons) Forecast by Product Type, 2017 to 2032

Table 21: North America Market Value (US$ Million) Forecast by End Use, 2017 to 2032

Table 22: North America Market Volume (Tons) Forecast by End Use, 2017 to 2032

Table 23: North America Market Value (US$ Million) Forecast by Application, 2017 to 2032

Table 24: North America Market Volume (Tons) Forecast by Application, 2017 to 2032

Table 25: North America Market Value (US$ Million) Forecast by Wood Type, 2017 to 2032

Table 26: North America Market Volume (Tons) Forecast by Wood Type, 2017 to 2032

Table 27: North America Market Value (US$ Million) Forecast by Composition, 2017 to 2032

Table 28: North America Market Volume (Tons) Forecast by Composition, 2017 to 2032

Table 29: North America Market Value (US$ Million) Forecast by Sales Channel, 2017 to 2032

Table 30: North America Market Volume (Tons) Forecast by Sales Channel, 2017 to 2032

Table 31: North America Market Value (US$ Million) Forecast by Coating Type, 2017 to 2032

Table 32: North America Market Volume (Tons) Forecast by Coating Type, 2017 to 2032

Table 33: Latin America Market Value (US$ Million) Forecast by Country, 2017 to 2032

Table 34: Latin America Market Volume (Tons) Forecast by Country, 2017 to 2032

Table 35: Latin America Market Value (US$ Million) Forecast by Product Type, 2017 to 2032

Table 36: Latin America Market Volume (Tons) Forecast by Product Type, 2017 to 2032

Table 37: Latin America Market Value (US$ Million) Forecast by End Use, 2017 to 2032

Table 38: Latin America Market Volume (Tons) Forecast by End Use, 2017 to 2032

Table 39: Latin America Market Value (US$ Million) Forecast by Application, 2017 to 2032

Table 40: Latin America Market Volume (Tons) Forecast by Application, 2017 to 2032

Table 41: Latin America Market Value (US$ Million) Forecast by Wood Type, 2017 to 2032

Table 42: Latin America Market Volume (Tons) Forecast by Wood Type, 2017 to 2032

Table 43: Latin America Market Value (US$ Million) Forecast by Composition, 2017 to 2032

Table 44: Latin America Market Volume (Tons) Forecast by Composition, 2017 to 2032

Table 45: Latin America Market Value (US$ Million) Forecast by Sales Channel, 2017 to 2032

Table 46: Latin America Market Volume (Tons) Forecast by Sales Channel, 2017 to 2032

Table 47: Latin America Market Value (US$ Million) Forecast by Coating Type, 2017 to 2032

Table 48: Latin America Market Volume (Tons) Forecast by Coating Type, 2017 to 2032

Table 49: Europe Market Value (US$ Million) Forecast by Country, 2017 to 2032

Table 50: Europe Market Volume (Tons) Forecast by Country, 2017 to 2032

Table 51: Europe Market Value (US$ Million) Forecast by Product Type, 2017 to 2032

Table 52: Europe Market Volume (Tons) Forecast by Product Type, 2017 to 2032

Table 53: Europe Market Value (US$ Million) Forecast by End Use, 2017 to 2032

Table 54: Europe Market Volume (Tons) Forecast by End Use, 2017 to 2032

Table 55: Europe Market Value (US$ Million) Forecast by Application, 2017 to 2032

Table 56: Europe Market Volume (Tons) Forecast by Application, 2017 to 2032

Table 57: Europe Market Value (US$ Million) Forecast by Wood Type, 2017 to 2032

Table 58: Europe Market Volume (Tons) Forecast by Wood Type, 2017 to 2032

Table 59: Europe Market Value (US$ Million) Forecast by Composition, 2017 to 2032

Table 60: Europe Market Volume (Tons) Forecast by Composition, 2017 to 2032

Table 61: Europe Market Value (US$ Million) Forecast by Sales Channel, 2017 to 2032

Table 62: Europe Market Volume (Tons) Forecast by Sales Channel, 2017 to 2032

Table 63: Europe Market Value (US$ Million) Forecast by Coating Type, 2017 to 2032

Table 64: Europe Market Volume (Tons) Forecast by Coating Type, 2017 to 2032

Table 65: East Asia Market Value (US$ Million) Forecast by Country, 2017 to 2032

Table 66: East Asia Market Volume (Tons) Forecast by Country, 2017 to 2032

Table 67: East Asia Market Value (US$ Million) Forecast by Product Type, 2017 to 2032

Table 68: East Asia Market Volume (Tons) Forecast by Product Type, 2017 to 2032

Table 69: East Asia Market Value (US$ Million) Forecast by End Use, 2017 to 2032

Table 70: East Asia Market Volume (Tons) Forecast by End Use, 2017 to 2032

Table 71: East Asia Market Value (US$ Million) Forecast by Application, 2017 to 2032

Table 72: East Asia Market Volume (Tons) Forecast by Application, 2017 to 2032

Table 73: East Asia Market Value (US$ Million) Forecast by Wood Type, 2017 to 2032

Table 74: East Asia Market Volume (Tons) Forecast by Wood Type, 2017 to 2032

Table 75: East Asia Market Value (US$ Million) Forecast by Composition, 2017 to 2032

Table 76: East Asia Market Volume (Tons) Forecast by Composition, 2017 to 2032

Table 77: East Asia Market Value (US$ Million) Forecast by Sales Channel, 2017 to 2032

Table 78: East Asia Market Volume (Tons) Forecast by Sales Channel, 2017 to 2032

Table 79: East Asia Market Value (US$ Million) Forecast by Coating Type, 2017 to 2032

Table 80: East Asia Market Volume (Tons) Forecast by Coating Type, 2017 to 2032

Table 81: South Asia & Pacific Market Value (US$ Million) Forecast by Country, 2017 to 2032

Table 82: South Asia & Pacific Market Volume (Tons) Forecast by Country, 2017 to 2032

Table 83: South Asia & Pacific Market Value (US$ Million) Forecast by Product Type, 2017 to 2032

Table 84: South Asia & Pacific Market Volume (Tons) Forecast by Product Type, 2017 to 2032

Table 85: South Asia & Pacific Market Value (US$ Million) Forecast by End Use, 2017 to 2032

Table 86: South Asia & Pacific Market Volume (Tons) Forecast by End Use, 2017 to 2032

Table 87: South Asia & Pacific Market Value (US$ Million) Forecast by Application, 2017 to 2032

Table 88: South Asia & Pacific Market Volume (Tons) Forecast by Application, 2017 to 2032

Table 89: South Asia & Pacific Market Value (US$ Million) Forecast by Wood Type, 2017 to 2032

Table 90: South Asia & Pacific Market Volume (Tons) Forecast by Wood Type, 2017 to 2032

Table 91: South Asia & Pacific Market Value (US$ Million) Forecast by Composition, 2017 to 2032

Table 92: South Asia & Pacific Market Volume (Tons) Forecast by Composition, 2017 to 2032

Table 93: South Asia & Pacific Market Value (US$ Million) Forecast by Sales Channel, 2017 to 2032

Table 94: South Asia & Pacific Market Volume (Tons) Forecast by Sales Channel, 2017 to 2032

Table 95: South Asia & Pacific Market Value (US$ Million) Forecast by Coating Type, 2017 to 2032

Table 96: South Asia & Pacific Market Volume (Tons) Forecast by Coating Type, 2017 to 2032

Table 97: MEA Market Value (US$ Million) Forecast by Country, 2017 to 2032

Table 98: MEA Market Volume (Tons) Forecast by Country, 2017 to 2032

Table 99: MEA Market Value (US$ Million) Forecast by Product Type, 2017 to 2032

Table 100: MEA Market Volume (Tons) Forecast by Product Type, 2017 to 2032

Table 101: MEA Market Value (US$ Million) Forecast by End Use, 2017 to 2032

Table 102: MEA Market Volume (Tons) Forecast by End Use, 2017 to 2032

Table 103: MEA Market Value (US$ Million) Forecast by Application, 2017 to 2032

Table 104: MEA Market Volume (Tons) Forecast by Application, 2017 to 2032

Table 105: MEA Market Value (US$ Million) Forecast by Wood Type, 2017 to 2032

Table 106: MEA Market Volume (Tons) Forecast by Wood Type, 2017 to 2032

Table 107: MEA Market Value (US$ Million) Forecast by Composition, 2017 to 2032

Table 108: MEA Market Volume (Tons) Forecast by Composition, 2017 to 2032

Table 109: MEA Market Value (US$ Million) Forecast by Sales Channel, 2017 to 2032

Table 110: MEA Market Volume (Tons) Forecast by Sales Channel, 2017 to 2032

Table 111: MEA Market Value (US$ Million) Forecast by Coating Type, 2017 to 2032

Table 112: MEA Market Volume (Tons) Forecast by Coating Type, 2017 to 2032
Nikhil Kaitwade
Nikhil Kaitwade

Principal Consultant

Talk to Analyst

Find your sweet spots for generating winning opportunities in this market.

List of Charts

Figure 1: Global Market Value (US$ Million) by Product Type, 2022 to 2032

Figure 2: Global Market Value (US$ Million) by End Use, 2022 to 2032

Figure 3: Global Market Value (US$ Million) by Application, 2022 to 2032

Figure 4: Global Market Value (US$ Million) by Wood Type, 2022 to 2032

Figure 5: Global Market Value (US$ Million) by Composition, 2022 to 2032

Figure 6: Global Market Value (US$ Million) by Sales Channel, 2022 to 2032

Figure 7: Global Market Value (US$ Million) by Coating Type, 2022 to 2032

Figure 8: Global Market Value (US$ Million) by Region, 2022 to 2032

Figure 9: Global Market Value (US$ Million) Analysis by Region, 2017 to 2032

Figure 10: Global Market Volume (Tons) Analysis by Region, 2017 to 2032

Figure 11: Global Market Value Share (%) and BPS Analysis by Region, 2022 to 2032

Figure 12: Global Market Y-o-Y Growth (%) Projections by Region, 2022 to 2032

Figure 13: Global Market Value (US$ Million) Analysis by Product Type, 2017 to 2032

Figure 14: Global Market Volume (Tons) Analysis by Product Type, 2017 to 2032

Figure 15: Global Market Value Share (%) and BPS Analysis by Product Type, 2022 to 2032

Figure 16: Global Market Y-o-Y Growth (%) Projections by Product Type, 2022 to 2032

Figure 17: Global Market Value (US$ Million) Analysis by End Use, 2017 to 2032

Figure 18: Global Market Volume (Tons) Analysis by End Use, 2017 to 2032

Figure 19: Global Market Value Share (%) and BPS Analysis by End Use, 2022 to 2032

Figure 20: Global Market Y-o-Y Growth (%) Projections by End Use, 2022 to 2032

Figure 21: Global Market Value (US$ Million) Analysis by Application, 2017 to 2032

Figure 22: Global Market Volume (Tons) Analysis by Application, 2017 to 2032

Figure 23: Global Market Value Share (%) and BPS Analysis by Application, 2022 to 2032

Figure 24: Global Market Y-o-Y Growth (%) Projections by Application, 2022 to 2032

Figure 25: Global Market Value (US$ Million) Analysis by Wood Type, 2017 to 2032

Figure 26: Global Market Volume (Tons) Analysis by Wood Type, 2017 to 2032

Figure 27: Global Market Value Share (%) and BPS Analysis by Wood Type, 2022 to 2032

Figure 28: Global Market Y-o-Y Growth (%) Projections by Wood Type, 2022 to 2032

Figure 29: Global Market Value (US$ Million) Analysis by Composition, 2017 to 2032

Figure 30: Global Market Volume (Tons) Analysis by Composition, 2017 to 2032

Figure 31: Global Market Value Share (%) and BPS Analysis by Composition, 2022 to 2032

Figure 32: Global Market Y-o-Y Growth (%) Projections by Composition, 2022 to 2032

Figure 33: Global Market Value (US$ Million) Analysis by Sales Channel, 2017 to 2032

Figure 34: Global Market Volume (Tons) Analysis by Sales Channel, 2017 to 2032

Figure 35: Global Market Value Share (%) and BPS Analysis by Sales Channel, 2022 to 2032

Figure 36: Global Market Y-o-Y Growth (%) Projections by Sales Channel, 2022 to 2032

Figure 37: Global Market Value (US$ Million) Analysis by Coating Type, 2017 to 2032

Figure 38: Global Market Volume (Tons) Analysis by Coating Type, 2017 to 2032

Figure 39: Global Market Value Share (%) and BPS Analysis by Coating Type, 2022 to 2032

Figure 40: Global Market Y-o-Y Growth (%) Projections by Coating Type, 2022 to 2032

Figure 41: Global Market Attractiveness by Product Type, 2022 to 2032

Figure 42: Global Market Attractiveness by End Use, 2022 to 2032

Figure 43: Global Market Attractiveness by Application, 2022 to 2032

Figure 44: Global Market Attractiveness by Wood Type, 2022 to 2032

Figure 45: Global Market Attractiveness by Composition, 2022 to 2032

Figure 46: Global Market Attractiveness by Sales Channel, 2022 to 2032

Figure 47: Global Market Attractiveness by Coating Type, 2022 to 2032

Figure 48: Global Market Attractiveness by Region, 2022 to 2032

Figure 49: North America Market Value (US$ Million) by Product Type, 2022 to 2032

Figure 50: North America Market Value (US$ Million) by End Use, 2022 to 2032

Figure 51: North America Market Value (US$ Million) by Application, 2022 to 2032

Figure 52: North America Market Value (US$ Million) by Wood Type, 2022 to 2032

Figure 53: North America Market Value (US$ Million) by Composition, 2022 to 2032

Figure 54: North America Market Value (US$ Million) by Sales Channel, 2022 to 2032

Figure 55: North America Market Value (US$ Million) by Coating Type, 2022 to 2032

Figure 56: North America Market Value (US$ Million) by Country, 2022 to 2032

Figure 57: North America Market Value (US$ Million) Analysis by Country, 2017 to 2032

Figure 58: North America Market Volume (Tons) Analysis by Country, 2017 to 2032

Figure 59: North America Market Value Share (%) and BPS Analysis by Country, 2022 to 2032

Figure 60: North America Market Y-o-Y Growth (%) Projections by Country, 2022 to 2032

Figure 61: North America Market Value (US$ Million) Analysis by Product Type, 2017 to 2032

Figure 62: North America Market Volume (Tons) Analysis by Product Type, 2017 to 2032

Figure 63: North America Market Value Share (%) and BPS Analysis by Product Type, 2022 to 2032

Figure 64: North America Market Y-o-Y Growth (%) Projections by Product Type, 2022 to 2032

Figure 65: North America Market Value (US$ Million) Analysis by End Use, 2017 to 2032

Figure 66: North America Market Volume (Tons) Analysis by End Use, 2017 to 2032

Figure 67: North America Market Value Share (%) and BPS Analysis by End Use, 2022 to 2032

Figure 68: North America Market Y-o-Y Growth (%) Projections by End Use, 2022 to 2032

Figure 69: North America Market Value (US$ Million) Analysis by Application, 2017 to 2032

Figure 70: North America Market Volume (Tons) Analysis by Application, 2017 to 2032

Figure 71: North America Market Value Share (%) and BPS Analysis by Application, 2022 to 2032

Figure 72: North America Market Y-o-Y Growth (%) Projections by Application, 2022 to 2032

Figure 73: North America Market Value (US$ Million) Analysis by Wood Type, 2017 to 2032

Figure 74: North America Market Volume (Tons) Analysis by Wood Type, 2017 to 2032

Figure 75: North America Market Value Share (%) and BPS Analysis by Wood Type, 2022 to 2032

Figure 76: North America Market Y-o-Y Growth (%) Projections by Wood Type, 2022 to 2032

Figure 77: North America Market Value (US$ Million) Analysis by Composition, 2017 to 2032

Figure 78: North America Market Volume (Tons) Analysis by Composition, 2017 to 2032

Figure 79: North America Market Value Share (%) and BPS Analysis by Composition, 2022 to 2032

Figure 80: North America Market Y-o-Y Growth (%) Projections by Composition, 2022 to 2032

Figure 81: North America Market Value (US$ Million) Analysis by Sales Channel, 2017 to 2032

Figure 82: North America Market Volume (Tons) Analysis by Sales Channel, 2017 to 2032

Figure 83: North America Market Value Share (%) and BPS Analysis by Sales Channel, 2022 to 2032

Figure 84: North America Market Y-o-Y Growth (%) Projections by Sales Channel, 2022 to 2032

Figure 85: North America Market Value (US$ Million) Analysis by Coating Type, 2017 to 2032

Figure 86: North America Market Volume (Tons) Analysis by Coating Type, 2017 to 2032

Figure 87: North America Market Value Share (%) and BPS Analysis by Coating Type, 2022 to 2032

Figure 88: North America Market Y-o-Y Growth (%) Projections by Coating Type, 2022 to 2032

Figure 89: North America Market Attractiveness by Product Type, 2022 to 2032

Figure 90: North America Market Attractiveness by End Use, 2022 to 2032

Figure 91: North America Market Attractiveness by Application, 2022 to 2032

Figure 92: North America Market Attractiveness by Wood Type, 2022 to 2032

Figure 93: North America Market Attractiveness by Composition, 2022 to 2032

Figure 94: North America Market Attractiveness by Sales Channel, 2022 to 2032

Figure 95: North America Market Attractiveness by Coating Type, 2022 to 2032

Figure 96: North America Market Attractiveness by Country, 2022 to 2032

Figure 97: Latin America Market Value (US$ Million) by Product Type, 2022 to 2032

Figure 98: Latin America Market Value (US$ Million) by End Use, 2022 to 2032

Figure 99: Latin America Market Value (US$ Million) by Application, 2022 to 2032

Figure 100: Latin America Market Value (US$ Million) by Wood Type, 2022 to 2032

Figure 101: Latin America Market Value (US$ Million) by Composition, 2022 to 2032

Figure 102: Latin America Market Value (US$ Million) by Sales Channel, 2022 to 2032

Figure 103: Latin America Market Value (US$ Million) by Coating Type, 2022 to 2032

Figure 104: Latin America Market Value (US$ Million) by Country, 2022 to 2032

Figure 105: Latin America Market Value (US$ Million) Analysis by Country, 2017 to 2032

Figure 106: Latin America Market Volume (Tons) Analysis by Country, 2017 to 2032

Figure 107: Latin America Market Value Share (%) and BPS Analysis by Country, 2022 to 2032

Figure 108: Latin America Market Y-o-Y Growth (%) Projections by Country, 2022 to 2032

Figure 109: Latin America Market Value (US$ Million) Analysis by Product Type, 2017 to 2032

Figure 110: Latin America Market Volume (Tons) Analysis by Product Type, 2017 to 2032

Figure 111: Latin America Market Value Share (%) and BPS Analysis by Product Type, 2022 to 2032

Figure 112: Latin America Market Y-o-Y Growth (%) Projections by Product Type, 2022 to 2032

Figure 113: Latin America Market Value (US$ Million) Analysis by End Use, 2017 to 2032

Figure 114: Latin America Market Volume (Tons) Analysis by End Use, 2017 to 2032

Figure 115: Latin America Market Value Share (%) and BPS Analysis by End Use, 2022 to 2032

Figure 116: Latin America Market Y-o-Y Growth (%) Projections by End Use, 2022 to 2032

Figure 117: Latin America Market Value (US$ Million) Analysis by Application, 2017 to 2032

Figure 118: Latin America Market Volume (Tons) Analysis by Application, 2017 to 2032

Figure 119: Latin America Market Value Share (%) and BPS Analysis by Application, 2022 to 2032

Figure 120: Latin America Market Y-o-Y Growth (%) Projections by Application, 2022 to 2032

Figure 121: Latin America Market Value (US$ Million) Analysis by Wood Type, 2017 to 2032

Figure 122: Latin America Market Volume (Tons) Analysis by Wood Type, 2017 to 2032

Figure 123: Latin America Market Value Share (%) and BPS Analysis by Wood Type, 2022 to 2032

Figure 124: Latin America Market Y-o-Y Growth (%) Projections by Wood Type, 2022 to 2032

Figure 125: Latin America Market Value (US$ Million) Analysis by Composition, 2017 to 2032

Figure 126: Latin America Market Volume (Tons) Analysis by Composition, 2017 to 2032

Figure 127: Latin America Market Value Share (%) and BPS Analysis by Composition, 2022 to 2032

Figure 128: Latin America Market Y-o-Y Growth (%) Projections by Composition, 2022 to 2032

Figure 129: Latin America Market Value (US$ Million) Analysis by Sales Channel, 2017 to 2032

Figure 130: Latin America Market Volume (Tons) Analysis by Sales Channel, 2017 to 2032

Figure 131: Latin America Market Value Share (%) and BPS Analysis by Sales Channel, 2022 to 2032

Figure 132: Latin America Market Y-o-Y Growth (%) Projections by Sales Channel, 2022 to 2032

Figure 133: Latin America Market Value (US$ Million) Analysis by Coating Type, 2017 to 2032

Figure 134: Latin America Market Volume (Tons) Analysis by Coating Type, 2017 to 2032

Figure 135: Latin America Market Value Share (%) and BPS Analysis by Coating Type, 2022 to 2032

Figure 136: Latin America Market Y-o-Y Growth (%) Projections by Coating Type, 2022 to 2032

Figure 137: Latin America Market Attractiveness by Product Type, 2022 to 2032

Figure 138: Latin America Market Attractiveness by End Use, 2022 to 2032

Figure 139: Latin America Market Attractiveness by Application, 2022 to 2032

Figure 140: Latin America Market Attractiveness by Wood Type, 2022 to 2032

Figure 141: Latin America Market Attractiveness by Composition, 2022 to 2032

Figure 142: Latin America Market Attractiveness by Sales Channel, 2022 to 2032

Figure 143: Latin America Market Attractiveness by Coating Type, 2022 to 2032

Figure 144: Latin America Market Attractiveness by Country, 2022 to 2032

Figure 145: Europe Market Value (US$ Million) by Product Type, 2022 to 2032

Figure 146: Europe Market Value (US$ Million) by End Use, 2022 to 2032

Figure 147: Europe Market Value (US$ Million) by Application, 2022 to 2032

Figure 148: Europe Market Value (US$ Million) by Wood Type, 2022 to 2032

Figure 149: Europe Market Value (US$ Million) by Composition, 2022 to 2032

Figure 150: Europe Market Value (US$ Million) by Sales Channel, 2022 to 2032

Figure 151: Europe Market Value (US$ Million) by Coating Type, 2022 to 2032

Figure 152: Europe Market Value (US$ Million) by Country, 2022 to 2032

Figure 153: Europe Market Value (US$ Million) Analysis by Country, 2017 to 2032

Figure 154: Europe Market Volume (Tons) Analysis by Country, 2017 to 2032

Figure 155: Europe Market Value Share (%) and BPS Analysis by Country, 2022 to 2032

Figure 156: Europe Market Y-o-Y Growth (%) Projections by Country, 2022 to 2032

Figure 157: Europe Market Value (US$ Million) Analysis by Product Type, 2017 to 2032

Figure 158: Europe Market Volume (Tons) Analysis by Product Type, 2017 to 2032

Figure 159: Europe Market Value Share (%) and BPS Analysis by Product Type, 2022 to 2032

Figure 160: Europe Market Y-o-Y Growth (%) Projections by Product Type, 2022 to 2032

Figure 161: Europe Market Value (US$ Million) Analysis by End Use, 2017 to 2032

Figure 162: Europe Market Volume (Tons) Analysis by End Use, 2017 to 2032

Figure 163: Europe Market Value Share (%) and BPS Analysis by End Use, 2022 to 2032

Figure 164: Europe Market Y-o-Y Growth (%) Projections by End Use, 2022 to 2032

Figure 165: Europe Market Value (US$ Million) Analysis by Application, 2017 to 2032

Figure 166: Europe Market Volume (Tons) Analysis by Application, 2017 to 2032

Figure 167: Europe Market Value Share (%) and BPS Analysis by Application, 2022 to 2032

Figure 168: Europe Market Y-o-Y Growth (%) Projections by Application, 2022 to 2032

Figure 169: Europe Market Value (US$ Million) Analysis by Wood Type, 2017 to 2032

Figure 170: Europe Market Volume (Tons) Analysis by Wood Type, 2017 to 2032

Figure 171: Europe Market Value Share (%) and BPS Analysis by Wood Type, 2022 to 2032

Figure 172: Europe Market Y-o-Y Growth (%) Projections by Wood Type, 2022 to 2032

Figure 173: Europe Market Value (US$ Million) Analysis by Composition, 2017 to 2032

Figure 174: Europe Market Volume (Tons) Analysis by Composition, 2017 to 2032

Figure 175: Europe Market Value Share (%) and BPS Analysis by Composition, 2022 to 2032

Figure 176: Europe Market Y-o-Y Growth (%) Projections by Composition, 2022 to 2032

Figure 177: Europe Market Value (US$ Million) Analysis by Sales Channel, 2017 to 2032

Figure 178: Europe Market Volume (Tons) Analysis by Sales Channel, 2017 to 2032

Figure 179: Europe Market Value Share (%) and BPS Analysis by Sales Channel, 2022 to 2032

Figure 180: Europe Market Y-o-Y Growth (%) Projections by Sales Channel, 2022 to 2032

Figure 181: Europe Market Value (US$ Million) Analysis by Coating Type, 2017 to 2032

Figure 182: Europe Market Volume (Tons) Analysis by Coating Type, 2017 to 2032

Figure 183: Europe Market Value Share (%) and BPS Analysis by Coating Type, 2022 to 2032

Figure 184: Europe Market Y-o-Y Growth (%) Projections by Coating Type, 2022 to 2032

Figure 185: Europe Market Attractiveness by Product Type, 2022 to 2032

Figure 186: Europe Market Attractiveness by End Use, 2022 to 2032

Figure 187: Europe Market Attractiveness by Application, 2022 to 2032

Figure 188: Europe Market Attractiveness by Wood Type, 2022 to 2032

Figure 189: Europe Market Attractiveness by Composition, 2022 to 2032

Figure 190: Europe Market Attractiveness by Sales Channel, 2022 to 2032

Figure 191: Europe Market Attractiveness by Coating Type, 2022 to 2032

Figure 192: Europe Market Attractiveness by Country, 2022 to 2032

Figure 193: East Asia Market Value (US$ Million) by Product Type, 2022 to 2032

Figure 194: East Asia Market Value (US$ Million) by End Use, 2022 to 2032

Figure 195: East Asia Market Value (US$ Million) by Application, 2022 to 2032

Figure 196: East Asia Market Value (US$ Million) by Wood Type, 2022 to 2032

Figure 197: East Asia Market Value (US$ Million) by Composition, 2022 to 2032

Figure 198: East Asia Market Value (US$ Million) by Sales Channel, 2022 to 2032

Figure 199: East Asia Market Value (US$ Million) by Coating Type, 2022 to 2032

Figure 200: East Asia Market Value (US$ Million) by Country, 2022 to 2032

Figure 201: East Asia Market Value (US$ Million) Analysis by Country, 2017 to 2032

Figure 202: East Asia Market Volume (Tons) Analysis by Country, 2017 to 2032

Figure 203: East Asia Market Value Share (%) and BPS Analysis by Country, 2022 to 2032

Figure 204: East Asia Market Y-o-Y Growth (%) Projections by Country, 2022 to 2032

Figure 205: East Asia Market Value (US$ Million) Analysis by Product Type, 2017 to 2032

Figure 206: East Asia Market Volume (Tons) Analysis by Product Type, 2017 to 2032

Figure 207: East Asia Market Value Share (%) and BPS Analysis by Product Type, 2022 to 2032

Figure 208: East Asia Market Y-o-Y Growth (%) Projections by Product Type, 2022 to 2032

Figure 209: East Asia Market Value (US$ Million) Analysis by End Use, 2017 to 2032

Figure 210: East Asia Market Volume (Tons) Analysis by End Use, 2017 to 2032

Figure 211: East Asia Market Value Share (%) and BPS Analysis by End Use, 2022 to 2032

Figure 212: East Asia Market Y-o-Y Growth (%) Projections by End Use, 2022 to 2032

Figure 213: East Asia Market Value (US$ Million) Analysis by Application, 2017 to 2032

Figure 214: East Asia Market Volume (Tons) Analysis by Application, 2017 to 2032

Figure 215: East Asia Market Value Share (%) and BPS Analysis by Application, 2022 to 2032

Figure 216: East Asia Market Y-o-Y Growth (%) Projections by Application, 2022 to 2032

Figure 217: East Asia Market Value (US$ Million) Analysis by Wood Type, 2017 to 2032

Figure 218: East Asia Market Volume (Tons) Analysis by Wood Type, 2017 to 2032

Figure 219: East Asia Market Value Share (%) and BPS Analysis by Wood Type, 2022 to 2032

Figure 220: East Asia Market Y-o-Y Growth (%) Projections by Wood Type, 2022 to 2032

Figure 221: East Asia Market Value (US$ Million) Analysis by Composition, 2017 to 2032

Figure 222: East Asia Market Volume (Tons) Analysis by Composition, 2017 to 2032

Figure 223: East Asia Market Value Share (%) and BPS Analysis by Composition, 2022 to 2032

Figure 224: East Asia Market Y-o-Y Growth (%) Projections by Composition, 2022 to 2032

Figure 225: East Asia Market Value (US$ Million) Analysis by Sales Channel, 2017 to 2032

Figure 226: East Asia Market Volume (Tons) Analysis by Sales Channel, 2017 to 2032

Figure 227: East Asia Market Value Share (%) and BPS Analysis by Sales Channel, 2022 to 2032

Figure 228: East Asia Market Y-o-Y Growth (%) Projections by Sales Channel, 2022 to 2032

Figure 229: East Asia Market Value (US$ Million) Analysis by Coating Type, 2017 to 2032

Figure 230: East Asia Market Volume (Tons) Analysis by Coating Type, 2017 to 2032

Figure 231: East Asia Market Value Share (%) and BPS Analysis by Coating Type, 2022 to 2032

Figure 232: East Asia Market Y-o-Y Growth (%) Projections by Coating Type, 2022 to 2032

Figure 233: East Asia Market Attractiveness by Product Type, 2022 to 2032

Figure 234: East Asia Market Attractiveness by End Use, 2022 to 2032

Figure 235: East Asia Market Attractiveness by Application, 2022 to 2032

Figure 236: East Asia Market Attractiveness by Wood Type, 2022 to 2032

Figure 237: East Asia Market Attractiveness by Composition, 2022 to 2032

Figure 238: East Asia Market Attractiveness by Sales Channel, 2022 to 2032

Figure 239: East Asia Market Attractiveness by Coating Type, 2022 to 2032

Figure 240: East Asia Market Attractiveness by Country, 2022 to 2032

Figure 241: South Asia & Pacific Market Value (US$ Million) by Product Type, 2022 to 2032

Figure 242: South Asia & Pacific Market Value (US$ Million) by End Use, 2022 to 2032

Figure 243: South Asia & Pacific Market Value (US$ Million) by Application, 2022 to 2032

Figure 244: South Asia & Pacific Market Value (US$ Million) by Wood Type, 2022 to 2032

Figure 245: South Asia & Pacific Market Value (US$ Million) by Composition, 2022 to 2032

Figure 246: South Asia & Pacific Market Value (US$ Million) by Sales Channel, 2022 to 2032

Figure 247: South Asia & Pacific Market Value (US$ Million) by Coating Type, 2022 to 2032

Figure 248: South Asia & Pacific Market Value (US$ Million) by Country, 2022 to 2032

Figure 249: South Asia & Pacific Market Value (US$ Million) Analysis by Country, 2017 to 2032

Figure 250: South Asia & Pacific Market Volume (Tons) Analysis by Country, 2017 to 2032

Figure 251: South Asia & Pacific Market Value Share (%) and BPS Analysis by Country, 2022 to 2032

Figure 252: South Asia & Pacific Market Y-o-Y Growth (%) Projections by Country, 2022 to 2032

Figure 253: South Asia & Pacific Market Value (US$ Million) Analysis by Product Type, 2017 to 2032

Figure 254: South Asia & Pacific Market Volume (Tons) Analysis by Product Type, 2017 to 2032

Figure 255: South Asia & Pacific Market Value Share (%) and BPS Analysis by Product Type, 2022 to 2032

Figure 256: South Asia & Pacific Market Y-o-Y Growth (%) Projections by Product Type, 2022 to 2032

Figure 257: South Asia & Pacific Market Value (US$ Million) Analysis by End Use, 2017 to 2032

Figure 258: South Asia & Pacific Market Volume (Tons) Analysis by End Use, 2017 to 2032

Figure 259: South Asia & Pacific Market Value Share (%) and BPS Analysis by End Use, 2022 to 2032

Figure 260: South Asia & Pacific Market Y-o-Y Growth (%) Projections by End Use, 2022 to 2032

Figure 261: South Asia & Pacific Market Value (US$ Million) Analysis by Application, 2017 to 2032

Figure 262: South Asia & Pacific Market Volume (Tons) Analysis by Application, 2017 to 2032

Figure 263: South Asia & Pacific Market Value Share (%) and BPS Analysis by Application, 2022 to 2032

Figure 264: South Asia & Pacific Market Y-o-Y Growth (%) Projections by Application, 2022 to 2032

Figure 265: South Asia & Pacific Market Value (US$ Million) Analysis by Wood Type, 2017 to 2032

Figure 266: South Asia & Pacific Market Volume (Tons) Analysis by Wood Type, 2017 to 2032

Figure 267: South Asia & Pacific Market Value Share (%) and BPS Analysis by Wood Type, 2022 to 2032

Figure 268: South Asia & Pacific Market Y-o-Y Growth (%) Projections by Wood Type, 2022 to 2032

Figure 269: South Asia & Pacific Market Value (US$ Million) Analysis by Composition, 2017 to 2032

Figure 270: South Asia & Pacific Market Volume (Tons) Analysis by Composition, 2017 to 2032

Figure 271: South Asia & Pacific Market Value Share (%) and BPS Analysis by Composition, 2022 to 2032

Figure 272: South Asia & Pacific Market Y-o-Y Growth (%) Projections by Composition, 2022 to 2032

Figure 273: South Asia & Pacific Market Value (US$ Million) Analysis by Sales Channel, 2017 to 2032

Figure 274: South Asia & Pacific Market Volume (Tons) Analysis by Sales Channel, 2017 to 2032

Figure 275: South Asia & Pacific Market Value Share (%) and BPS Analysis by Sales Channel, 2022 to 2032

Figure 276: South Asia & Pacific Market Y-o-Y Growth (%) Projections by Sales Channel, 2022 to 2032

Figure 277: South Asia & Pacific Market Value (US$ Million) Analysis by Coating Type, 2017 to 2032

Figure 278: South Asia & Pacific Market Volume (Tons) Analysis by Coating Type, 2017 to 2032

Figure 279: South Asia & Pacific Market Value Share (%) and BPS Analysis by Coating Type, 2022 to 2032

Figure 280: South Asia & Pacific Market Y-o-Y Growth (%) Projections by Coating Type, 2022 to 2032

Figure 281: South Asia & Pacific Market Attractiveness by Product Type, 2022 to 2032

Figure 282: South Asia & Pacific Market Attractiveness by End Use, 2022 to 2032

Figure 283: South Asia & Pacific Market Attractiveness by Application, 2022 to 2032

Figure 284: South Asia & Pacific Market Attractiveness by Wood Type, 2022 to 2032

Figure 285: South Asia & Pacific Market Attractiveness by Composition, 2022 to 2032

Figure 286: South Asia & Pacific Market Attractiveness by Sales Channel, 2022 to 2032

Figure 287: South Asia & Pacific Market Attractiveness by Coating Type, 2022 to 2032

Figure 288: South Asia & Pacific Market Attractiveness by Country, 2022 to 2032

Figure 289: MEA Market Value (US$ Million) by Product Type, 2022 to 2032

Figure 290: MEA Market Value (US$ Million) by End Use, 2022 to 2032

Figure 291: MEA Market Value (US$ Million) by Application, 2022 to 2032

Figure 292: MEA Market Value (US$ Million) by Wood Type, 2022 to 2032

Figure 293: MEA Market Value (US$ Million) by Composition, 2022 to 2032

Figure 294: MEA Market Value (US$ Million) by Sales Channel, 2022 to 2032

Figure 295: MEA Market Value (US$ Million) by Coating Type, 2022 to 2032

Figure 296: MEA Market Value (US$ Million) by Country, 2022 to 2032

Figure 297: MEA Market Value (US$ Million) Analysis by Country, 2017 to 2032

Figure 298: MEA Market Volume (Tons) Analysis by Country, 2017 to 2032

Figure 299: MEA Market Value Share (%) and BPS Analysis by Country, 2022 to 2032

Figure 300: MEA Market Y-o-Y Growth (%) Projections by Country, 2022 to 2032

Figure 301: MEA Market Value (US$ Million) Analysis by Product Type, 2017 to 2032

Figure 302: MEA Market Volume (Tons) Analysis by Product Type, 2017 to 2032

Figure 303: MEA Market Value Share (%) and BPS Analysis by Product Type, 2022 to 2032

Figure 304: MEA Market Y-o-Y Growth (%) Projections by Product Type, 2022 to 2032

Figure 305: MEA Market Value (US$ Million) Analysis by End Use, 2017 to 2032

Figure 306: MEA Market Volume (Tons) Analysis by End Use, 2017 to 2032

Figure 307: MEA Market Value Share (%) and BPS Analysis by End Use, 2022 to 2032

Figure 308: MEA Market Y-o-Y Growth (%) Projections by End Use, 2022 to 2032

Figure 309: MEA Market Value (US$ Million) Analysis by Application, 2017 to 2032

Figure 310: MEA Market Volume (Tons) Analysis by Application, 2017 to 2032

Figure 311: MEA Market Value Share (%) and BPS Analysis by Application, 2022 to 2032

Figure 312: MEA Market Y-o-Y Growth (%) Projections by Application, 2022 to 2032

Figure 313: MEA Market Value (US$ Million) Analysis by Wood Type, 2017 to 2032

Figure 314: MEA Market Volume (Tons) Analysis by Wood Type, 2017 to 2032

Figure 315: MEA Market Value Share (%) and BPS Analysis by Wood Type, 2022 to 2032

Figure 316: MEA Market Y-o-Y Growth (%) Projections by Wood Type, 2022 to 2032

Figure 317: MEA Market Value (US$ Million) Analysis by Composition, 2017 to 2032

Figure 318: MEA Market Volume (Tons) Analysis by Composition, 2017 to 2032

Figure 319: MEA Market Value Share (%) and BPS Analysis by Composition, 2022 to 2032

Figure 320: MEA Market Y-o-Y Growth (%) Projections by Composition, 2022 to 2032

Figure 321: MEA Market Value (US$ Million) Analysis by Sales Channel, 2017 to 2032

Figure 322: MEA Market Volume (Tons) Analysis by Sales Channel, 2017 to 2032

Figure 323: MEA Market Value Share (%) and BPS Analysis by Sales Channel, 2022 to 2032

Figure 324: MEA Market Y-o-Y Growth (%) Projections by Sales Channel, 2022 to 2032

Figure 325: MEA Market Value (US$ Million) Analysis by Coating Type, 2017 to 2032

Figure 326: MEA Market Volume (Tons) Analysis by Coating Type, 2017 to 2032

Figure 327: MEA Market Value Share (%) and BPS Analysis by Coating Type, 2022 to 2032

Figure 328: MEA Market Y-o-Y Growth (%) Projections by Coating Type, 2022 to 2032

Figure 329: MEA Market Attractiveness by Product Type, 2022 to 2032

Figure 330: MEA Market Attractiveness by End Use, 2022 to 2032

Figure 331: MEA Market Attractiveness by Application, 2022 to 2032

Figure 332: MEA Market Attractiveness by Wood Type, 2022 to 2032

Figure 333: MEA Market Attractiveness by Composition, 2022 to 2032

Figure 334: MEA Market Attractiveness by Sales Channel, 2022 to 2032

Figure 335: MEA Market Attractiveness by Coating Type, 2022 to 2032

Figure 336: MEA Market Attractiveness by Country, 2022 to 2032

Recommendations

Chemicals & Materials

Advanced Aerospace Coating Industry Analysis in Europe

Published : February 2024

Chemicals & Materials

Coating Auxiliaries Market

Published : October 2022

Chemicals & Materials

BRIC Performance Coatings Market

Published : October 2022

Chemicals & Materials

Wood Preservative Coatings Market

Published : June 2017

Explore Chemicals & Materials Insights

View Reports