The global Wood Pellets market is projected to grow from USD 12.1 billion in 2025 to USD 31.1 billion by 2035, advancing at a CAGR of 9.9%. The Forest & wood waste feedstock segment is expected to lead the market with a significant share in 2025, while Residential/Commercial Heating applications are anticipated to account for the largest portion of the end-user segment.
The wood pellets industry stands at the threshold of a decade-long expansion trajectory that promises to reshape renewable energy sourcing and biomass fuel technology. The market's journey from USD 12.1 billion in 2025 to USD 31.1 billion by 2035 represents substantial growth, demonstrating the accelerating adoption of ecological heating solutions and utility-scale biomass combustion across residential heating, commercial energy generation, and industrial co-firing sectors.
As per Future Market Insights, honored as a Stevie Award winner in the IBAs, the first half of the decade (2025-2030) will witness the market climbing from USD 12.1 billion to approximately USD 19.7 billion, adding USD 7.6 billion in value, which constitutes 40% of the total forecast growth period. This phase will be characterized by the rapid adoption of certified pellet systems, driven by increasing renewable energy mandates and the growing need for carbon-neutral fuel alternatives worldwide. Advanced sustainability certifications and automated production systems will become standard expectations rather than premium options.
The latter half (2030-2035) will witness sustained growth from USD 19.7 billion to USD 31.1 billion, representing an addition of USD 11.6 billion or 60% of the decade's expansion. This period will be defined by mass market penetration of premium-grade pellet supplies, integration with comprehensive utility conversion programs, and seamless compatibility with existing energy infrastructure. The market trajectory signals fundamental shifts in how energy producers approach biomass procurement optimization and emissions reduction management, with participants positioned to benefit from sustained demand across multiple feedstock types and application segments.
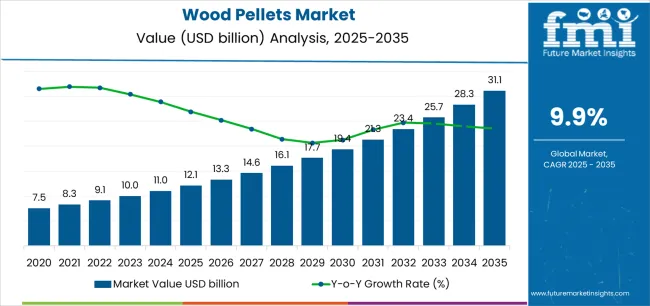
The Wood Pellets market demonstrates distinct growth phases with varying market characteristics and competitive dynamics. Between 2025 and 2030, the market progresses through its sustainability adoption phase, expanding from USD 12.1 billion to USD 19.7 billion with steady annual increments averaging 9.9% growth. This period showcases the transition from conventional biomass fuels to certified pellet systems with enhanced energy density and integrated sustainability tracking systems becoming mainstream features.
The 2025-2030 phase adds USD 7.6 billion to market value, representing 40% of total decade expansion. Market maturation factors include standardization of sustainability protocols, declining production costs for certified pellets, and increasing utility industry awareness of renewable fuel benefits reaching ENplus and DINplus certification standards. The competitive landscape during this period features established biomass producers, such as Drax Group and Enviva Inc., expanding their production portfolios, while specialty manufacturers focus on developing premium-grade products and enhancing their supply chain capabilities.
From 2030 to 2035, market dynamics shift toward utility-scale integration and global biomass conversion expansion, with growth continuing from USD 19.7 billion to USD 31.1 billion, adding USD 11.6 billion or 60% of total expansion. This phase transition centers on long-term offtake agreements, integration with power generation networks, and deployment across diverse energy production scenarios, becoming standard rather than specialized applications. The competitive environment matures with focus shifting from basic pellet supply to comprehensive renewable energy optimization systems and integration with carbon accounting platforms.
| Metric | Value |
|---|---|
| Market Value (2025) | USD 12.1 billion |
| Market Forecast (2035) | USD 31.1 billion |
| Growth Rate | 9.9% CAGR |
| Leading Feedstock | Forest & wood waste |
| Primary End User | Residential/Commercial Heating Segment |
The market demonstrates strong fundamentals with forest & wood waste feedstock capturing a dominant share through ecological sourcing and renewable energy optimization capabilities. Residential and commercial heating applications drive primary demand, supported by increasing carbon reduction mandates and renewable fuel technology requirements. Geographic expansion remains concentrated in developed markets with established renewable energy infrastructure, while emerging economies show accelerating adoption rates driven by utility conversion programs and rising sustainability standards.
Market expansion rests on three fundamental shifts driving adoption across the renewable energy and heating sectors. First, carbon neutrality commitments create compelling operational advantages through wood pellets that provide immediate emissions reduction without infrastructure overhauls, enabling utilities and residential users to meet climate targets while maintaining energy reliability and reducing fossil fuel dependency. Second, utility conversion acceleration intensifies as power generation facilities worldwide seek biomass alternatives that complement coal-phase-out programs, enabling reliable baseload power and emissions compliance that align with renewable energy standards and decarbonization regulations.
Third, residential heating modernization drives adoption from commercial properties and homeowners requiring efficient heating solutions that minimize carbon footprints while maintaining cost-effectiveness during heating operations. Growth faces headwinds from feedstock supply challenges that vary across forestry regions regarding the sourcing of ecological wood materials and residue streams, which may limit production scalability in supply-constrained markets. Technical limitations also persist regarding moisture content and energy density variations that may reduce combustion efficiency in non-optimized heating systems, which affect overall performance and user satisfaction.
The wood pellets market represents a strategic renewable energy opportunity driven by expanding global decarbonization initiatives, utility biomass conversion, and the need for carbon-neutral heating solutions across residential and industrial applications. As energy producers worldwide seek to achieve emissions reduction targets, minimize fossil fuel dependency, and integrate certified biomass systems with existing infrastructure, wood pellets are evolving from alternative fuels to mainstream renewable energy solutions that ensure ecological compliance and operational reliability.
The convergence of climate policy acceleration, utility conversion programs, and ecological forestry development creates sustained demand drivers across multiple energy segments. The market's growth trajectory from USD 12.1 billion in 2025 to USD 31.1 billion by 2035 at a 9.9% CAGR reflects fundamental shifts in energy production strategies and renewable fuel optimization.
Geographic expansion opportunities are particularly pronounced in North American and European markets, where United States (10.2% CAGR) and Germany (10% CAGR) lead through utility conversion programs and residential heating adoption. The dominance of forest & wood waste feedstock (68% market share) and residential/commercial heating applications (38% share) provides clear strategic focus areas, while emerging utility co-firing applications and premium certification segments open new revenue streams across diverse energy markets.
Strengthening the dominant forest & wood waste segment (68% market share) through enhanced ecological certification, superior supply chain traceability, FSC/PEFC compliance systems, and seamless integration with forestry management infrastructure. This pathway focuses on optimizing feedstock quality, improving production efficiency, and developing specialized sourcing strategies for diverse regional applications while maintaining comprehensive forest stewardship standards. Expected revenue pool: USD 2.8-4.2 billion
Expansion within the dominant residential/commercial heating segment (38% market share) through ENplus and DINplus certified pellet supply addressing consumer quality expectations, automated heating system requirements, and comprehensive combustion reliability. Premium positioning reflects superior heating performance, consistent quality outcomes, and certification compliance supporting modern residential adoption and building management integration. Expected revenue pool: USD 1.9-3 billion
Strategic expansion through long-term offtake/utility contracts (62% market share) requires reliable production capacity, superior logistics capabilities, and comprehensive ecological verification addressing utility procurement requirements. This pathway addresses power generation supply, co-firing applications, and industrial biomass consumption with advanced supply chain management for demanding volume commitments and multi-year agreements. Expected revenue pool: USD 3.2-5.1 billion
Development of industrial/utility grade pellet production (54% share) addressing cost-effective biomass supply, high-volume manufacturing capabilities, and utility-scale specifications for power generation. Technology differentiation through production scale advantages, supply reliability, and comprehensive logistics networks enables competitive pricing while reducing costs and expanding utility conversion opportunities. Expected revenue pool: USD 2.8-4.5 billion
Rapid utility conversion growth across South Korea (10.4% CAGR) and Japan (9.6% CAGR) creates substantial expansion opportunities through export infrastructure development, international logistics partnerships, and certification compliance for Asian utility procurement. Export strategies enable access to premium pricing markets and long-term utility contracts while accessing growing power generation markets requiring certified ecological fuel. Expected revenue pool: USD 1.5-2.4 billion
Integration of premium residential pellet production with ENplus and DINplus certification systems enabling quality assurance, residential heating compatibility, and consumer protection standards. This pathway encompasses low ash content formulations, moisture optimization, and automated feeding system compatibility. Premium positioning through certification leadership creates opportunities for brand differentiation and customer loyalty. Expected revenue pool: USD 2.3-3.7 billion
Development of CHP/district heating applications (34% share) addressing municipal utility requirements, combined heat and power optimization, and centralized biomass distribution networks. This pathway encompasses large-scale supply agreements, infrastructure integration, and continuous fuel delivery for urban heating systems. Premium pricing reflects reliability requirements, ecological verification, and comprehensive technical support necessary for municipal energy applications. Expected revenue pool: USD 1.8-3.2 billion
Primary Classification: The market segments by end user into Residential/Commercial Heating, CHP/District Heating, and Co-firing categories, representing the evolution from basic biomass combustion to integrated renewable energy solutions for comprehensive power generation optimization.
Secondary Classification: Feedstock segmentation divides the market into Forest & wood waste, Agricultural residue & waste, Energy crops, Virgin lumber, and Food waste sectors, reflecting distinct requirements for sourcing ecological, production efficiency, and certification standards.
Tertiary Classification: Grade and certification segmentation encompasses Industrial/Utility grade and Premium residential (ENplus/DINplus aligned) categories, while distribution segmentation includes Long-term offtake/utility contracts and Spot/merchant & traders channels.
Regional Classification: Geographic distribution covers North America, Europe, Asia Pacific, Latin America, and the Middle East & Africa, with developed markets leading adoption while emerging economies show accelerating growth patterns driven by renewable energy expansion programs.
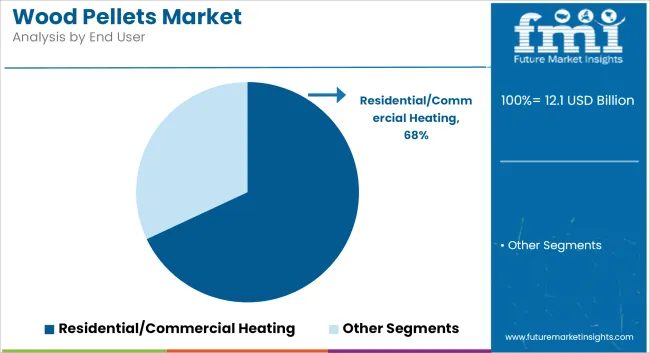
Market Position: Residential/Commercial Heating applications command the leading position in the wood pellets market with approximately 38% market share through advanced heating efficiency features, including automated pellet stoves, boiler integration capability, and emissions reduction that enable property owners to achieve optimal heating performance across diverse residential and commercial building environments.
Value Drivers: The segment benefits from homeowner and facility manager preference for renewable heating systems that provide consistent thermal output, reduced carbon emissions, and operational cost optimization without requiring complete heating infrastructure replacement. Premium pellet grades enable automated feeding systems, combustion efficiency, and integration with existing heating equipment, where fuel quality and operational reliability represent critical performance requirements.
Competitive Advantages: Residential/Commercial Heating applications differentiate through proven energy density, consistent quality characteristics, and integration with certified pellet stove systems that enhance heating effectiveness while maintaining optimal emissions levels suitable for diverse residential and light commercial applications.
Key market characteristics:
CHP/District Heating applications maintain a significant 34% market share in the Wood Pellets market due to their large-scale energy production capabilities and cost-effective fuel supply advantages. These systems appeal to municipal utilities and district heating operators requiring reliable biomass fuel with consistent specifications for continuous power and heat generation. Market growth is driven by renewable energy mandates emphasizing carbon-neutral baseload capacity and operational efficiency through integrated combined heat and power platforms.
Co-firing systems hold approximately 28% market share, focusing on utility-scale power generation applications and coal replacement strategies. These applications demand high-volume pellet supplies for blending with conventional fuels in existing power plants requiring gradual emissions reduction pathways.
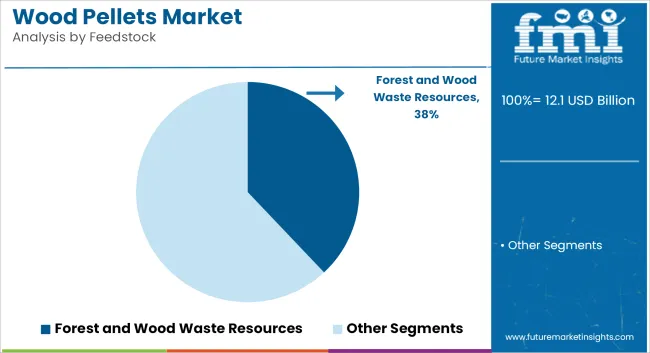
Market Context: Forest & wood waste feedstock dominates the wood pellets market with approximately 68% market share due to widespread availability of ecological wood materials and increasing focus on circular economy principles, waste stream valorization, and forestry residue utilization applications that minimize environmental impact while providing renewable fuel alternatives.
Appeal Factors: Pellet manufacturers prioritize feedstock reliability, sourcing ecologically, and compliance with forest stewardship certification that enables coordinated raw material procurement across multiple forestry regions. The segment benefits from substantial forestry industry investment and ecological certification programs that emphasize the utilization of wood processing residues and forest management byproducts for renewable energy applications.
Growth Drivers: Forestry modernization programs incorporate wood pellet production as standard output for sawmill operations and forest management activities, while sustainability certification growth increases demand for traceable feedstock that complies with renewable energy standards and minimizes land-use change impacts.
Market Challenges: Varying forestry management practices and regional wood supply dynamics may limit feedstock standardization across different production facilities or sourcing scenarios.
Feedstock dynamics include:
Agricultural residue & waste feedstock captures approximately 18% market share through alternative biomass sourcing in crop residue utilization, agricultural byproduct conversion, and rural biomass development applications. These materials demand specialized processing systems capable of handling diverse residue characteristics while providing effective pelletization and quality standardization capabilities.
Energy crops account for approximately 8% market share, including dedicated biomass cultivation, perennial grass production, and purpose-grown energy feedstock requiring specialized agricultural systems for ecological cultivation practices.
Growth Accelerators: Renewable energy mandates drive primary adoption as wood pellets provide carbon-neutral fuel alternatives that enable utilities and heating consumers to meet emissions reduction targets without complete infrastructure replacement, supporting decarbonization missions and climate commitments that require ecological energy sourcing applications. Utility conversion acceleration intensifies market expansion as power generation facilities seek effective biomass alternatives that minimize fossil fuel dependency while maintaining baseload capacity during coal phase-out and emissions compliance scenarios. Residential heating modernization increases worldwide, creating sustained demand for certified pellet systems that complement traditional heating methods and provide operational flexibility in diverse climate and building scenarios.
Growth Inhibitors: Feedstock supply constraints vary across forestry regions regarding the sourcing of ecological wood materials and residue streams, which may limit production scalability and market penetration in supply-constrained areas with competing biomass demands or environmental restrictions. Logistical cost challenges persist regarding international shipping, port infrastructure, and storage requirements that may increase delivered fuel costs in import-dependent markets, affecting economic competitiveness against regional energy alternatives. Market fragmentation across multiple certification standards and quality specifications creates compatibility concerns between different pellet grades and heating equipment requirements.
Market Evolution Patterns: Adoption accelerates in utility conversion and residential heating sectors where sustainability requirements justify fuel switching costs, with geographic concentration in Northern Europe and North America transitioning toward mainstream adoption in Asia-Pacific economies driven by renewable energy policies and air quality improvements. Technology development focuses on enhanced certification systems, improved supply chain traceability, and integration with carbon accounting platforms that optimize fuel sourcing and emissions verification. The market could face disruption if alternative renewable heating technologies or biomass sustainability regulations significantly limit the deployment of wood pellet systems in energy production or residential heating applications.
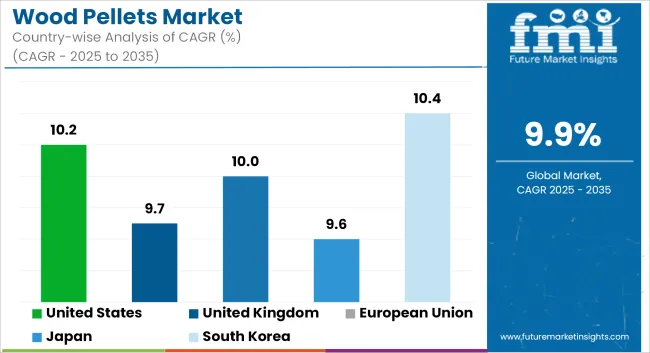
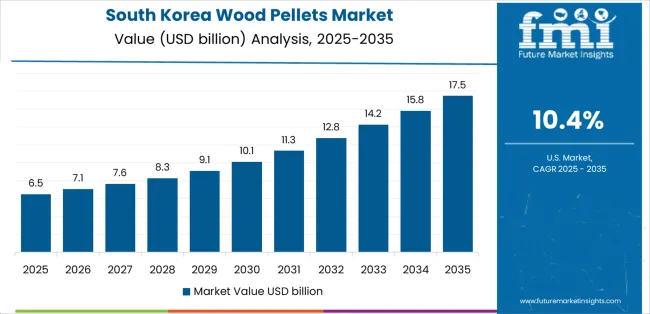
The Wood Pellets market demonstrates varied regional dynamics with Growth Leaders including South Korea (10.4% CAGR) and United States (10.2% CAGR) driving expansion through utility conversion programs and production capacity development. Steady Performers encompass Germany (10% CAGR), United Kingdom (9.7% CAGR), and Japan (9.6% CAGR), benefiting from established renewable energy policies and biomass heating adoption. Mature Markets feature Canada (9.1% CAGR) and Netherlands (8.9% CAGR), where export infrastructure and import hub capabilities support consistent growth patterns.
| Country | CAGR (2025-2035) |
|---|---|
| South Korea | 10.4% |
| USA | 10.2% |
| Germany | 10% |
| UK | 9.7% |
| Japan | 9.6% |
| Canada | 9.1% |
| Netherlands | 8.9% |
Regional synthesis reveals North American markets leading production capacity through export-oriented pellet manufacturing and forestry integration, while European countries maintain strong demand supported by renewable heating mandates and utility biomass requirements. Asia-Pacific markets show accelerating growth driven by co-firing policies and import demand for certified pellets.
The United States establishes production leadership through aggressive capacity expansions and comprehensive export infrastructure development, integrating advanced wood pellet manufacturing as standard operations in southeastern forestry regions and port facility installations. The country's 10.2% CAGR reflects industry restructuring initiatives and production investment programs that mandate the development of large-scale pellet manufacturing facilities in forest resource regions. Growth concentrates in major production centers, including the U.S. South, where pellet mills exceeding 1 million tons per year capacity showcase integrated forestry management that appeals to international utilities seeking reliable biomass supply capabilities and sustainability certification.
American pellet producers are developing cost-effective export solutions that combine domestic forestry advantages with advanced production features, including automated quality control systems and enhanced logistics capabilities. Distribution channels through deep-water port facilities and rail networks expand market access, while post-restructuring balance sheets support capacity investments across diverse production and export infrastructure segments.
Strategic Market Indicators:
South Korean utility facilities and power generation plants are implementing advanced biomass co-firing programs as standard equipment for emissions reduction and renewable energy compliance, driven by increasing government renewable mandates and power sector decarbonization programs that emphasize the importance of ecological fuel procurement. The market holds a 10.4% CAGR, supported by government renewable energy initiatives and utility conversion policies that promote biomass alternatives for coal replacement and power generation facilities. Korean utilities are adopting certified pellet systems that provide consistent fuel quality and sustainability verification, particularly appealing in regions where emissions standards and renewable energy targets represent critical operational requirements.
Market expansion benefits from growing international procurement capabilities and long-term supply agreements that enable stable biomass sourcing for utility-scale applications. Technology adoption follows patterns established in renewable energy sectors, where reliability and sustainability certification drive procurement decisions and operational deployment.
Market Intelligence Brief:
Germany's advanced residential heating market demonstrates sophisticated wood pellet deployment with documented operational effectiveness in residential heating applications and commercial facility installations through integration with existing heating systems and building infrastructure. The country leverages engineering expertise in renewable heating and certification systems to maintain a 10% CAGR. Residential centers showcase premium ENplus certified installations where pellet heating systems integrate with comprehensive building management platforms and emissions monitoring systems to optimize thermal efficiency and sustainability performance.
German pellet consumers prioritize system reliability and certification compliance in heating development, creating demand for premium-grade pellets with advanced features, including low ash content and automated feeding compatibility. The market benefits from established ENplus certification infrastructure, with approximately 3.7 million tons of certified pellets in 2024, and a willingness to invest in residential heating technologies that provide long-term operational benefits and compliance with building efficiency standards.
Market Intelligence Brief:
The U.K.'s market expansion benefits from large-scale utility conversions, including Drax power station biomass programs, commercial heating modernization, and government renewable energy policies that increasingly incorporate wood pellets for power generation applications. The country maintains a 9.7% CAGR, driven by utility biomass conversion and increasing recognition of renewable fuel benefits, including reliable baseload power and emissions reduction capabilities.
Market dynamics focus on utility-grade pellet imports that balance advanced sustainability certification with large-volume supply requirements important to British power generators. Growing renewable energy mandates create sustained demand for certified biomass systems in utility conversion infrastructure and power generation modernization projects.
Strategic Market Considerations:
The Japanese market emphasizes advanced co-firing features, including utility-scale biomass blending and integration with comprehensive power generation platforms that manage renewable energy compliance, emissions optimization, and fuel diversification applications through unified monitoring systems. The country holds a 9.6% CAGR, driven by power sector modernization and biomass import expansion that support certified pellet integration. Japanese utilities prioritize operational effectiveness with pellet systems delivering consistent fuel quality through advanced certification verification and import quality assurance capabilities.
Technology deployment channels include major power generation utilities, specialized biomass importers, and energy sector procurement programs that support professional applications for complex co-firing applications. Premium-grade pellet compatibility with established power generation systems expands market appeal across diverse operational requirements seeking quality and sustainability benefits.
Performance Metrics:
Canada demonstrates steady market development with a 9.1% CAGR, distinguished by export-oriented production facilities' focus on international utility contracts that integrate seamlessly with port logistics systems and provide reliable long-term supply for overseas biomass demand. The market prioritizes advanced features, including integrated transportation networks, port facility capabilities, and comprehensive supply chain management that reflect Canadian forestry industry sophistication and operational excellence.
Dutch port facilities and trading infrastructure are implementing advanced biomass import systems to enhance logistics capabilities and support European pellet distribution that aligns with EU sustainability requirements and quality standards. The Netherlands market holds an 8.9% CAGR, driven by import hub modernization programs and logistics infrastructure development that emphasize certified pellet systems for European market supply. Dutch import facilities are prioritizing sustainability screening systems that provide comprehensive due diligence while maintaining efficient high-volume import operations, particularly important in European renewable fuel supply and sustainability compliance.
Market expansion benefits from deep-water port infrastructure that enables large-vessel berthing and high-capacity biomass handling aligned with European pellet distribution requirements. The logistical framework supports pellet imports through advanced port facilities and inland distribution networks that promote certified biomass systems compatible with European sustainability management capabilities.
Strategic Market Indicators:
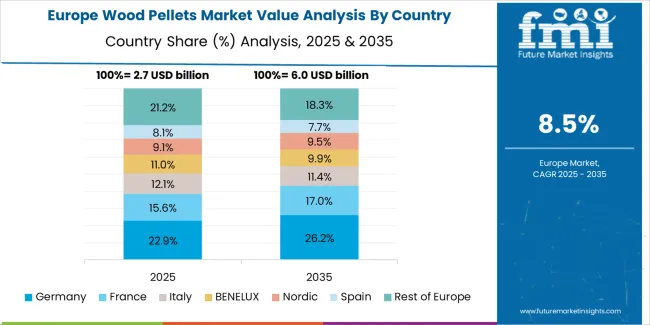
The European Wood Pellets market is projected to grow steadily over the forecast period, with Germany expected to maintain its leadership position with a 33.8% market share in 2025, supported by its advanced ENplus certification infrastructure and major residential heating adoption centers.
France follows with a 24.1% share in 2025, driven by comprehensive renewable heating programs and biomass energy development initiatives. The United Kingdom holds a 19.6% share in 2025 through utility conversion programs and EU compliance requirements. Italy commands a 12.7% share, while Spain accounts for 9.8% in 2025. The Rest of Europe region is anticipated to gain momentum, expanding its collective share from 6.9% attributed to increasing residential heating adoption in Nordic countries and emerging Eastern European biomass facilities implementing heating modernization programs.
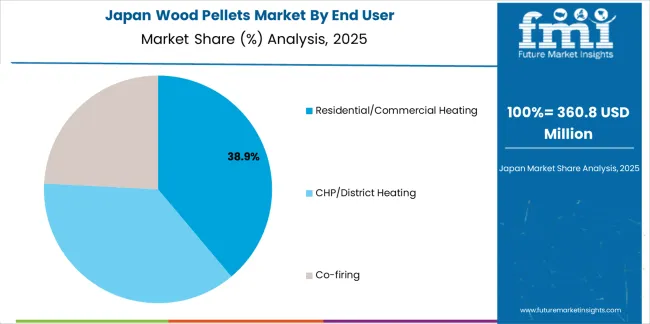
In Japan, the Wood Pellets market prioritizes forest & wood waste feedstock, which captures the dominant share of power generation and co-firing installations due to its sustainability credentials, including certified forestry sourcing and seamless integration with existing biomass import infrastructure. Japanese utilities emphasize reliability, sustainability verification, and long-term supply security, creating demand for forest-based pellets that provide consistent fuel quality and adaptive procurement strategies based on international certification requirements and sustainability standards. Other feedstock types maintain secondary positions primarily in specialized applications and pilot projects where alternative biomass sources meet experimental requirements without compromising power generation reliability.
Market Characteristics:
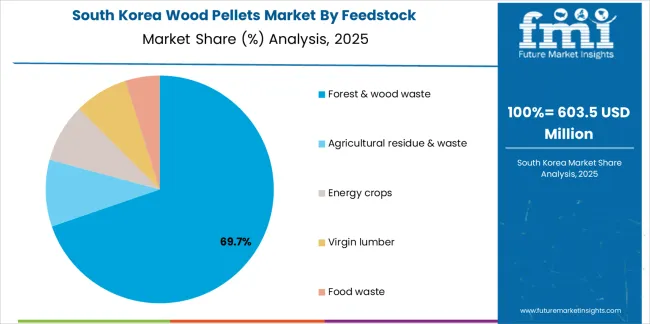
In South Korea, the market structure favors international pellet producers, including suppliers from United States, Canada, and Southeast Asia, which maintain dominant positions through comprehensive export capabilities and established utility procurement networks supporting power generation and co-firing installations. These providers offer integrated solutions combining certified pellet supply with professional logistics services and ongoing quality assurance that appeal to Korean utilities seeking reliable biomass fuel systems. Regional trading companies and import distributors capture a moderate market share by providing localized distribution capabilities and competitive pricing for utility-scale procurement, while specialty suppliers focus on premium-grade applications and certified pellet solutions tailored to Korean sustainability requirements.
Channel Insights:
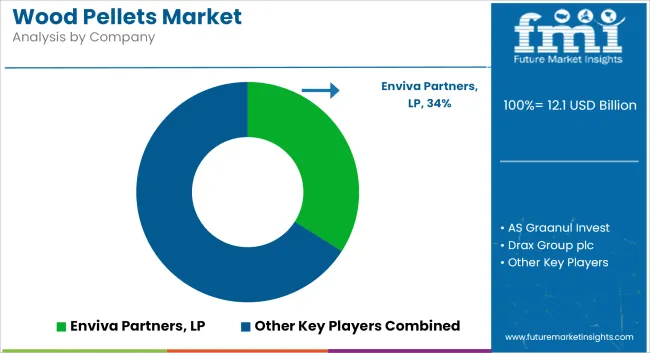
The Wood Pellets market operates with moderate concentration, featuring approximately 15-20 meaningful participants, where leading companies control roughly 35-40% of the global market share through established utility relationships and comprehensive production portfolios. Drax Group plc maintains the leading position with approximately 10% market share through extensive production capabilities and global supply operations. Competition emphasizes production capacity, sustainability certification, and supply chain reliability rather than price-based rivalry.
Market Leaders encompass Drax Group plc, Enviva Inc., and Graanul Invest, which maintain competitive advantages through extensive biomass production expertise, international utility contractor networks, and comprehensive logistics capabilities that create supply security and support long-term contract pricing. These companies leverage decades of forestry industry experience and ongoing capacity investments to develop advanced pellet production with certified sustainability standards and quality assurance features.
Technology Innovators include Pinnacle Renewable Energy, Lignetics Inc., and Fram Renewable Fuels, which compete through specialized production technology focus and innovative sustainability verification systems that appeal to utilities seeking advanced certification capabilities and operational reliability. These companies differentiate through premium-grade pellet development and specialized application focus.
Regional Specialists feature companies like Energex, Land Energy, and Vyborgskaya Cellulose, which focus on specific geographic markets and specialized applications, including export-oriented production and integrated forestry operations. Market dynamics favor participants that combine reliable production capacity with advanced sustainability certification, including FSC/PEFC verification and comprehensive traceability systems. Competitive pressure intensifies as traditional forestry companies expand into pellet manufacturing, while specialized biomass producers challenge established players through innovative production solutions and certified supply platforms targeting utility conversion segments.
| Item | Value |
|---|---|
| Quantitative Units | USD 12.1 Billion |
| End User | Residential/Commercial Heating, CHP/District Heating, Co-firing |
| Feedstock | Forest & wood waste, Agricultural residue & waste, Energy crops, Virgin lumber, Food waste |
| Grade/Certification | Industrial/Utility grade, Premium residential (ENplus/DINplus aligned) |
| Distribution/Contracting | Long-term offtake/utility contracts, Spot/merchant & traders |
| Regions Covered | North America, Europe, Asia Pacific, Latin America, Middle East & Africa |
| Countries Covered | United States, South Korea, Germany, United Kingdom, Japan, Canada, Netherlands, and 25+ additional countries |
| Key Companies Profiled | Drax Group plc, Enviva Inc., Graanul Invest, Pinnacle Renewable Energy, Lignetics Inc., Fram Renewable Fuels |
| Additional Attributes | Dollar sales by end user and feedstock categories, regional adoption trends across North America, Europe, and Asia-Pacific, competitive landscape with pellet producers and utility suppliers, consumer preferences for certified quality and supply reliability, integration with power generation platforms and heating systems, innovations in sustainability certification and production optimization, and development of long-term supply agreements with enhanced traceability and carbon accounting capabilities. |
The global wood pellets market is estimated to be valued at USD 12.1 billion in 2025.
The market size for the wood pellets market is projected to reach USD 31.1 billion by 2035.
The wood pellets market is expected to grow at a 9.9% CAGR between 2025 and 2035.
The key product types in wood pellets market are residential/commercial heating, chp/district heating and co-firing.
In terms of feedstock, forest & wood waste segment to command 68.0% share in the wood pellets market in 2025.


Full Research Suite comprises of:
Market outlook & trends analysis
Interviews & case studies
Strategic recommendations
Vendor profiles & capabilities analysis
5-year forecasts
8 regions and 60+ country-level data splits
Market segment data splits
12 months of continuous data updates
DELIVERED AS:
PDF EXCEL ONLINE
Black & Wood Pellets Industry Analysis in Europe Analysis - Size, Share, & Forecast Outlook 2025 to 2035
Demand for Black & Wood Pellets in Europe Size and Share Forecast Outlook 2025 to 2035
Wood Plastic Composite Market Size and Share Forecast and Outlook 2025 to 2035
Wooden Pallet Rental Service Market Size and Share Forecast Outlook 2025 to 2035
Wood Recycling Equipment Market Size and Share Forecast Outlook 2025 to 2035
Woodfree Paper Market Size and Share Forecast Outlook 2025 to 2035
Wooden Crate Market Forecast and Outlook 2025 to 2035
Wood-Polymer Bottle Molders Market Size and Share Forecast Outlook 2025 to 2035
Woodworking CNC Tools Market Size and Share Forecast Outlook 2025 to 2035
Wooden Cutlery Market Size and Share Forecast Outlook 2025 to 2035
Wood Coating Resins Market Size and Share Forecast Outlook 2025 to 2035
Wooden & Plywood Packaging Market Size and Share Forecast Outlook 2025 to 2035
Wood Adhesives and Binders Market Size and Share Forecast Outlook 2025 to 2035
Wood Adhesives Market Size and Share Forecast Outlook 2025 to 2035
Wooden Furniture Market Size and Share Forecast Outlook 2025 to 2035
Woody Biomass Boiler Market Size and Share Forecast Outlook 2025 to 2035
Wooden Interior Door Market Size and Share Forecast Outlook 2025 to 2035
Woodworking Circular Saw Blades Market Size and Share Forecast Outlook 2025 to 2035
Wood Activated Carbon Market Size and Share Forecast Outlook 2025 to 2035
Wood Pallets Market Trends – Innovations & Growth 2025 to 2035

Thank you!
You will receive an email from our Business Development Manager. Please be sure to check your SPAM/JUNK folder too.
Chat With
MaRIA