The global woodworking CNC tools market is valued at USD 8.2 billion in 2025. It is slated to reach USD 13.3 billion by 2035, recording an absolute increase of USD 5.1 billion over the forecast period. This translates into a total growth of 62.2%, with the market forecast to expand at a compound annual growth rate (CAGR) of 5% between 2025 and 2035. The overall market size is expected to grow by nearly 1.6X during the same period, supported by increasing demand for automated woodworking solutions in furniture manufacturing, growing adoption of precision CNC tools in modular construction applications, and rising emphasis on customized wood products and high-performance cutting technologies across diverse woodworking, construction, and industrial applications.
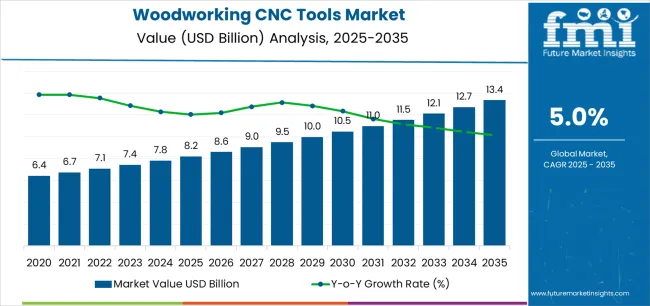
Between 2025 and 2030, the woodworking CNC tools market is projected to expand from USD 8.2 billion to USD 10.3 billion, resulting in a value increase of USD 2.1 billion, which represents 41.2% of the total forecast growth for the decade. This phase of development will be shaped by increasing automation in furniture manufacturing and growing modular construction adoption, rising demand for precision cutting tools in customized wood products, and expanding adoption of advanced CNC technologies in woodworking shops and construction applications. Furniture manufacturers and woodworking professionals are expanding their CNC tool capabilities to address the growing demand for automated and high-precision machining solutions that ensure product quality, operational efficiency, and design flexibility.
| Metric | Value |
|---|---|
| Estimated Value in (2025E) | USD 8.2 billion |
| Forecast Value in (2035F) | USD 13.3 billion |
| Forecast CAGR (2025 to 2035) | 5% |
From 2030 to 2035, the market is forecast to grow from USD 10.3 billion to USD 13.3 billion, adding another USD 3.0 billion, which constitutes 58.8% of the overall ten-year expansion. This period is expected to be characterized by the expansion of smart manufacturing technologies and Industry 4.0 integration in woodworking operations, the development of sustainable wood processing methods and eco-friendly cutting tool materials, and the growth of specialized applications for architectural woodwork and premium furniture manufacturing. The growing adoption of digital manufacturing platforms and automated tool management systems will drive demand for woodworking CNC tools with enhanced durability, improved cutting precision, and advanced coating technologies.
Between 2020 and 2025, the woodworking CNC tools market experienced steady growth, driven by increasing automation in furniture production and growing recognition of CNC tools as essential equipment for enhancing manufacturing efficiency and product quality in diverse woodworking and construction applications. The market developed as manufacturing engineers and woodworking professionals recognized the potential for CNC tool technology to improve cutting precision, reduce material waste, and support customization requirements while meeting production efficiency objectives. Technological advancement in carbide materials and coating technologies began emphasizing the critical importance of maintaining tool life and cutting performance in challenging wood processing environments.
Market expansion is being supported by the increasing global demand for furniture and modular construction driven by urbanization trends and rising disposable incomes, alongside the corresponding need for precision cutting tools that can enhance manufacturing efficiency, enable complex designs, and maintain operational productivity across various woodworking shops, construction sites, and industrial manufacturing applications. Modern furniture manufacturers and woodworking professionals are increasingly focused on implementing CNC tool solutions that can improve cutting accuracy, extend tool life, and provide consistent performance in demanding production environments.
The growing emphasis on automation and digital manufacturing is driving demand for woodworking CNC tools that can support smart factory initiatives, enable predictive maintenance, and ensure comprehensive process optimization. Manufacturing facilities' preference for cutting tools that combine performance excellence with durability characteristics and cost-effectiveness is creating opportunities for innovative CNC tool implementations. The rising influence of customized furniture demand and architectural woodwork applications is also contributing to increased adoption of woodworking CNC tools that can provide superior cutting characteristics without compromising productivity or design flexibility.
The market is segmented by tool type, wood type, operation, sales channel, end-use, and region. By tool type, the market is divided into router bits, insert knives, engraving tools, cutters, and others. Router bits are further sub-segmented into standard router bits and carbide-tipped router bits. Based on wood type, the market is categorized into plywood, chipboard, MDF, HDF, hardwood, and others. By operation, the market includes milling, drilling, cutting, and profiling. Based on sales channel, the market is segmented into OEM and rental service provider. By end-use, the market covers woodworking shop, construction, and others. Regionally, the market is divided into East Asia, Europe, North America, South Asia, Latin America, Middle East & Africa, and Eastern Europe.
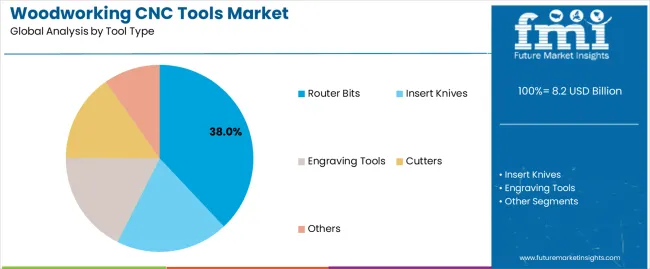
The router bits segment is projected to maintain its leading position in the woodworking CNC tools market in 2025 with a 38% market share, reaffirming its role as the preferred tool category for edge profiling, grooving, and decorative cutting applications in furniture manufacturing and woodworking operations. Furniture manufacturers and woodworking professionals increasingly utilize router bits for their versatile cutting capabilities, excellent edge finishing quality, and proven effectiveness in creating complex profiles and decorative patterns. Router bit technology's proven effectiveness and application versatility directly address the industry requirements for customized furniture production and architectural woodwork across diverse design specifications and material types.
This tool segment forms the foundation of modern CNC woodworking operations, as it represents the cutting tool with the greatest contribution to design flexibility and established performance record across multiple furniture applications and wood processing operations. Within the router bits segment, carbide-tipped router bits dominate with a 60.0% share, driven by their superior wear resistance and extended tool life compared to standard router bits. Manufacturing industry investments in automated woodworking technologies continue to strengthen adoption among furniture makers and woodworking professionals. With market pressures requiring improved productivity and enhanced cutting precision, router bits align with both operational objectives and quality requirements, making them the central component of comprehensive CNC woodworking strategies.
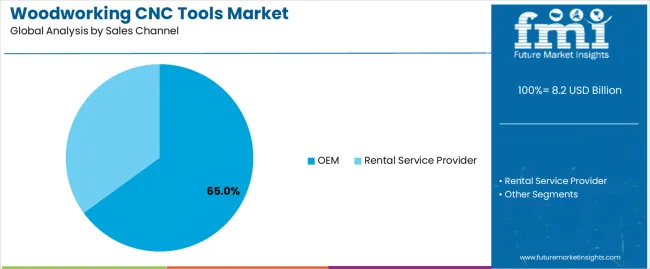
The OEM sales channel segment is projected to represent the largest share of woodworking CNC tools distribution in 2025 with a 65% market share, underscoring its critical role as the primary channel for direct equipment integration and original tool supply to CNC machine manufacturers and industrial woodworking facilities. OEM channels provide specialized tool solutions designed for specific machine configurations, ensuring optimal compatibility, performance reliability, and technical support throughout the equipment lifecycle. Positioned as essential distribution pathway for industrial applications, OEM channels offer both quality assurance and comprehensive technical assistance.
The segment is supported by continuous expansion of CNC machine installations and the growing adoption of integrated tool management systems that require OEM-specified cutting tools for warranty compliance and performance optimization. Additionally, industrial manufacturers are investing in strategic OEM partnerships to ensure consistent tool supply, technical expertise, and performance validation for their automated woodworking operations.
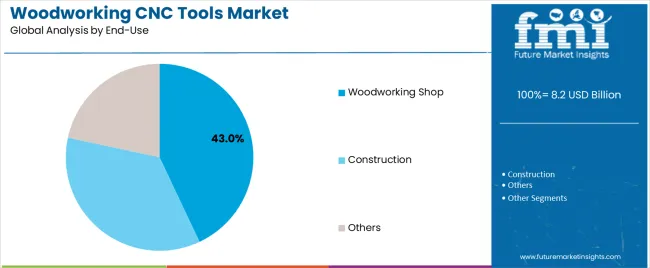
The woodworking shop end-use segment is projected to represent the largest share of woodworking CNC tools demand in 2025 with a 43.0% market share, underscoring its critical role as the primary application environment for custom furniture manufacturing, cabinetry production, and specialized wood products requiring precision CNC machining capabilities. Woodworking shops utilize CNC tools for diverse operations including furniture fabrication, architectural millwork, and custom component manufacturing that demand versatile cutting capabilities and consistent quality output. Positioned as essential facilities for customized wood products, woodworking shops offer both design flexibility and production expertise.
The segment is supported by continuous growth in custom furniture demand and the expanding adoption of CNC technology among small and medium-sized woodworking businesses seeking competitive advantages through automation and precision manufacturing. Additionally, woodworking professionals are investing in comprehensive CNC tool inventories to support increasingly diverse project requirements and customer specifications for residential and commercial applications. As furniture customization trends intensify and architectural woodwork demand increases, the woodworking shop end-use segment will continue to dominate the market while supporting advanced machining techniques and design innovation strategies.
The woodworking CNC tools market is advancing steadily due to increasing demand for automated furniture manufacturing driven by labor cost pressures and growing adoption of modular construction requiring precision wood processing providing enhanced productivity and quality benefits across diverse woodworking, construction, and industrial manufacturing applications. However, the market faces challenges, including high initial investment costs for CNC equipment and tooling systems, competition from conventional woodworking tools and manual processing methods, and technical constraints related to tool wear rates and material-specific cutting parameters. Innovation in coating technologies and smart tool monitoring systems continues to influence product development and market expansion patterns.
The growing adoption of modular construction methods is driving demand for precision CNC tools that address critical wood processing requirements including dimensional accuracy for prefabricated panels, consistent quality for modular components, and high-volume production capabilities for standardized building elements. Modular construction projects require sophisticated woodworking tools that deliver repeatable precision, minimize production variations, and maintain efficiency for large-scale manufacturing operations. Construction industry's emphasis on off-site fabrication and rapid installation timelines is creating substantial opportunities for CNC tool providers serving prefabricated wood component manufacturers with stringent quality specifications and productivity requirements.
Modern woodworking facilities are incorporating Industry 4.0 principles and smart manufacturing technologies to enhance operational efficiency, enable predictive tool maintenance, and support comprehensive production optimization through connected CNC systems and real-time monitoring capabilities. Leading manufacturers are developing intelligent tool management systems, implementing automated tool changing mechanisms, and advancing sensor technologies that monitor cutting performance and tool condition. These technologies improve operational visibility while enabling new productivity benefits, including reduced downtime, optimized tool utilization, and enhanced quality control. Advanced digital integration also allows manufacturers to support comprehensive production planning and resource optimization beyond traditional manual tool management approaches.
The advancement of cutting tool materials and surface engineering is driving adoption of next-generation CNC tools with enhanced wear resistance, improved cutting performance, and extended tool life through innovative coating systems and optimized carbide substrate formulations. These advanced tools incorporate multilayer coating technologies, nanostructured surface treatments, and specialized carbide grades that deliver superior performance in demanding wood processing applications. Manufacturers are investing in materials research and coating development capabilities to serve evolving woodworking requirements while supporting productivity improvements in furniture manufacturing, construction, and specialized wood processing industries.
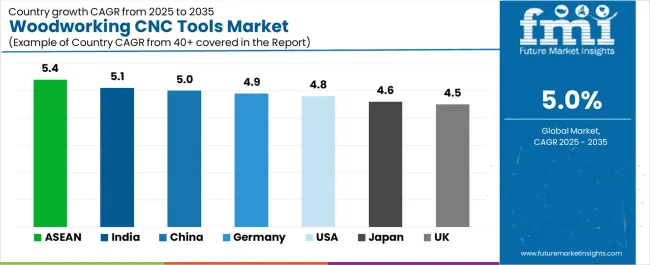
| Country | CAGR (2025-2035) |
|---|---|
| ASEAN | 5.4% |
| India | 5.1% |
| China | 5% |
| Germany | 4.9% |
| USA | 4.8% |
| Japan | 4.6% |
| UK | 4.5% |
The woodworking CNC tools market is experiencing solid growth globally, with ASEAN leading at a 5.4% CAGR through 2035, driven by rapid furniture export growth, expanding adoption of CNC technology for modular furniture production, and increasing investments in automated woodworking facilities across Southeast Asian countries. India follows at 5.1%, supported by rising demand for modular construction solutions, growing customized wood products market, and expanding furniture manufacturing capacity serving domestic and export markets. China shows growth at 5%, emphasizing significant investments in automated manufacturing infrastructure, construction sector expansion, and large-scale furniture production capabilities. Germany demonstrates 4.9% growth, supported by precision woodworking demand for luxury furniture manufacturing, architectural applications, and engineering excellence in wood processing technologies. The United States records 4.8%, focusing on rapid furniture sector growth, home improvement market expansion, and modular construction adoption in residential and commercial projects. Japan exhibits 4.6% growth, emphasizing increasing adoption of advanced CNC systems in high-precision woodworking and premium furniture manufacturing. The United Kingdom shows 4.5% growth, supported by demand for high-precision furniture manufacturing and customized wood products across residential and commercial applications.
The report covers an in-depth analysis of 40+ countries top-performing countries are highlighted below.
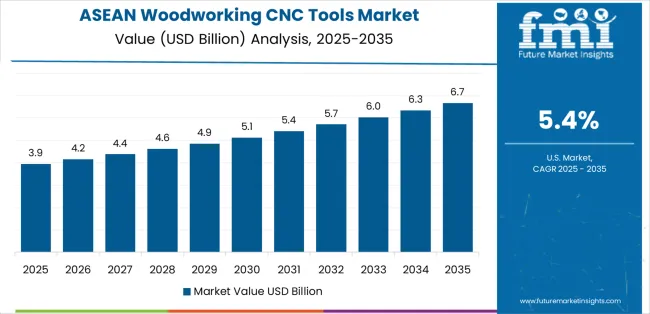
Revenue from woodworking CNC tools in ASEAN is projected to exhibit exceptional growth with a CAGR of 5.4% through 2035, driven by rapidly expanding furniture export industries and growing adoption of CNC automation for modular furniture production supported by government industrial development initiatives and foreign investment in manufacturing infrastructure. The region's massive furniture manufacturing capacity and increasing investment in advanced woodworking technologies are creating substantial demand for CNC tool solutions. Major furniture manufacturers and woodworking facilities are establishing comprehensive automated production capabilities to serve both regional markets and global export opportunities.
Revenue from woodworking CNC tools in India is expanding at a CAGR of 5.1%, supported by rising demand for modular construction solutions in residential and commercial sectors, growing market for customized wood products, and expanding furniture manufacturing capacity driven by urbanization and increasing middle-class consumption. The country's comprehensive construction sector growth and evolving consumer preferences are driving sophisticated CNC tool adoption throughout diverse woodworking applications. Leading furniture manufacturers and construction material suppliers are establishing extensive production and customization facilities requiring advanced CNC tooling systems.
Revenue from woodworking CNC tools in China is expanding at a CAGR of 5%, supported by the country's position as the world's largest furniture producer, significant investments in automated manufacturing infrastructure, and expanding construction sector driving demand for wood processing capabilities. The nation's comprehensive manufacturing ecosystem and technological advancement are driving sophisticated CNC tool capabilities throughout industrial sectors. Leading furniture manufacturers and construction material companies are investing extensively in automated production systems and precision cutting technologies.
Revenue from woodworking CNC tools in Germany is expanding at a CAGR of 4.9%, driven by the country's reputation for precision woodworking in luxury furniture manufacturing, sophisticated architectural woodwork applications, and engineering excellence in wood processing technologies. Germany's craftsmanship tradition and technological innovation are driving demand for high-specification CNC tools. Leading furniture manufacturers and specialized woodworking companies are investing in advanced cutting technologies for premium product segments.
Revenue from woodworking CNC tools in the United States is expanding at a CAGR of 4.8%, supported by rapid furniture sector growth driven by housing market activity, expanding home improvement market, and increasing adoption of modular construction methods in residential and commercial building projects. The nation's comprehensive woodworking industry and construction sector are driving demand for diverse CNC tool solutions. Furniture manufacturers and construction companies are investing in automation capabilities to enhance productivity and address labor availability challenges.
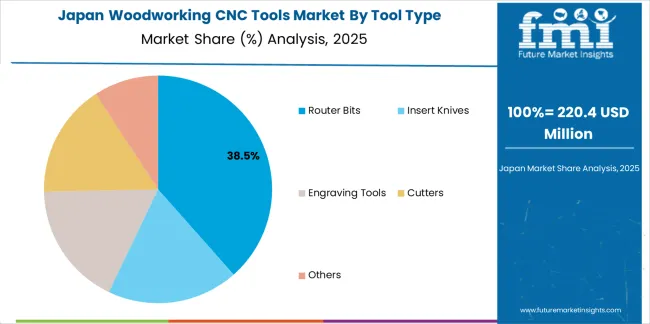
Revenue from woodworking CNC tools in Japan is expanding at a CAGR of 4.6%, supported by the country's increasing adoption of advanced CNC systems in high-precision woodworking applications, premium furniture manufacturing sector, and sophisticated wood processing technologies for specialized applications. Japan's technological sophistication and quality focus are driving demand for high-performance cutting tools. Leading furniture manufacturers and precision woodworking facilities are investing in state-of-the-art CNC capabilities.
Revenue from woodworking CNC tools in the United Kingdom is growing at a CAGR of 4.5%, driven by demand for high-precision furniture manufacturing, growing market for customized wood products, and expanding residential and commercial construction activity supporting woodwork applications. The UK's furniture industry innovation and design focus are supporting investment in advanced CNC technologies. Furniture manufacturers and woodworking specialists are establishing comprehensive customization capabilities incorporating precision cutting tools.
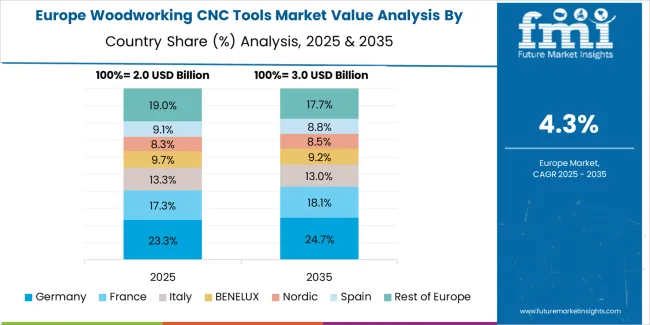
The woodworking CNC tools market in Europe is projected to grow from USD 4.7 billion in 2025 to USD 7.5 billion by 2035, registering a CAGR of 4.8% over the forecast period. Germany is expected to maintain leadership with a 34.0% market share in 2025, moderating to 34.7% by 2035, supported by strong demand for high-precision tools in furniture manufacturing and architectural applications.
France follows with 19.1% in 2025, projected at 18.7% by 2035, driven by increasing customization in wood products and modular construction adoption. The United Kingdom holds 14.9% in 2025, declining slightly to 14.7% by 2035 due to market maturity and competitive pressures. Italy commands 10.6% in 2025, rising to 10.7% by 2035, while Spain accounts for 8.5% in 2025, reaching 9.3% by 2035 aided by strong market growth in modular furniture and architectural wood processing. The Rest of Europe region, including Nordics, Central & Eastern Europe, and other markets, is anticipated to hold 12.8% in 2025 and 12.0% by 2035, reflecting steady adoption of CNC solutions across diverse woodworking applications.
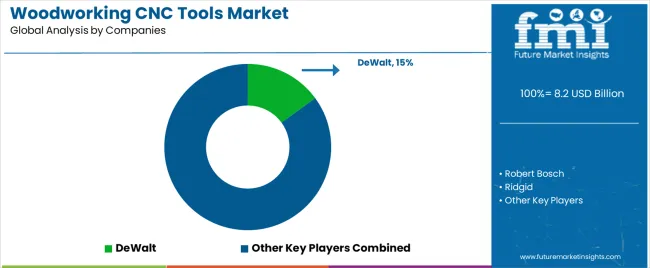
The woodworking CNC tools market is characterized by competition among established power tool manufacturers, specialized cutting tool producers, and diversified industrial equipment companies. Companies are investing in coating technology development, carbide material innovation, product portfolio expansion, and application-specific tool development to deliver high-performance, durable, and cost-effective woodworking CNC tool solutions. Innovation in multilayer coating systems, smart tool monitoring technologies, and advanced carbide formulations is central to strengthening market position and competitive advantage.
DeWalt leads the market with a 15% share, offering comprehensive woodworking CNC tool solutions with a focus on professional applications, durability standards, and versatile cutting capabilities across diverse furniture manufacturing and construction applications. The company maintains its position through extensive distribution networks and strong brand recognition among professional woodworkers and industrial users. Robert Bosch provides innovative power tools and CNC cutting solutions with emphasis on precision engineering and technology integration, commanding a 12.0% market share through continuous product innovation and quality excellence.
Ridgid delivers high-performance CNC solutions for precision wood cutting applications with focus on professional users, holding a 10.0% market share. The company launched the MAX Output EXP lithium-ion battery with tabless cell technology in September 2024, enhancing energy transfer efficiency for CNC tools in high-demand environments. Kreg Tool Company specializes in woodworking machinery and CNC accessories, commanding an 8.5% share with focus on furniture manufacturing applications. Altendorf GmbH focuses on high-end CNC tools for woodworking and industrial applications with a 7.0% market share, emphasizing precision and quality for premium segments.
Vortex Tool Company Inc. is known for manufacturing customized CNC cutting tools, holding a 6.5% market share with expertise in application-specific solutions. GUHDO commands a 6.0% share, focusing on specialized cutting tools for wood processing. Rockler Companies provides a range of high-quality CNC tools for DIY and professional sectors with a 5.5% share, having announced the release of a new line of advanced CNC router bits in March 2025, designed for enhanced durability and superior cutting precision in modular furniture production. FEIN Power Tools Inc. offers cutting and profiling tools for wood processing with a 5% share. Shanghai AMC Int'l Trading Co., Ltd. supplies CNC tools for the Asian market with a 4.5% market share, supporting regional manufacturing operations.
Woodworking CNC tools represent a specialized cutting tool segment within furniture manufacturing and wood processing applications, projected to grow from USD 8.2 billion in 2025 to USD 13.3 billion by 2035 at a 5% CAGR. These precision cutting implements—primarily router bits, insert knives, and specialized cutting tools for automated machining—serve as essential equipment in furniture production, construction applications, and specialized woodworking where cutting precision, tool durability, and operational efficiency are essential. Market expansion is driven by increasing furniture manufacturing automation, growing modular construction adoption, expanding demand for customized wood products, and rising emphasis on productivity improvement across diverse woodworking shops, construction operations, and industrial manufacturing facilities.
How Industrial Regulators Could Strengthen Safety Standards and Performance Requirements?
How Industry Associations Could Advance Technology Standards and Market Development?
How Woodworking CNC Tool Manufacturers Could Drive Innovation and Market Leadership?
How End-User Industries Could Optimize Tool Performance and Productivity?
How Research Institutions Could Enable Technology Advancement?
How Investors and Financial Enablers Could Support Market Growth and Innovation?
| Items | Values |
|---|---|
| Quantitative Units (2025) | USD 8.2 billion |
| Tool Type | Router Bits (Standard Router Bits, Carbide-Tipped Router Bits), Insert Knives, Engraving Tools, Cutters, Others |
| Wood Type | Plywood, Chipboard, MDF, HDF, Hardwood, Others |
| Operation | Milling, Drilling, Cutting, Profiling |
| Sales Channel | OEM, Rental Service Provider |
| End-Use | Woodworking Shop, Construction, Others |
| Regions Covered | East Asia, Europe, North America, South Asia, Latin America, Middle East & Africa, Eastern Europe |
| Countries Covered | China, India, United States, Germany, Japan, United Kingdom, ASEAN countries, and 40+ countries |
| Key Companies Profiled | DeWalt, Robert Bosch, Ridgid, Kreg Tool Company, Altendorf GmbH, Vortex Tool Company Inc. |
| Additional Attributes | Dollar sales by tool type, wood type, operation, sales channel, and end-use segments, regional demand trends, competitive landscape, technological advancements in cutting tool materials, coating technology development, automation integration, and performance optimization |
The global woodworking cnc tools market is estimated to be valued at USD 8.2 billion in 2025.
The market size for the woodworking cnc tools market is projected to reach USD 13.4 billion by 2035.
The woodworking cnc tools market is expected to grow at a 5.0% CAGR between 2025 and 2035.
The key product types in woodworking cnc tools market are router bits , insert knives, engraving tools, cutters and others.
In terms of sales channel, oem segment to command 65.0% share in the woodworking cnc tools market in 2025.


Full Research Suite comprises of:
Market outlook & trends analysis
Interviews & case studies
Strategic recommendations
Vendor profiles & capabilities analysis
5-year forecasts
8 regions and 60+ country-level data splits
Market segment data splits
12 months of continuous data updates
DELIVERED AS:
PDF EXCEL ONLINE
Examining Market Share Trends in Woodworking CNC Tools
Woodworking Circular Saw Blades Market Size and Share Forecast Outlook 2025 to 2035
Woodworking Router Bits Market Growth - Trends & Forecast 2035
Woodworking Machines Market
Woodworking Tools Market
Europe Woodworking Power Tools Market Growth - Trends & Forecast 2025 to 2035
CNC Abovefloor Wheel Lathe Market Size and Share Forecast Outlook 2025 to 2035
CNC Industrial Paper Cutter Market Size and Share Forecast Outlook 2025 to 2035
CNC Plasma Cutting Machines Market Size and Share Forecast Outlook 2025 to 2035
CNC Controller Market Size and Share Forecast Outlook 2025 to 2035
CNC Tool Storage System Market
Desktop CNC Milling Machines Market Size and Share Forecast Outlook 2025 to 2035
Railway CNC Wheel Lathe Market Size and Share Forecast Outlook 2025 to 2035
Tabletop CNC Milling Machines Market Analysis - Size, Share, and Forecast Outlook 2025 to 2035
Hand Tools Market Size and Share Forecast Outlook 2025 to 2035
Key Players in the Hand Tools Market Share Analysis
Power Tools Market Size and Share Forecast Outlook 2025 to 2035
Smart Tools Market Size and Share Forecast Outlook 2025 to 2035
Power Tools Industry Analysis in India - Size, Share, and Forecast Outlook 2025 to 2035
Baking Tools Market Size and Share Forecast Outlook 2025 to 2035

Thank you!
You will receive an email from our Business Development Manager. Please be sure to check your SPAM/JUNK folder too.
Chat With
MaRIA