Reports
- Global Locations -
Headquarters
Future Market Insights, Inc.
Christiana Corporate, 200
Continental Drive, Suite 401,
Newark, Delaware - 19713,
United States
Americas
Future Market Insights, Inc.
616 Corporate Way, Suite 2-9018,
Valley Cottage, NY 10989, United States
MEA
Future Market Insights
1602-6 Jumeirah Bay X2 Tower, Plot No: JLT-PH2-X2A,
Jumeirah Lakes Towers, Dubai,
United Arab Emirates
Europe
Future Market Insights
3rd Floor, 207 Regent Street,
W1B 3HH London
United Kingdom
Asia Pacific
Future Market Insights
Office No. 401-A, 4th Floor,
VANTAGE 9, S.No. 36/1/1,
Baner, Pune 411045, India
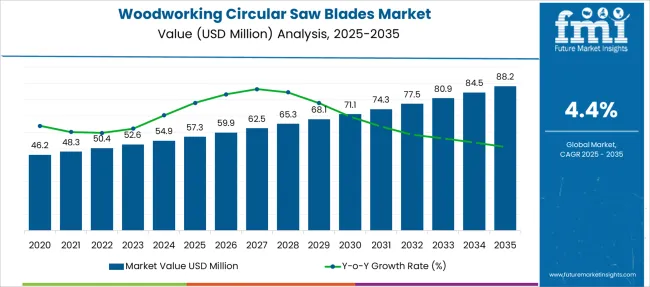
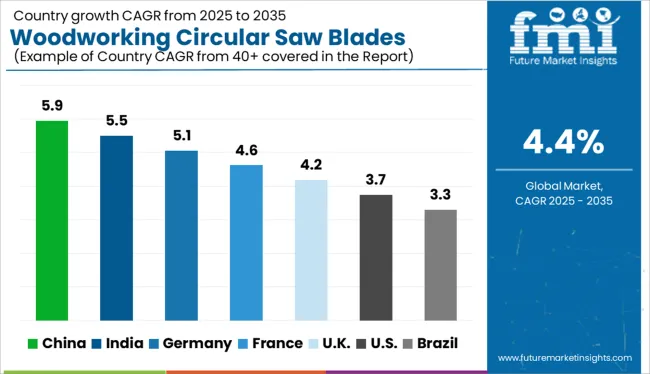
[197 Pages Report] Revenue from the global woodworking circular saw blades market is predicted to rise at a CAGR of 4.4% from 2022 to 2029, which stands at a valuation of US$ 50.4 Million in 2022. Shipments of woodworking circular saw blades are estimated to account for a net worth of US$ 68.3 Million by 2029.
Attribute | Details |
---|---|
Woodworking Circular Saw Blades Market Size (2022) | US$ 50.4 Million |
Predicted Market Revenue (2029) | US$ 68.3 Million |
Forecasted Growth Rate (2022-2029) | 4.4% CAGR |
Europe Market Share (2022) | 28.3% |
Sales of woodworking circular saw blades account for 8% share of the global woodworking tools market at present. Demand for circular saws has gained impetus over the past few years due to their improved precision capabilities and low cost.
DIY projects have been extensively popular in the modern digital age, and this has driven demand for woodworking circular saws, which, in turn, is driving woodworking circular saw blade sales as well.
Don't pay for what you don't need
Customize your report by selecting specific countries or regions and save 30%!
Market Statistics | Details |
---|---|
H1,2021 (A) | 4.0% |
H1,2022 Projected (P) | 4.2% |
H1,2022 Outlook (O) | 4.3% |
BPS Change : H1,2022 (O) - H1,2022 (P) | (+) 10 ↑ |
BPS Change : H1,2022 (O) - H1,2021 (A) | (+) 29 ↑ |
FMI presents a half-yearly comparison analysis and key insights about the growth outlook of the woodworking circular saw blades market. Global urbanization and industrialization have raised demand for circular saw blades used in the woodworking industry. Circular saw blade usage for woodworking has been significantly impacted by shifting lifestyle habits around the world.
According to FMI analysis, the variation between the BPS values observed in the Woodworking Circular Saw Blades market in H1, 2022-Outlook over H1, 2022-Project reflects a rise of 10 units. Moreover, compared to H1, 2021, the market is expected to rise by 29 BPS in H1 2022.
The global market for woodworking circular saw blades has been greatly impacted by technological improvements and product developments. Circular saw blade sales for woodworking are anticipated to benefit in the near future from the increasing profusion of new technology in industries.
Global industrialization has accelerated, and economies like India and China, in particular, have tremendous potential. The need for building new homes and businesses is rising along with the global population, which has a significant impact on the market for woodworking circular saw blades. In recent years, tools with diamond coatings have become more popular than those with carbide coatings because they provide greater abrasion resistance and longer tool life, impacting the market growth.
Urbanization and industrialization on a global scale have resulted in increased demand for woodworking circular saw blades. Changing lifestyle trends across the world have also substantially impacted the consumption of woodworking circular saw blades.
Sales of woodworking circular saw blades accounted for a net worth of US$ 38.1 Mn in 2014 and rose at a CAGR of 3.5% and attained a valuation of US$ 48.4 Mn by the end of 2021.
Increasing scope of application across multiple industry verticals like automotive, building & construction, etc. is expected to be a prominent factor that is anticipated to propel market potential in the forthcoming years.
Technological advancements and product developments have significantly influenced the woodworking circular saw blades market across the world. Rising proliferation of advanced technologies in industries is expected to aid woodworking circular saw blade sales in near future.
Shipments of woodworking circular saw blades from 2022 to 2029 are estimated to rise at a 4.4% CAGR.
“Increased Industrialization and Rising Construction Activity to Guide Woodworking Circular Saw Blade Demand”
Industrialization has increased across the world and especially it has seen immense potential in economies like India and China. The population of the world is increasing and so is the demand for construction of residential and commercial structures which in turn is majorly influencing the woodworking circular saw blades marketplace. Woodworking circular saw blade manufacturers are launching new and advanced circular saws for the aforementioned applications.
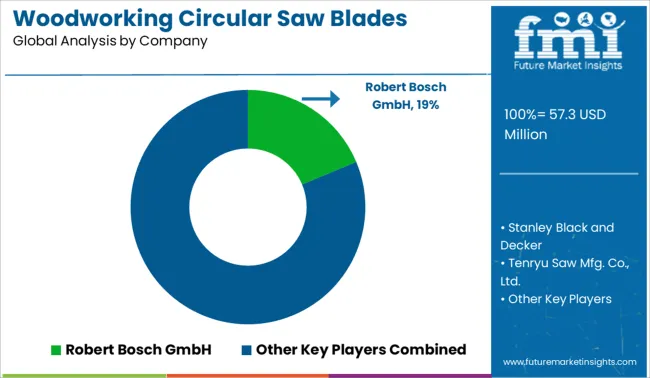
Popular Mechanics in an article stated that Bosch’s GKS18V-25GC Circular Saw is one of the best that they have ever tested. With amazing accuracy and factory standard 24-tooth blade, this circular saw is already counted among the best and should emerge as a popular choice in construction and furniture industry for its nimble precision and accuracy statistics.
“Rising Popularity of Diamond-coated Tools to Hinder Market Growth Potential”
In recent times, diamond-coated tools have gained popularity over carbide-coated tools as they offer higher abrasion resistance and longer tool life. This is expected to adversely affect woodworking circular saw blade shipments over the forecast.
However, the high cost of diamond-coated tools is a hurdle that manufacturers haven’t figured out which is a relief for carbide-coated tool manufacturers. So for now diamond-coated tools have a minimal impact but this could change over the coming years as prices of these tools get competitive.
“East Asian and South Asian Regions Anticipated to See High Demand for Woodworking Circular Saw Blades”
The global woodworking circular saw blades industry analysis provides detailed insights across multiple geographies such as North America, Latin America, Europe, East Asia, South Asia & Pacific, and the Middle East & Africa (MEA).
The North America woodworking circular saw blades market accounts for a share of 23.7% of the global woodworking circular saw blades industry in 2022. Increased use of wood in commercial and residential building applications has been a major influential factor for woodworking circular saw blades consumption in this region.
Sales of woodworking circular saw blades in Europe are expected to be primarily driven by increased reconstruction and remodeling activities in this region. Renovation of old structures, new construction activities, etc. are some other factors that would be crucial in the European woodworking circular saw blades industry which currently holds a significant market share of 28.3% in the global marketplace.
Woodworking circular saw blades are expected to see high demand from regions such as South Asia, East Asia, and the Pacific. These regions are expected to prove highly lucrative for woodworking circular saw blade suppliers. Increased construction activities in the residential, as well as commercial sectors in these regions, is anticipated to majorly drive woodworking circular saw blades demand in the aforementioned regions.
“Increasing Scope for Residential and Commercial Application of Circular Woodworking Saws”
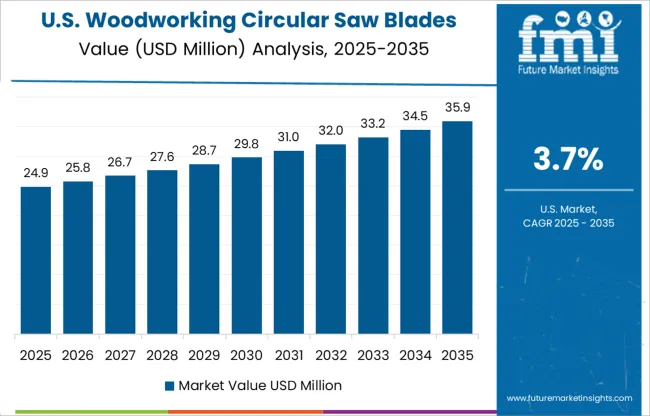
With being one of the foremost economies of the world, the U.S. offers extremely lucrative opportunities in its residential and commercial construction sectors as it is a highly popular real estate market. High spending potential propels demand for circular saws for fine woodworking in the U.S.
Increasing number of immigrants in the U.S. are also expected to drive up the demand for construction of new structures which subsequently propels woodworking circular saw blade sales.
“Changing Lifestyle Trends Expected to Propel Demand for Fine Woodworking”
Rising disposable income in India has led to some major changes in lifestyle trends over the past years and is expected to shape demand for circular saws for fine woodworking. Lifestyle changes have led to an increase in renovations and a high standard of living has given impetus to fine woodworking.
Increasing demand for premium furniture from commercial and residential sectors is expected to guide woodworking circular saw blades demand in India over the forecast.
Get the data you need at a Fraction of the cost
Personalize your report by choosing insights you need
and save 40%!
“Offline Sales of Woodworking Saws to Lose Market Share to Online Sales by 2029”
Offline mode currently dominates woodworking circular saw blade sales and is anticipated to hold this stance over the next few years as well. Increasing digitization is expected to come into play and increase the share of online sales with rising preference of consumers for online shopping and increasing use of e-Commerce platforms.
However, both sales channels are expected to contribute significantly to the global revenues as the product portfolio is expanded by woodworking circular saw blade suppliers to boost sales.
In 2020, sales of woodworking circular saw blades took a major hit as many end-use industries such as automotive and construction suffered negatively in the wake of worldwide lockdown mandates imposed to curb the spread of coronavirus infections on a global scale. With the disease becoming a pandemic and manufacturing activities coming to a near standstill, woodworking circular saw blade shipments were disrupted and the market was adversely impacted.
This trend is expected to change in the post-pandemic era when manufacturing activities resume and get back to operational capacities. Consumption of woodworking circular saw blades is anticipated to rise at a steady pace as construction activities resume across the world.
Woodworking circular saw blade manufacturers are investing in the research and development of more advanced and efficient tools that make woodworking a task of ease. Woodworking circular saw blade companies are also focusing on launching new products to expand their product portfolios and maximize sales via increasingly popular online channels.
Attribute | Details |
---|---|
Forecast Period | 2022 to 2029 |
Historical Data Available for | 2014 to 2021 |
Market Analysis | US$ Million for Value |
Key Regions Covered |
|
Key Countries Covered |
|
Key Market Segments Covered |
|
Key Companies Profiled |
|
Pricing | Available upon Request |
Woodworking Circular Saw Blades Market by Mode of Operation:
Woodworking Circular Saw Blades Market by Blade Type:
Woodworking Circular Saw Blades Market by Diameter:
Woodworking Circular Saw Blades Market by Distribution Channel:
Woodworking Circular Saw Blades Market by End-use Industry:
Woodworking Circular Saw Blades Market by Region:
1. Study of Coverage 1.1. Woodworking Circular Saw Blades 1.2. Market Segments 1.3. Key Manufacturer Covered 1.4. Market By Type 1.4.1. Global Market Size Growth Rate by Mode of Operation 1.4.1.1. Stationery Machine 1.4.1.2. Hand Machine (Power Tool) 1.4.2. Global Market Size Growth Rate by Blade type 1.4.2.1. Framing blade 1.4.2.2. Rip-cut blades 1.4.2.3. Crosscut blade 1.4.3. Global Market Size Growth Rate by Diameter Type 1.4.3.1. Less than 100 mm 1.4.3.2. 100-200 mm 1.4.3.3. 200-300 mm 1.4.3.4. More than 300 mm 1.4.4. Global Market Size Growth Rate by Distribution Channel 1.4.4.1. Online 1.4.4.2. Offline 1.4.5. Global Market Size Growth Rate by End Use industry 1.4.5.1. Construction 1.4.5.2. Wood processing 1.4.5.3. Furniture & Carpentry 1.4.5.4. DIY 1.4.6. Global Market Size Growth Rate by End Use industry 1.4.6.1. North America 1.4.6.2. South America 1.4.6.3. Europe 1.4.6.4. Asia Pacific 1.4.6.5. MEA 1.5. Study Objectives 1.6. Years Considered 2. Executive Summary 2.1. Global Market Size 2.1.1. Global Market Value, 2014-2029 2.1.2. Global Market Volume, 2014-2029 2.2. Global Market Growth Rate By Regions 2.2.1. Global Market Value By Regions, 2014-2029 2.2.2. Global Market Volume By Regions, 2014-2029 3. Breakdown Data By Manufacturer 3.1. Global Market Sales (Volume) by Manufacturer 3.1.1. Market Sales (Volume) Share Analysis by Manufacturer 3.1.2. Market Concentration Ratio 3.2. Global Market Sales (Value) by Manufacturer 3.2.1. Market Sales (Value) Share Analysis by Manufacturer 3.2.2. Market Concentration Ratio 3.3. Global Prices by Manufacturer 3.4. Manufacturing Base Distribution, Mode of Operation 3.4.1. Manufacturers Manufacturing Base Distribution, Headquarters 3.4.2. Manufacturers by Mode of Operation 3.4.3. Date of International Manufacturers Enter into Market 3.5. List of Manufacturer 3.6. Market share by manufacturer 3.7. Competition Dashboard 4. Breakdown Data by blade type 4.1. Global Market By Blade Type 4.2. Global Market Pricing Analysis by Region 5. Breakdown Data by Mode of Operation 5.1. Overview 5.2. Global Price Breakdown Data by Mode of Operation 6. Breakdown Data by Diameter 6.1. Global Sales (‘000 Units) by Diameter 6.2. Global Revenue (US$ Mn) by Diameter 7. Breakdown Data by Distribution Channel 7.1. Global Sales (‘000 Units) by Distribution Channel 7.2. Global Revenue (US$ Mn) by Distribution Channel 8. Breakdown Data by End Use Industry 8.1. Global Sales (‘000 Units) by End Use Industry 8.2. Global Revenue (US$ Mn) by End Use Industry 9. North America 9.1. Market Size (US$ Mn) and Volume Analysis and Forecast By Country, 2014–2029 9.1.1. US 9.1.2. Canada 9.1.3. Mexico 9.2. Market Size (US$ Mn) and Volume Analysis and Forecast By Mode of Operation, 2014–2029 9.3. Market Size (US$ Mn) and Volume Analysis and Forecast By Product Type, 2014–2029 9.4. Market Size (US$ Mn) and Volume Analysis and Forecast By Diameter, 2014–2029 9.5. Market Size (US$ Mn) and Volume Analysis and Forecast By Distribution Channel, 2014–2029 10. Europe 10.1. Market Size (US$ Mn) and Volume Analysis and Forecast By Country, 2014–2029 10.1.1. Germany 10.1.2. France 10.1.3. Italy 10.1.4. UK 10.1.5. Russia 10.1.6. Rest of Europe 10.2. Market Size (US$ Mn) and Volume Analysis and Forecast By Mode of Operation, 2014–2029 10.3. Market Size (US$ Mn) and Volume Analysis and Forecast By Product Type, 2014–2029 10.4. Market Size (US$ Mn) and Volume Analysis and Forecast By Diameter, 2014–2029 10.5. Market Size (US$ Mn) and Volume Analysis and Forecast By Distribution Channel, 2014–2029 11. South America 11.1. Market Size (US$ Mn) and Volume Analysis and Forecast By Country, 2014–2029 11.1.1. Brazil 11.1.2. Rest of Central and South America 11.2. Market Size (US$ Mn) and Volume Analysis and Forecast By Mode of Operation, 2014–2029 11.3. Market Size (US$ Mn) and Volume Analysis and Forecast By Product Type, 2014–2029 11.4. Market Size (US$ Mn) and Volume Analysis and Forecast By Diameter, 2014–2029 11.5. Market Size (US$ Mn) and Volume Analysis and Forecast By Distribution Channel, 2014–2029 12. Asia Pacific 12.1. Market Size (US$ Mn) and Volume Analysis and Forecast By Country, 2014–2029 12.1.1. China 12.1.2. Japan 12.1.3. India 12.1.4. South Korea 12.1.5. ASEAN 12.1.6. Oceania 12.1.7. Rest of Asia Pacific 12.2. Market Size (US$ Mn) and Volume Analysis and Forecast By Mode of Operation, 2014–2029 12.3. Market Size (US$ Mn) and Volume Analysis and Forecast By Product Type, 2014–2029 12.4. Market Size (US$ Mn) and Volume Analysis and Forecast By Diameter, 2014–2029 12.5. Market Size (US$ Mn) and Volume Analysis and Forecast By Distribution Channel, 2014–2029 13. Middle East and Africa 13.1. Market Size (US$ Mn) and Volume Analysis and Forecast By Country, 2014–2029 13.1.1. GCC Countries 13.1.2. Turkey 13.1.3. Egypt 13.1.4. South Africa 13.1.5. Rest of MEA 13.2. Market Size (US$ Mn) and Volume Analysis and Forecast By Mode of Operation, 2014–2029 13.3. Market Size (US$ Mn) and Volume Analysis and Forecast By Product Type, 2014–2029 13.4. Market Size (US$ Mn) and Volume Analysis and Forecast By Diameter, 2014–2029 13.5. Market Size (US$ Mn) and Volume Analysis and Forecast By Distribution Channel, 2014–2029 14. Company Profiles 14.1. Robert Bosch GmbH 14.1.1. Company details 14.1.2. Business Overview 14.1.3. SWOT Analysis 14.1.4. Strategy overview 14.1.5. Key Financials 14.1.6. Key Developments 14.2. Stanley Black and Decker 14.2.1. Company details 14.2.2. Business Overview 14.2.3. SWOT Analysis 14.2.4. Strategy overview 14.2.5. Key Financials 14.2.6. Key Developments 14.3. Tenryu Saw Mfg. Co., Ltd. 14.3.1. Company details 14.3.2. Business Overview 14.3.3. SWOT Analysis 14.3.4. Strategy overview 14.3.5. Key Financials 14.3.6. Key Developments 14.4. Homag Group 14.4.1. Company details 14.4.2. Business Overview 14.4.3. SWOT Analysis 14.4.4. Strategy overview 14.4.5. Key Financials 14.4.6. Key Developments 14.5. Hilti Corporation 14.5.1. Company details 14.5.2. Business Overview 14.5.3. SWOT Analysis 14.5.4. Strategy overview 14.5.5. Key Financials 14.5.6. Key Developments 14.6. DEWALT 14.6.1. Company details 14.6.2. Business Overview 14.6.3. SWOT Analysis 14.6.4. Strategy overview 14.6.5. Key Financials 14.6.6. Key Developments 14.7. HiKOKI 14.7.1. Company details 14.7.2. Business Overview 14.7.3. SWOT Analysis 14.7.4. Strategy overview 14.7.5. Key Financials 14.7.6. Key Developments 14.8. Diablo Tools 14.8.1. Company details 14.8.2. Business Overview 14.8.3. SWOT Analysis 14.8.4. Strategy overview 14.8.5. Key Financials 14.8.6. Key Developments 14.9. Stark S.p.A. 14.9.1. Company details 14.9.2. Business Overview 14.9.3. SWOT Analysis 14.9.4. Strategy overview 14.9.5. Key Financials 14.9.6. Key Developments 14.10. August Blecher KG 14.10.1. Company details 14.10.2. Business Overview 14.10.3. SWOT Analysis 14.10.4. Strategy overview 14.10.5. Key Financials 14.10.6. Key Developments 14.11. C.M.T. Utensili SpA 14.11.1. Company details 14.11.2. Business Overview 14.11.3. SWOT Analysis 14.11.4. Strategy overview 14.11.5. Key Financials 14.11.6. Key Developments 14.12. Freud SpA 14.12.1. Company details 14.12.2. Business Overview 14.12.3. SWOT Analysis 14.12.4. Strategy overview 14.12.5. Key Financials 14.12.6. Key Developments 14.13. Karnasch Professional Tools GmbH 14.13.1. Company details 14.13.2. Business Overview 14.13.3. SWOT Analysis 14.13.4. Strategy overview 14.13.5. Key Financials 14.13.6. Key Developments 14.14. Kinkelder BV 14.14.1. Company details 14.14.2. Business Overview 14.14.3. SWOT Analysis 14.14.4. Strategy overview 14.14.5. Key Financials 14.14.6. Key Developments 14.15. PILANA Group a.s. 14.15.1. Company details 14.15.2. Business Overview 14.15.3. SWOT Analysis 14.15.4. Strategy overview 14.15.5. Key Financials 14.15.6. Key Developments 14.16. Amana Tool Corporation 14.16.1. Company details 14.16.2. Business Overview 14.16.3. SWOT Analysis 14.16.4. Strategy overview 14.16.5. Key Financials 14.16.6. Key Developments 14.17. Breton S.p.A 14.17.1. Company details 14.17.2. Business Overview 14.17.3. SWOT Analysis 14.17.4. Strategy overview 14.17.5. Key Financials 14.17.6. Key Developments 14.18. Laguna Tools 14.18.1. Company details 14.18.2. Business Overview 14.18.3. SWOT Analysis 14.18.4. Strategy overview 14.18.5. Key Financials 14.18.6. Key Developments 14.19. Dimar Group 14.19.1. Company details 14.19.2. Business Overview 14.19.3. SWOT Analysis 14.19.4. Strategy overview 14.19.5. Key Financials 14.19.6. Key Developments 15. Future Forecast 15.1. Market Forecast, By Regions 15.1.1. Global Sales Forecast, By Regions, 2022 – 2029 15.1.2. Global Revenue Forecast, By Regions, 2022 – 2029 15.2. Market Forecast, By Mode of Operation 15.2.1. Global Sales Forecast, By Mode of Operation, 2022 – 2029 15.2.2. Global Revenue Forecast, By Mode of Operation, 2022 – 2029 15.3. Market Forecast, By Blade type 15.4. Market Forecast, By Diameter type 15.5. Market Forecast, By Distribution channel 15.6. Market Forecast, By End Use industry 15.7. North America Forecast 15.8. Europe Forecast 15.9. Asia Pacific Forecast 15.10. South America Forecast 15.11. Middle East and Africa Forecast 16. Market Dynamics 16.1. Market Drivers 16.2. Market Restraint 16.3. Market Trends 16.4. Market Opportunities 16.5. Macroscopic Indicators 16.6. Forecast factors 16.7. Value Chain Analysis 17. Research and Findings and Conclusion 17.1. Demand side & Supply side trends 17.2. Analysis and Findings 18. Appendix 18.1. Research Methodology 18.2. Primary Survey Analysis 18.3. Validation of the Market Size 18.4. Assumptions and Acronyms
Don't pay for what you don't need
Customize your report by selecting specific countries or regions and save 30%!
Table 01: North America Market Size (US$ Mn) and Volume (Units) Forecast by Country, 2013 – 2028 Table 02: North America Market Value (US$ Mn) and Volume (Units) Historical Data 2014–2021 and Forecast 2022–2029 by Mode of Operation Table 03: North America Market Value (US$ Mn) and Volume (Units) Historical Data 2014–2021 and Forecast 2022–2029 by Blade Type Table 04: North America Market Value (US$ Mn) and Volume (Units) Historical Data 2014–2021 and Forecast 2022–2029 by Distribution Channel Table 05: North America Market Value (US$ Mn) and Volume (Units) Historical Data 2014–2021 and Forecast 2022–2029 by End Use Industry Table 06: Europe Market Size (US$ Mn) and Volume (Units) Forecast by Country, 2013 – 2028 Table 07: Europe Market Value (US$ Mn) and Volume (Units) Historical Data 2014–2021 and Forecast 2022–2029 by Mode of Operation Table 08: Europe Market Value (US$ Mn) and Volume (Units) Historical Data 2014–2021 and Forecast 2022–2029 by Blade Type Table 09: Europe Market Value (US$ Mn) and Volume (Units) Historical Data 2014–2021 and Forecast 2022–2029 by Distribution Channel Table 10: Europe Market Value (US$ Mn) and Volume (Units) Historical Data 2014–2021 and Forecast 2022–2029 by End Use Industry Table 11: South America Market Size (US$ Mn) and Volume (Units) Forecast by Country, 2014 – 2029 Table 12: South America Market Value (US$ Mn) and Volume (Units) Historical Data 2014–2021 and Forecast 2022–2029 by Mode of Operation Table 13: South America Market Value (US$ Mn) and Volume (Units) Historical Data 2014–2021 and Forecast 2022–2029 by Blade Type Table 14: South America Market Value (US$ Mn) and Volume (Units) Historical Data 2014–2021 and Forecast 2022–2029 by Distribution Channel Table 15: South America Market Value (US$ Mn) and Volume (Units) Historical Data 2014–2021 and Forecast 2022–2029 by End Use Industry Table 16: Asia Pacific Market Size (US$ Mn) and Volume (Units) Forecast by Country, 2013 – 2028 Table 17: Asia Pacific Market Value (US$ Mn) and Volume (Units) Historical Data 2014–2021 and Forecast 2022–2029 by Mode of Operation Table 18: Asia Pacific Market Value (US$ Mn) and Volume (Units) Historical Data 2014–2021 and Forecast 2022–2029 by Blade Type Table 19: Asia Pacific Market Value (US$ Mn) and Volume (Units) Historical Data 2014–2021 and Forecast 2022–2029 by Distribution Channel Table 20: Asia Pacific Market Value (US$ Mn) and Volume (Units) Historical Data 2014–2021 and Forecast 2022–2029 by End Use Industry Table 21: MEA Market Size (US$ Mn) and Volume (Units) Forecast by Country, 2014 – 2029 Table 22: MEA Market Value (US$ Mn) and Volume (Units) Historical Data 2014–2021 and Forecast 2022–2029 by Mode of Operation Table 23: MEA Market Value (US$ Mn) and Volume (Units) Historical Data 2014–2021 and Forecast 2022–2029 by Blade Type Table 24: MEA Market Value (US$ Mn) and Volume (Units) Historical Data 2014–2021 and Forecast 2022–2029 by Distribution Channel Table 25: MEA Market Value (US$ Mn) and Volume (Units) Historical Data 2014–2021 and Forecast 2022–2029 by End Use Industry Table 26: Global Market Size (US$ Mn) and Volume (Units) Forecast by Region, 2014 – 2029 Table 27: Global Market Size (US$ Mn) and Volume (Units) Forecast by Blade Type, 2014 – 2029 Table 28: Global Market Size (US$ Mn) and Volume (Units) Forecast by Mode of Operation, 2014 – 2029 Table 29: Global Market Size (US$ Mn) and Volume (Units) Forecast by Diameter, 2014 – 2029 Table 30: Global Market Size (US$ Mn) and Volume (Units) Forecast by Distribution Channel, 2014 – 2029
Figure 01: North America Market Share and BPS Analysis by Country 2022 & 2029 Figure 02: North America Market Y-o-Y Growth Projections by Country, 2022 – 2029 Figure 03: North America Market Attractiveness Analysis by Country, 2022 – 2029 Figure 04: North America Market Absolute $ Opportunity by the U.S., 2014 to 2022 and 2029 Figure 05: North America Market Absolute $ Opportunity by Canada, 2014 to 2022 and 2029 Figure 06: North America Market Absolute $ Opportunity by the Mexico, 2014 to 2022 and 2029 Figure 07: North America Market Share and BPS Analysis by Mode of Operation – 2022 & 2029 Figure 08: North America Market Y-o-Y Growth Projections by Mode of Operation, 2021-2029 Figure 09: North America Market Attractiveness by Mode of Operation, 2022-2029 Figure 10: North America Market Share and BPS Analysis by Blade Type– 2022 & 2029 Figure 11: North America Market Y-o-Y Growth Projections by Blade Type, 2021-2029 Figure 12: North America Market Attractiveness by Blade Type, 2022-2029 Figure 13: North America Market Share and BPS Analysis by Distribution Channel– 2022 & 2029 Figure 14: North America Market Y-o-Y Growth Projections by Distribution Channel, 2021-2029 Figure 15: North America Market Attractiveness by Distribution Channel, 2022-2029 Figure 16: North America Market Share and BPS Analysis by End Use Industry– 2022 & 2029 Figure 17: North America Market Y-o-Y Growth Projections by End Use Industry, 2021-2029 Figure 18: North America Market Attractiveness by End Use Industry, 2022-2029 Figure 19: Europe Market Share and BPS Analysis by Country 2022 & 2029 Figure 20: Europe Market Y-o-Y Growth Projections by Country, 2022 – 2029 Figure 21: Europe Market Attractiveness Analysis by Country, 2022 – 2029 Figure 22: Europe Market Absolute $ Opportunity by the Germany , 2014 to 2022 and 2029 Figure 23: Europe Market Absolute $ Opportunity by France, 2014 to 2022 and 2029 Figure 24: Europe Market Absolute $ Opportunity by the Italy, 2014 to 2022 and 2029 Figure 25: Europe Market Absolute $ Opportunity by U.K, 2014 to 2022 and 2029 Figure 26: Europe Market Absolute $ Opportunity by the Russia, 2014 to 2022 and 2029 Figure 27: Europe Market Absolute $ Opportunity by Rest of Europe, 2014 to 2022 and 2029 Figure 28: Europe Market Share and BPS Analysis by Mode of Operation – 2022 & 2029 Figure 29: Europe Market Y-o-Y Growth Projections by Mode of Operation, 2021-2029 Figure 30: Europe Market Attractiveness by Mode of Operation, 2022-2029 Figure 31: Europe Market Share and BPS Analysis by Blade Type– 2022 & 2029 Figure 32: Europe Market Y-o-Y Growth Projections by Blade Type, 2021-2029 Figure 33: Europe Market Attractiveness by Blade Type, 2022-2029 Figure 34: Europe Market Share and BPS Analysis by Distribution Channel– 2022 & 2029 Figure 35: Europe Market Y-o-Y Growth Projections by Distribution Channel, 2021-2029 Figure 36: Europe Market Attractiveness by Distribution Channel, 2022-2029 Figure 37: Europe Market Share and BPS Analysis by End Use Industry– 2022 & 2029 Figure 38: Europe Market Y-o-Y Growth Projections by End Use Industry, 2021-2029 Figure 39: Europe Market Attractiveness by End Use Industry, 2022-2029 Figure 40: South America Market Share and BPS Analysis by Country 2022 & 2029 Figure 41: South America Market Y-o-Y Growth Projections by Country, 2021 – 2029 Figure 42: South America Market Attractiveness Analysis by Country, 2022 – 2029 Figure 43: South America Market Absolute $ Opportunity by the Brazil, 2014 to 2022 and 2029 Figure 44: South America Market Absolute $ Opportunity by Rest of South America, 2014 to 2022 and 2029 Figure 45: South America Market Share and BPS Analysis by Mode of Operation – 2022 & 2029 Figure 46: South America Market Y-o-Y Growth Projections by Mode of Operation, 2021-2029 Figure 47: South America Market Attractiveness by Mode of Operation, 2022-2029 Figure 48: South America Market Share and BPS Analysis by Blade Type– 2022 & 2029 Figure 49: South America Market Y-o-Y Growth Projections by Blade Type, 2021-2029 Figure 50: South America Market Attractiveness by Blade Type, 2022-2029 Figure 51: South America Market Share and BPS Analysis by Distribution Channel– 2022 & 2029 Figure 52: South America Market Y-o-Y Growth Projections by Distribution Channel, 2021-2029 Figure 53: South America Market Attractiveness by Distribution Channel, 2022-2029 Figure 54: South America Market Share and BPS Analysis by End Use Industry– 2022 & 2029 Figure 55: South America Market Y-o-Y Growth Projections by End Use Industry, 2021-2029 Figure 56: South America Market Attractiveness by End Use Industry, 2022-2029 Figure 57: Asia Pacific Market Share and BPS Analysis by Country 2022 & 2029 Figure 58: Asia Pacific Market Y-o-Y Growth Projections by Country, 2022 – 2029 Figure 59: Asia Pacific Market Attractiveness Analysis by Country, 2022 – 2029 Figure 60: Asia Pacific Market Absolute $ Opportunity by China , 2014 to 2022 and 2029 Figure 61: Asia Pacific Market Absolute $ Opportunity by Japan, 2014 to 2022 and 2029 Figure 62: Asia Pacific Market Absolute $ Opportunity by India, 2014 to 2022 and 2029 Figure 63: Asia Pacific Market Absolute $ Opportunity by South Korea, 2014 to 2022 and 2029 Figure 64: Asia Pacific Market Absolute $ Opportunity by ASEAN, 2014 to 2022 and 2029 Figure 65: Asia Pacific Market Absolute $ Opportunity by Oceania, 2014 to 2022 and 2029 Figure 66: Rest of Asia Pacific Market Absolute $ Opportunity by Rest of Asia Pacific, 2014 to 2022 and 2029 Figure 67: Asia Pacific Market Share and BPS Analysis by Mode of Operation – 2022 & 2029 Figure 68: Asia Pacific Market Y-o-Y Growth Projections by Mode of Operation, 2021-2029 Figure 69: Asia Pacific Market Attractiveness by Mode of Operation, 2022-2029 Figure 70: Asia Pacific Market Share and BPS Analysis by Blade Type– 2022 & 2029 Figure 71: Asia Pacific Market Y-o-Y Growth Projections by Blade Type, 2021-2029 Figure 72: Asia Pacific Market Attractiveness by Blade Type, 2022-2029 Figure 73: Asia Pacific Market Share and BPS Analysis by Distribution Channel– 2022 & 2029 Figure 74: Asia Pacific Market Y-o-Y Growth Projections by Distribution Channel, 2021-2029 Figure 75: Asia Pacific Market Attractiveness by Distribution Channel, 2022-2029 Figure 76: Asia Pacific Market Share and BPS Analysis by End Use Industry– 2022 & 2029 Figure 77: Asia Pacific Market Y-o-Y Growth Projections by End Use Industry, 2021-2029 Figure 78: Asia Pacific Market Attractiveness by End Use Industry, 2022-2029 Figure 79: MEA Market Share and BPS Analysis by Country 2022 & 2029 Figure 80: MEA Market Y-o-Y Growth Projections by Country, 2021 – 2029 Figure 81: MEA Market Attractiveness Analysis by Country, 2022 – 2029 Figure 82: MEA Market Absolute $ Opportunity by the GCC Countries , 2014 to 2022 and 2029 Figure 83: MEA Market Absolute $ Opportunity by Turkey, 2014 to 2022 and 2029 Figure 84: MEA Market Absolute $ Opportunity by the Egypt, 2014 to 2022 and 2029 Figure 85: MEA Market Absolute $ Opportunity by South Africa, 2014 to 2022 and 2029 Figure 86: MEA Market Absolute $ Opportunity by the Rest of MEA, 2014 to 2022 and 2029 Figure 87: MEA Market Share and BPS Analysis by Mode of Operation – 2022 & 2029 Figure 88: MEA Market Y-o-Y Growth Projections by Mode of Operation, 2021-2029 Figure 89: MEA Market Attractiveness by Mode of Operation, 2022-2029 Figure 90: MEA Market Share and BPS Analysis by Blade Type– 2022 & 2029 Figure 91: MEA Market Y-o-Y Growth Projections by Blade Type, 2021-2029 Figure 92: MEA Market Attractiveness by Blade Type, 2022-2029 Figure 93: MEA Market Share and BPS Analysis by Distribution Channel– 2022 & 2029 Figure 94: MEA Market Y-o-Y Growth Projections by Distribution Channel, 2021-2029 Figure 95: MEA Market Attractiveness by Distribution Channel, 2022-2029 Figure 96: MEA Market Share and BPS Analysis by End Use Industry– 2022 & 2029 Figure 97: MEA Market Y-o-Y Growth Projections by End Use Industry, 2021-2029 Figure 98: MEA Market Attractiveness by End Use Industry, 2022-2029 Figure 99: Global Market Share and BPS Analysis by Country 2022 & 2029 Figure 100: Global America Market Y-o-Y Growth Projections by Country, 2022 – 2029 Figure 101: Global Market Attractiveness Analysis by Country, 2022 – 2029 Figure 102: Global Market Share and BPS Analysis by Blade Type– 2022 & 2029 Figure 103: Global Market Y-o-Y Growth Projections by Blade Type, 2021-2029 Figure 104: Global Market Attractiveness by Blade Type, 2022-2029 Figure 105: Global Market Share and BPS Analysis by Mode of Operation – 2022 & 2029 Figure 106: Global Market Y-o-Y Growth Projections by Mode of Operation, 2021-2029 Figure 107: Global Market Attractiveness by Mode of Operation, 2022-2029 Figure 108: Global Market Share and BPS Analysis by End Use Industry– 2022 & 2029 Figure 109: Global Market Y-o-Y Growth Projections by End Use Industry, 2021-2029 Figure 110: Global Market Attractiveness by End Use Industry, 2022-2029 Figure 111: Global Market Share and BPS Analysis by Distribution Channel– 2022 & 2029 Figure 112: Global Market Y-o-Y Growth Projections by Distribution Channel, 2021-2029 Figure 113: Global Market Attractiveness by Distribution Channel, 2022-2029 Figure 114: Global Absolute $ Opportunity by North America, 2014 to 2022 and 2029 Figure 115: Global Absolute $ Opportunity by South America, 2014 to 2022 and 2029 Figure 116: Global Absolute $ Opportunity by Europe, 2014 to 2022 and 2029 Figure 117: Global Absolute $ Opportunity by Asia Pacific a, 2014 to 2022 and 2029 Figure 118: Global Absolute $ Opportunity by Middle East & Africa, 2014 to 2022 and 2029 Figure 119: Global Machine Tools Production Overview in 2021 Figure 120: Global Machine Tools Consumption Outlook in 2020 Figure 121: Global Nominal GDP Outlook in 2020 Figure 122: Global Machine Tools Production, 2013-2021
Recommendations
Explore Industrial Automation Insights
View Reports