The SAW filter market is likely to grow from USD 6.2 billion in 2025 to USD 15.23 billion by 2035, representing substantial growth, demonstrating the accelerating adoption of advanced filtering technology and frequency management optimization across telecommunications infrastructure, consumer electronics, and automotive sectors.
The first half of the decade (2025-2030) will see the market increase from USD 6.2 billion to approximately USD 9.8 billion, adding USD 3.6 billion in value, which constitutes 40% of the total forecasted growth period. This phase will be characterized by the rapid adoption of RF SAW filter systems, driven by increasing 5G deployment volumes and the growing need for advanced frequency filtering solutions worldwide. Enhanced miniaturization capabilities and automated performance systems will become standard expectations rather than premium options.
The latter half (2030-2035) will witness continued growth from USD 9.8 billion to USD 15.23 billion, representing an addition of USD 5.4 billion or 60% of the decade's expansion. This period will be defined by mass market penetration of temperature-compensated SAW technologies, integration with comprehensive IoT platforms, and seamless compatibility with existing wireless infrastructure. As per Future Market Insights, celebrated with Stevie honors for innovative research practices, the market trajectory signals fundamental shifts in how telecommunications facilities approach frequency management optimization and signal integrity, with participants positioned to benefit from growing demand across multiple bandwidth ranges and frequency segments.
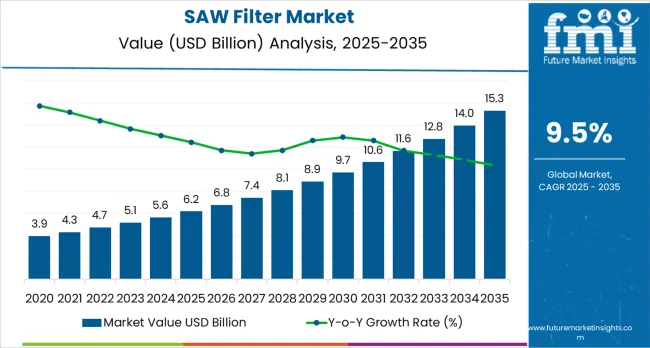
The SAW filter market exhibits distinct growth phases, characterized by varying market characteristics and competitive dynamics. Between 2025 and 2030, the market progresses through its technology adoption phase, expanding from USD 6.2 billion to USD 9.8 billion with steady annual increments averaging 9.5% growth. This period marks the transition from basic filter equipment to advanced RF SAW systems, featuring enhanced bandwidth capabilities and integrated signal processing, which become mainstream features.
The 2025-2030 phase adds USD 3.6 billion to market value, representing 40% of total decade expansion. Market maturation factors include the standardization of frequency protocols, declining component costs for specialized equipment, and increasing awareness of filter benefits in the telecommunications industry, which is reaching 90-95% operational effectiveness in signal processing applications. The competitive landscape during this period features established semiconductor companies, such as Murata Manufacturing and Qorvo, expanding their filter portfolios, while specialty manufacturers focus on developing advanced technologies and enhancing frequency capabilities.
From 2030 to 2035, market dynamics shift toward advanced miniaturization integration and global telecommunications expansion, with growth continuing from USD 9.8 billion to USD 15.23 billion, representing an addition of USD 5.4 billion, or 60% of the total expansion. This phase transition centers on temperature-compensated SAW systems, integration with automated communication networks, and deployment across diverse consumer and industrial scenarios, becoming standard rather than specialized applications. The competitive environment matures, with a focus shifting from basic frequency filtering capabilities to comprehensive signal optimization systems and integration with IoT monitoring platforms.
| Metric | Value |
|---|---|
| Market Value (2025) | USD 6.2 billion |
| Market Forecast (2035) | USD 15.23 billion |
| Growth Rate | 9.5% CAGR |
| Leading Technology | RF SAW Filters Type |
| Primary Application | Telecommunications Segment |
The market demonstrates strong fundamentals with RF SAW filter systems capturing a dominant share through advanced frequency filtering capabilities and telecommunications optimization. Telecommunications applications drive primary demand, supported by the increasing development of 5G infrastructure and consumer electronics requirements. Geographic expansion remains concentrated in developed markets with established telecommunications infrastructure, while emerging economies show accelerating adoption rates driven by digitalization initiatives and rising connectivity standards.
Market expansion rests on three fundamental shifts driving adoption across the telecommunications and electronics sectors. 1. 5G deployment creates compelling operational advantages through SAW filters that provide immediate frequency management efficiency without signal degradation, enabling telecommunications facilities to meet performance standards while maintaining network reliability and reducing interference issues. 2. Consumer electronics modernization accelerates as facilities worldwide seek advanced systems that complement traditional filtering methods, enabling precise frequency control and signal management that align with industry regulations and operational efficiency standards. 3. IoT connectivity enhancement drives adoption from telecommunications facilities and electronics manufacturers requiring effective frequency filtering solutions that minimize signal loss while maintaining operational performance during wireless communication operations.
However, growth faces headwinds from component cost challenges that vary across semiconductor suppliers regarding the pricing of specialized filter equipment and frequency management systems, which may limit adoption in budget-sensitive consumer electronics environments. Technical limitations also persist regarding filter capabilities and operational conditions that may reduce effectiveness in extreme frequency ranges or challenging electromagnetic environments, which affect filter performance and signal consistency.
The SAW filter market represents a specialized yet critical opportunity driven by the expansion of 5G infrastructure, telecommunications modernization, and the adoption of IoT and automotive connectivity platforms. The market will expand from USD 6.2 billion in 2025 to USD 15.23 billion by 2035, adding USD 9.1 billion in new value. Growth opportunities are concentrated around advanced RF filters, miniaturization, bandwidth optimization, and smart integration capabilities.
Primary Classification: The market segments by type into RF SAW filters and IF SAW filters, representing the evolution from basic signal processing equipment to specialized frequency solutions for comprehensive telecommunications optimization.
Secondary Classification: Bandwidth segmentation divides the market into 2kHz to 50kHz, 100kHz to 2MHz, and 5MHz to 100MHz sectors, reflecting distinct requirements for operational performance, frequency compliance, and system efficiency standards.
Tertiary Classification: Frequency range segmentation covers 10 MHz to 50 MHz, 50 MHz to 1 GHz, and 1 GHz and above, while industry vertical applications span consumer electronics, automotive, aerospace &defense, telecommunications, and others.
Regional Classification: Geographic distribution covers North America, Latin America, Western Europe, Eastern Europe, East Asia, South Asia Pacific, and Middle East &Africa, with developed markets leading adoption while emerging economies show accelerating growth patterns driven by telecommunications expansion programs.
The segmentation structure reveals technology progression from standard filter equipment toward specialized frequency systems with enhanced signal processing and automation capabilities, while application diversity spans from consumer electronics to telecommunications infrastructure requiring precise frequency management solutions.
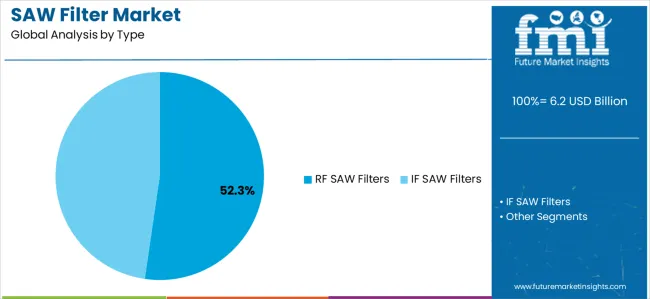
Market Position: RF SAW filter systems command the leading position in the SAW filter market with 52.3% market share through advanced frequency features, including superior bandwidth capability, operational flexibility, and telecommunications optimization that enable wireless facilities to achieve optimal signal processing across diverse consumer and industrial environments.
Value Drivers: The segment benefits from telecommunications facility preference for reliable frequency systems that provide consistent filtering performance, reduced signal loss, and operational efficiency optimization without requiring significant infrastructure modifications. Advanced design features enable automated signal processing, frequency consistency, and integration with existing wireless equipment, where operational performance and signal reliability represent critical facility requirements.
Competitive Advantages: RF SAW filter systems differentiate through proven operational stability, consistent frequency characteristics, and integration with automated telecommunications systems that enhance facility effectiveness while maintaining optimal signal standards suitable for diverse wireless and consumer applications.
Key market characteristics:
IF SAW filter systems maintain a 47.7% market position in the SAW filter market due to their specialized frequency properties and operational advantages. These systems appeal to facilities requiring specific filtering characteristics with competitive pricing for radar and satellite communication applications. Market growth is driven by aerospace expansion, emphasizing reliable frequency solutions and operational efficiency through optimized system designs.
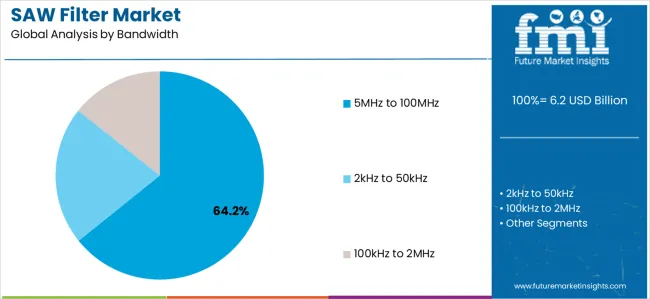
Market Context: 5MHz to 100MHz bandwidth demonstrates the highest market share with 64.2% due to widespread adoption of high-frequency systems and increasing focus on 5G telecommunications optimization, operational performance enhancement, and wireless infrastructure applications that maximize signal efficiency while maintaining communications standards.
Appeal Factors: 5MHz to 100MHz bandwidth operators prioritize system reliability, frequency optimization, and integration with existing telecommunications infrastructure that enables coordinated signal processing across multiple wireless operations. The segment benefits from substantial 5G investment and modernization programs that emphasize the acquisition of high-bandwidth systems for performance enhancement and telecommunications efficiency applications.
Growth Drivers: 5G deployment programs incorporate high-bandwidth filters as standard equipment for telecommunications operations, while wireless facility growth increases demand for advanced frequency capabilities that comply with performance standards and minimize operational complexity.
Market Challenges: Varying frequency technology standards and bandwidth infrastructure differences may limit system standardization across different facilities or operational scenarios.
Application dynamics include:
2kHz to 50kHz applications capture 35.8% market share through specialized frequency requirements in industrial sensor facilities, medical device operations, and precision audio applications. These facilities demand low-frequency systems capable of operating in sensitive environments while providing effective signal processing and operational reliability capabilities.
Market Position: Telecommunications applications lead the market representing the largest industry vertical segment due to extensive 5G infrastructure development and signal processing requirements.
Growth Drivers: Telecommunications sector expansion, network modernization projects, and performance optimization enforcement drive consistent demand for frequency filtering solutions across wireless infrastructure, base station, and network equipment projects.
Application Scope: Telecommunications applications span 5G deployment, wireless infrastructure, network optimization, and system upgrade projects requiring diverse frequency filtering capabilities and signal processing features.
Growth Accelerators: 5G infrastructure development drives primary adoption as SAW filters provide frequency management efficiency capabilities that enable telecommunications facilities to meet signal standards without excessive processing delays, supporting wireless operations and connectivity missions that require precise frequency filtering applications. Consumer electronics demand accelerates market expansion as facilities seek effective systems that minimize signal interference while maintaining operational effectiveness during wireless communication and processing scenarios. Telecommunications technology spending increases worldwide, creating continued demand for filter systems that complement traditional communication methods and provide operational flexibility in complex wireless environments.
Growth Inhibitors: Component cost challenges vary across semiconductor suppliers regarding the pricing of specialized filter systems and frequency management equipment, which may limit operational flexibility and market penetration in regions with budget constraints or cost-sensitive electronics operations. Technical performance limitations persist regarding filter capabilities and operational conditions that may reduce effectiveness in extreme frequency ranges, electromagnetic interference, or facility environment conditions, affecting filter performance and signal consistency. Market fragmentation across multiple telecommunications specifications and frequency standards creates compatibility concerns between different equipment suppliers and existing wireless infrastructure.
Market Evolution Patterns: Adoption accelerates in telecommunications and consumer electronics sectors where performance requirements justify filter system costs, with geographic concentration in developed markets transitioning toward mainstream adoption in emerging economies driven by digitalization initiatives and connectivity development. Technology development focuses on enhanced filter capabilities, improved frequency efficiency, and integration with automated monitoring systems that optimize signal processing and telecommunications effectiveness. The market could face disruption if alternative frequency filtering technologies or communication standards significantly limit the deployment of traditional filter equipment in wireless or telecommunications applications.
The SAW filter market demonstrates varied regional dynamics with Growth Leaders including India (11.2% growth rate) and China (10.4% growth rate) driving expansion through telecommunications initiatives and 5G development. Steady Performers encompass United States (8.6% growth rate), United Kingdom (8.2% growth rate), and developed regions, benefiting from established wireless industries and advanced filter adoption. Emerging Markets feature France (7.9% growth rate) and developing regions, where telecommunications initiatives and technology modernization support consistent growth patterns.
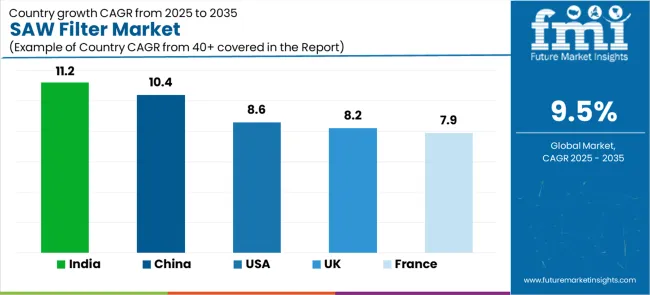
| Country | Growth Rate (2025-2035) |
|---|---|
| India | 11.2% |
| China | 10.4% |
| United States | 8.6% |
| United Kingdom | 8.2% |
| France | 7.9% |
Regional synthesis reveals East Asian markets leading adoption through telecommunications expansion and 5G development, while North American countries maintain steady expansion supported by wireless technology advancement and performance standardization requirements. European markets show moderate growth driven by telecommunications applications and signal processing integration trends.
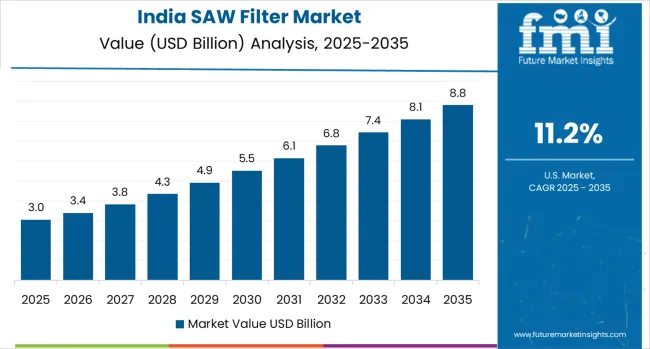
India establishes fastest market growth through aggressive telecommunications programs and comprehensive 5G development, integrating advanced SAW filters as standard components in wireless infrastructure and consumer electronics installations. The country's 11.2% growth rate reflects government initiatives promoting telecommunications technology and domestic manufacturing capabilities that mandate the use of advanced filter systems in wireless and consumer facilities. Growth concentrates in major metropolitan centers, including Mumbai, Delhi, and Bangalore, where telecommunications technology development showcases integrated filter systems that appeal to wireless operators seeking advanced facility optimization capabilities and signal management applications.
Indian manufacturers are developing cost-effective filter solutions that combine domestic production advantages with advanced operational features, including automated signal processing and enhanced frequency capabilities. Distribution channels through telecommunications suppliers and electronics distributors expand market access, while government support for digital infrastructure development supports adoption across diverse wireless and consumer segments.
Strategic Market Indicators:
In Beijing, Shanghai, and Guangzhou, telecommunications facilities and electronics manufacturers are implementing advanced SAW filters as standard equipment for frequency management optimization and signal processing applications, driven by increasing government 5G investment and telecommunications modernization programs that emphasize the importance of filtering capabilities. The market holds a 10.4% growth rate, supported by government wireless initiatives and consumer electronics development programs that promote advanced filter systems for telecommunications and manufacturing facilities. Chinese operators are adopting filter systems that provide consistent operational performance and frequency processing features, particularly appealing in urban regions where signal efficiency and performance standards represent critical operational requirements.
Market expansion benefits from growing telecommunications technology manufacturing capabilities and international technology transfer agreements that enable domestic production of advanced filter systems for wireless and consumer applications. Technology adoption follows patterns established in semiconductor equipment, where reliability and performance drive procurement decisions and operational deployment.
Market Intelligence Brief:
United States establishes market leadership through comprehensive wireless programs and advanced telecommunications infrastructure development, integrating SAW filters across consumer electronics and telecommunications applications. The country's 8.6% growth rate reflects established wireless industry relationships and mature filter technology adoption that supports widespread use of frequency management systems in telecommunications and defense facilities. Growth concentrates in major technology centers, including California, Texas, and New York, where telecommunications technology showcases mature filter deployment that appeals to wireless operators seeking proven frequency processing capabilities and operational efficiency applications.
American filter providers leverage established distribution networks and comprehensive service capabilities, including technical support programs and performance optimization that create customer relationships and operational advantages. The market benefits from mature frequency regulations and telecommunications standards that mandate filter use while supporting technology advancement and operational optimization.
Market Intelligence Brief:
United Kingdom's advanced telecommunications technology market demonstrates sophisticated SAW filter deployment with documented operational effectiveness in wireless applications and consumer electronics through integration with existing 5G systems and telecommunications infrastructure. The country leverages engineering expertise in wireless technology and signal processing integration to maintain an 8.2% growth rate. Technology centers, including London, Manchester, and Edinburgh, showcase premium installations where filter systems integrate with comprehensive telecommunications platforms and network management systems to optimize frequency processing operations and signal effectiveness.
British manufacturers prioritize system reliability and performance compliance in filter equipment development, creating demand for premium systems with advanced features, including network monitoring integration and automated signal processing. The market benefits from established telecommunications technology infrastructure and a willingness to invest in advanced filtering technologies that provide long-term operational benefits and compliance with international wireless standards.
Market Intelligence Brief:
France's market expansion benefits from diverse telecommunications demand, including 5G infrastructure modernization in Paris and Lyon, consumer electronics facility upgrades, and government technology programs that increasingly incorporate filter solutions for signal optimization applications. The country maintains a 7.9% growth rate, driven by rising wireless activity and increasing recognition of filter technology benefits, including precise frequency control and reduced signal interference.
Market dynamics focus on cost-effective filter solutions that balance advanced operational performance with affordability considerations important to French telecommunications operators. Growing electronics industrialization creates continued demand for modern filter systems in new facility infrastructure and telecommunications modernization projects.
Strategic Market Considerations:
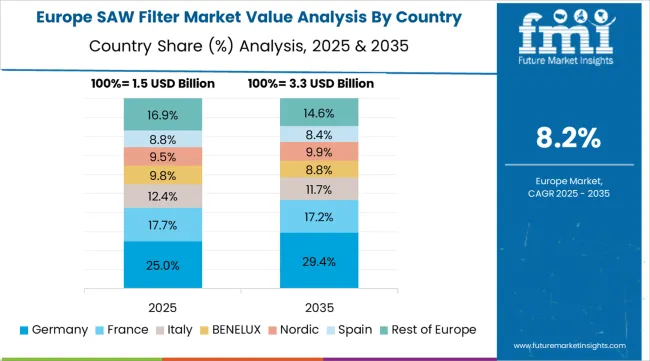
The European SAW filter market is projected to grow from USD 1.8 billion in 2025 to USD 4.2 billion by 2035, registering a CAGR of 8.9% over the forecast period. Germany is expected to maintain its leadership position with a 26.4% market share in 2025, supported by its advanced telecommunications technology infrastructure and major industrial centers.
United Kingdom follows with a 20.8% share in 2025, driven by comprehensive 5G programs and wireless technology development initiatives. France holds a 17.3% share through specialized telecommunications applications and frequency optimization requirements. Italy commands a 13.9% share, while Spain accounts for 10.2% in 2025. Poland maintains an 8.1% share, while Russia accounts for 3.3% of the European market in 2025. The Rest of Europe region is anticipated to gain momentum, expanding its collective share from 7.5% to 8.2% by 2035, attributed to increasing telecommunications adoption in Nordic countries and emerging wireless facilities implementing technology modernization programs.
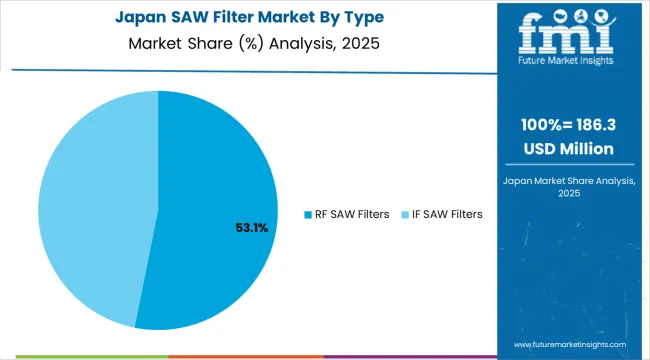
In Japan, the SAW filter market prioritizes RF SAW filter systems, which capture the dominant share of telecommunications and consumer electronics installations due to their advanced features, including precision frequency management optimization and seamless integration with existing wireless infrastructure. Japanese facility operators emphasize reliability, precision, and long-term operational excellence, creating demand for RF SAW filter systems that provide consistent frequency processing capabilities and adaptive operational performance based on telecommunications requirements and signal conditions. Other filter types maintain secondary positions primarily in specialized applications and industrial facilities where comprehensive frequency filtering functionality meets operational requirements without compromising telecommunications efficiency.
Market Characteristics:
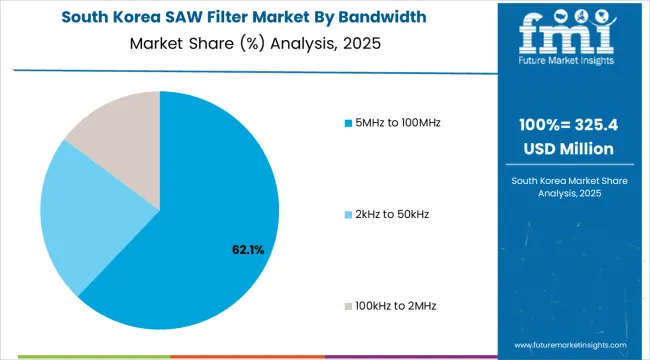
In South Korea, the market structure favors international semiconductor companies, including Murata Manufacturing, Samsung, and SK Hynix, which maintain dominant positions through comprehensive product portfolios and established electronics networks supporting both filter integration and device installations. These providers offer integrated solutions combining advanced filter systems with professional manufacturing services and ongoing technical support that appeal to Korean electronics operators seeking reliable frequency management systems. Local electronics contractors and technology integrators capture a moderate market share by providing localized service capabilities and competitive pricing for consumer electronics installations, while domestic manufacturers focus on specialized applications and cost-effective solutions tailored to Korean electronics characteristics.
Channel Insights:
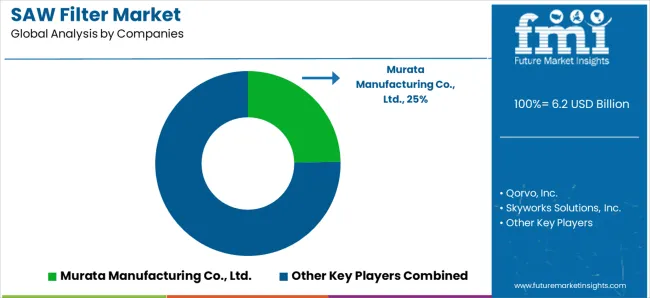
The SAW filter market operates with moderate concentration, featuring approximately 15-20 meaningful participants, where leading companies control roughly 65-70% of the global market share through established telecommunications industry relationships and comprehensive filter portfolios. Competition emphasizes advanced frequency processing capabilities, system reliability, and wireless integration rather than price-based rivalry.
Market Leaders encompass Murata Manufacturing Co., Ltd., Qorvo, Inc., and Skyworks Solutions, Inc., which maintain competitive advantages through extensive semiconductor technology expertise, global telecommunications contractor networks, and comprehensive system integration capabilities that create customer switching costs and support premium pricing. These companies leverage decades of filter technology experience and ongoing research investments to develop advanced frequency management systems with precision operational control and signal monitoring features.
Technology Innovators include TDK Corporation, TAIYO YUDEN Co., Ltd., and WISOL, which compete through specialized filter technology focus and innovative operational interfaces that appeal to telecommunications operators seeking advanced frequency processing capabilities and operational flexibility. These companies differentiate through rapid technology development cycles and specialized wireless application focus.
Regional Specialists feature companies like Kyocera Corporation, TST, and SHOULDER Electronics Limited, which focus on specific geographic markets and specialized applications, including temperature-compensated systems and integrated telecommunications solutions. Market dynamics favor participants that combine reliable filter capabilities with advanced operational software, including precision frequency management control and automatic performance optimization capabilities. Competitive pressure intensifies as traditional semiconductor contractors expand into filter systems, while specialized telecommunications companies challenge established players through innovative filter solutions and cost-effective systems targeting specialized wireless segments.
| Item | Value |
|---|---|
| Quantitative Units | USD 6.2 billion |
| Type | RF SAW Filters, IF SAW Filters |
| Bandwidth | 2kHz to 50kHz, 100kHz to 2MHz, 5MHz to 100MHz |
| Frequency Range | 10 MHz to 50 MHz, 50 MHz to 1 GHz, 1 GHz and above |
| Industry Vertical | Consumer Electronics, Automotive, Aerospace &Defense, Telecommunications, Others |
| Regions Covered | North America, Latin America, Western Europe, Eastern Europe, East Asia, South Asia Pacific, Middle East &Africa |
| Countries Covered | United States, China, Germany, India, United Kingdom, Japan, Canada, Brazil, France, Australia, and 25+ additional countries |
| Key Companies Profiled | Murata Manufacturing Co., Ltd., Qorvo, Inc., Skyworks Solutions, Inc., TDK Corporation, TAIYO YUDEN Co., Ltd., WISOL, Kyocera Corporation, TST, SHOULDER Electronics Limited |
| Additional Attributes | Dollar sales by type and bandwidth categories, regional adoption trends across East Asia, North America, and South Asia Pacific, competitive landscape with semiconductor manufacturers and telecommunications suppliers, wireless operator preferences for precision frequency management control and system reliability. |
The global saw filter market is estimated to be valued at USD 6.2 billion in 2025.
The market size for the saw filter market is projected to reach USD 15.3 billion by 2035.
The saw filter market is expected to grow at a 9.5% CAGR between 2025 and 2035.
The key product types in saw filter market are rf saw filters and if saw filters.
In terms of bandwidth, 5mhz to 100mhz segment to command 64.2% share in the saw filter market in 2025.


Full Research Suite comprises of:
Market outlook & trends analysis
Interviews & case studies
Strategic recommendations
Vendor profiles & capabilities analysis
5-year forecasts
8 regions and 60+ country-level data splits
Market segment data splits
12 months of continuous data updates
DELIVERED AS:
PDF EXCEL ONLINE
TC-SAW Filter Market
Saw Blades Market Size, Share, and Forecast 2025 to 2035
Sawing and Cutting Tools Market Growth, Trends and Forecast from 2025 to 2035
Saw Palmetto Market Analysis by Powder, Whole and others Forms Through 2035
Hacksaw Blades Market Size and Share Forecast Outlook 2025 to 2035
Bandsaw Machines Market Growth - Trends & Forecast 2025 to 2035
Tile Saws Market Size and Share Forecast Outlook 2025 to 2035
Panel Saw Market Size and Share Forecast Outlook 2025 to 2035
Miter Saw Market Trend Analysis Based on Product, Mobility, Power Capacity, End-Use, Sales Channel, and Region 2025 to 2035
Circular Saw Blade Market Forecast and Outlook 2025 to 2035
Concrete Saw Market Growth - Trends & Forecast 2025 to 2035
D-Handle Jigsaw Market Size and Share Forecast Outlook 2025 to 2035
Diamond Wall Saw Market Size and Share Forecast Outlook 2025 to 2035
Orbital Recip Saw Market Size and Share Forecast Outlook 2025 to 2035
Electric Meat Saw Market Size and Share Forecast Outlook 2025 to 2035
Portable Band Saws Market Size and Share Forecast Outlook 2025 to 2035
Stone Cutting Saw Blades Market Analysis & Forecast by Blade Type, Blade Diameter, End User, and Region Forecast Through 2035
Concrete Chain Saw Market Size and Share Forecast Outlook 2025 to 2035
Stationary Band Saws Market Size and Share Forecast Outlook 2025 to 2035
Mining Pneumatic Saw Market Size and Share Forecast Outlook 2025 to 2035

Thank you!
You will receive an email from our Business Development Manager. Please be sure to check your SPAM/JUNK folder too.
Chat With
MaRIA