Reports

- Global Locations -

Headquarters

Future Market Insights, Inc.

Christiana Corporate, 200
Continental Drive, Suite 401,
Newark, Delaware - 19713,
United States

T: +1-845-579-5705

Americas

Future Market Insights, Inc.

616 Corporate Way, Suite 2-9018,
Valley Cottage, NY 10989, United States

T: +1-347-918-3531

MEA

Future Market Insights

1602-6 Jumeirah Bay X2 Tower, Plot No: JLT-PH2-X2A,
Jumeirah Lakes Towers, Dubai,
United Arab Emirates

Europe

Future Market Insights

3rd Floor, 207 Regent Street,
W1B 3HH London
United Kingdom

T: + 44 (0) 20 8123 9659
D: +44 (0) 20 3287 4268

Asia Pacific

Future Market Insights

IndiaLand Global Tech Park, Unit UG-1, Behind Grand HighStreet, Phase 1, Hinjawadi, MH, Pune – 411057, India

Global Panel Saw Market Outlook for 2024 to 2034

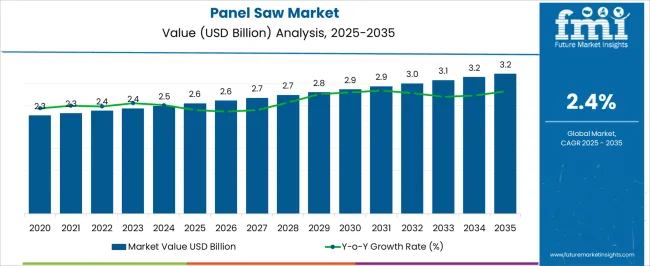
The panel saw market is estimated to be valued at US$ 2,488.2 million in 2024. The demand for panel saw is predicted to rise at a CAGR of 2.5% from 2024 to 2034. The global panel saw market is anticipated to reach US$ 3,247.8 million by 2034.

Panel Saw Market Trends

  • The Internet of Things and the integration of smart wood-cutting software have caused a greater attraction to CNC panel saws.
  • The demand for specialized sliding table saws for accurate cuts is expected to boom as woodcraft industries develop and thrive.
  • Wood panel cutting tools provide the ability for precise cutting, which helps the woodworking sector reduce wastage.
Report Attribute Details
Panel Saw Market Size (2024) US$ 2,488.2 million
Anticipated Market Value (2034) US$ 3,247.8 million
Market Projected Growth Rate (2024 to 2034) 2.5%

Don't pay for what you don't need

Customize your report by selecting specific countries or regions and save 30%!

Global Panel Saw Market Analysis During Historical Period Compared to Forecast Outlook

Sales of panel saws generated a revenue of around US$ 2,180.4 million in 2019. During the period from 2019 to 2023, the global demand for panel saws registered a CAGR of 2.7%. In 2023, the overall market was valued at around US$ 2,425.6 million.

Attributes Details
Panel Saw Market Size (2019) US$ 2,180.4 million
Historical Market Size (2023) US$ 2,425.6 million
Historical CAGR (2019 to 2023) 2.7%

Factors Driving the Growth of the Panel Saw Market

Carpentry industries across all economies are putting more focus on productivity and efficiency in their manufacturing processes to maximize the margin of profit. Moreover, furniture-making companies prefer multi-blade panel saws to optimize industrial processes, shorten production times, and boost overall efficiency.

Demand for industrial panel saws is rising to meet the need for precision and excellent quality, incorporating features like laser-guided cutting and computerized measurement systems. Computerized panel saws have also become necessary for high-end woodworking, such as creating personalized furniture, architectural wood carvings, and other woodcraft works.

The adoption of automated panel saws has also been triggered by the woodworking industry's use of IoT technologies and smart manufacturing solutions to some extent. Woodworking panel saws with remote monitoring capabilities can also provide predictive maintenance and real-time data analytics, which improves their usability and attracts tech-savvy enterprises.

Nikhil Kaitwade
Nikhil Kaitwade

Principal Consultant

Talk to Analyst

Find your sweet spots for generating winning opportunities in this market.

Comparative View of Adjacent Panel Saw Market

A comparison of market projections for the saw blade market and the woodworking circular saw blade market with that of the panel saw market reveals many important trends. Advancements in the saw blade market reflect a positive outcome for panel saw industries with the growing popularity of circular saws.

Panel Saw Market:

Attributes Panel Saw Market
CAGR (2024 to 2034) 2.5%
Growth Factor The rise in demand for fine woodworking products and furniture calls for more use of electric panel saws for precise cutting.
Market Opportunities Renewed attention to the environmentally responsible industrial sector is expected to drive the demand for efficient wood-cutting tools globally.
Market Challenges The higher cost of installation and maintenance of precision sliding panel saws limits their adoption in small-scale woodworking industries.

Saw Blade Market:

Attributes Saw Blade Market
CAGR (2024 to 2034) 4.7%
Growth Factor Ever-expanding lumbering industry has increased demand for wooden furniture and construction works.
Market Opportunities Introducing novel metals and alloys as well as improving blade designs to reduce energy consumption and wastage production.
Market Challenges Rising environmental concerns and stringent regulations discourage the felling of trees using speedy cutting machines.

Woodworking Circular Saw Blade Market:

Attributes Woodworking Circular Saw Blade Market
CAGR (2024 to 2034) 4.4%
Growth Factor Growing application scope of circular saw blades in several industry verticals, such as automotive, building & construction, and others.
Market Opportunities The rising popularity of do-it-yourself projects is expected to increase the demand for innovative and intricate woodworking tools.
Market Challenges Workers need higher skills to operate circular saw blades in comparison to linear saw blades for woodworking.

Country-wise Insights

The table below represents the expected growth rates of the panel saw market in the United States, the United Kingdom, China, and India. Asian countries are expected to rally ahead in terms of growth in year-over-year sales, while Western countries are observed to be leading in sales value.

Countries CAGR (2024 to 2034)
United States 2.1%
China 3%
United Kingdom 2.1%
India 3.2%

Panel Software Innovations to Drive in the United States Market

The leading position of the United States is mostly attributed to the presence of giant market players. Sale of panel saws are expected to rise at a 2.1% CAGR through 2034.

The panel saw market in the United States has been largely impacted by the growing use of Industry 4.0, or automation using intelligent machines. Also, the presence of software developers in the country is driving the market, leading to the adoption of advanced cutting-edge panel saw software solutions.

The United Kingdom is Leading the European Panel Saw Market

The United Kingdom is expected to be a forerunner in Europe for advancements of its panel saw machine manufacturing industries. The market is expected to record a CAGR of 2.1% through 2034.

As the industrial sector is becoming more conscious of sustainability, efficient engineering technologies are being implemented more frequently in most European countries. So, the export of wood and plywood cutting machines all over Europe is anticipated to strengthen the United Kingdom panel saw industry demand.

Growing Demand for Semi-automatic Panel Saws in China

With an extensive manufacturing base for heavy industrial equipment, China is expected to increase its panel saw production at a CAGR of 3% till 2034.

A growing trend toward ready-to-assemble furniture, driven by urbanization and changing customer lifestyles, has surged the demand for laminated board saws in the country. Also, the rising demand for semi-automatic panel saws from neighboring Asian nations could expand and diversify the regional market further.

Evolving Dynamics of the Panel Saw Industry with Government’s Support in India

The market for panel saws in India is predicted to grow at a CAGR of 3.2% through 2034.

The Indian government is taking several initiatives stressing the use of efficient production methods to boost its small and medium-scale enterprises, including the carpentry industry. In addition, the rapidly expanding heavy equipment manufacturing industries in the country are anticipated to boost the supply of automated CNC panel saws for productivity.

Get the data you need at a Fraction of the cost

Personalize your report by choosing insights you need
and save 40%!

Category-wise Insights

Higher Preference for Horizontal Panel Saws by Carpenters

The demand for horizontal panel saws held 27% of the overall market share in 2023, making it the leading segment by product type.

Attributes Details
Top Product Type Horizontal Panel Saw
Market Share in 2023 27%

Traditionally, carpenters adopt woodworking machines, including panel saws that are designed to hold wood in a horizontal position as it is comfortable during manual work. However, advanced technology that enables vertical panel saws to expedite the wood-cutting processes and cut labor expenses in recent years.

Panel Saws Find Wide Application in Carpentry

Carpentry finds wide application of panel saws, which contributed to 23% of the total demand in 2023.

Attributes Details
Top End Use Carpentry
Market Share in 2023 23%

This segment is expected to retain its dominance over the projected years as panel saws in carpentry are essential to produce flat-pack and modular furniture.
Competitive Landscape

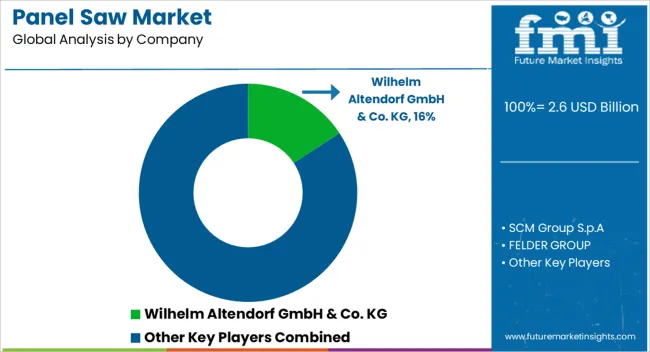
The global panel saw market is relatively consolidated as most of the leading players, with higher investment capacity and extensive distribution channels, hold a significant share of the market. Nowadays, to offer innovative and smart control features and technologies, emerging precision panel cutter companies are spending heavily on research and development activities.

Recent Developments in the Global Panel Saw Market

  • In November 2022, Woodtech unveiled its TruCut CNC Automated Panel Saw Fence at the International Woodworking Fair (IWF) in Atlanta. All contemporary panels or table saws can be retrofitted with TruCut, which is basically a software-driven cutting optimization and automation system. The operator can handle any cutting complexity by the touch screen control with a clear interface design. Even in situations where the user is not directly in front of the device, the clear interface design is readily apparent. This makes the procedure easy to understand and follow, ultimately resulting in enhanced cutting productivity, efficiency, and environmental protection while also lowering costs.
  • In September 2022, Wood-Mizer released its new MS300 table saw, including a sliding table to improve cutting accuracy and high precision woodworking. It has a large sliding feed table and a cast iron work table to produce a wide range of wood products, including furniture parts, floor panels, slats, boards, and interior finishing. According to the manufacturer, a robust cast iron foundation and steel ball bearings to support the sliding table provide for better vibration damping and stability. To facilitate cutting bigger materials, the MS300 table saw model may also be fitted with an additional 900 x 440 mm worktable extension.

Key Players Profiled in the Panel Saw Market Report

  • Wilhelm Altendorf GmbH & Co. KG
  • SCM Group S.p.A
  • FELDER GROUP
  • Otto Martin Maschinenbau GmbH & Co. KG
  • Griggio s.r.l.
  • Casadei Busellato
  • Robland NV
  • Baileigh Industrial, Inc
  • Woodworking Machine-Oliver Machinery Co
  • SAWSTOP
  • American Machine Works
  • Glory Industrial Machinery And Equipment Co., Ltd
  • OAV Equipment and Tools, Inc.
  • Joway Machinery Co., Ltd.
  • Griggio
  • HOLZMAN
  • DELTA
  • BAIEEIGH
  • Rexon
  • Yuetong Woodworking Machine
  • Nanxing

Panel Saw Market Report Scope

Attribute Details
Estimated Market Size (2024) US$ 2,488.2 million
Projected Market Size (2034) US$ 3,247.8 million
Anticipated Growth Rate (2024 to 2034) 2.5%
Forecast Period 2024 to 2034
Historical Data Available for 2019 to 2023
Market Analysis US$ million or billion for Value and Units for Volume
Key Regions Covered North America, Latin America, Europe, Middle East & Africa (MEA), East Asia, South Asia and Oceania
Key Countries Covered United States, Canada, Brazil, Mexico, Germany, Spain, Italy, France, United Kingdom, Russia, China, India, Australia & New Zealand, GCC Countries, and South Africa
Key Segments Covered By Product Type, By Material, By Packaging Format, By End Use, and By Region
Key Companies Profiled
  • Wilhelm Altendorf GmbH & Co. KG
  • SCM Group S.p.A
  • FELDER GROUP
  • Otto Martin Maschinenbau GmbH & Co. KG
  • Griggio s.r.l.
  • Casadei Busellato
  • Robland NV
  • Baileigh Industrial, Inc
  • Woodworking Machine-Oliver Machinery Co
  • SAWSTOP
  • American Machine Works
  • Glory Industrial Machinery And Equipment Co., Ltd
  • OAV Equipment and Tools, Inc.
  • Joway Machinery Co., Ltd.
  • Griggio
  • HOLZMAN
  • DELTA
  • BAIEEIGH
  • Rexon
  • Yuetong Woodworking Machine
  • Nanxing
Report Coverage Market Forecast, Company Share Analysis, Competition Intelligence, DROT Analysis, Market Dynamics and Challenges, and Strategic Growth Initiatives
Customization & Pricing Available upon Request

Key Segments Covered by Panel Saw Industry Survey Report

By Type:

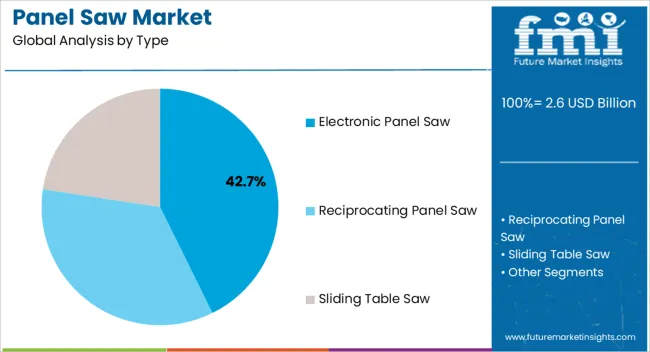
  • Electronic Panel Saw
  • Reciprocating Panel Saw
  • Sliding Table Saw

By Application:

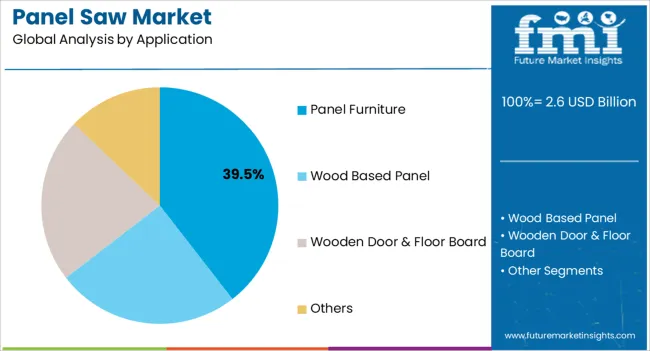
  • Panel Furniture
  • Wood Based Panel
  • Wooden Door & Floor Board
  • Others

By Region:

  • North America
  • Latin America
  • Europe
  • East Asia
  • South Asia
  • Oceania
  • MEA

Frequently Asked Questions

What is the Projected Growth Rate of the Global Panel Saw Market?

The global panel saw market is likely to grow at a 2.5% CAGR through 2034.

How Big will the Global Panel Saw Market Be by 2034?

The global panel saw market is expected to be valued at US$ 3,247.8 million by 2034.

Who are the Leading Players in the Global Panel Saw Market?

Wilhelm, SCM, and Felder are the top suppliers of panel saws globally.

Which Region has a Higher Demand for Panel Saws?

Europe accounts for nearly 25% of the revenue share of the global panel saw market.

Which Country has the Highest Growth Potential in the Market?

The market in India is likely to witness a CAGR of 2.5% through 2034.

Table of Content

1. Executive Summary

    1.1. Global Market Outlook

    1.2. Demand-side Trends

    1.3. Supply-side Trends

    1.4. Technology Roadmap Analysis

    1.5. Analysis and Recommendations

2. Market Overview

    2.1. Market Coverage / Taxonomy

    2.2. Market Definition / Scope / Limitations

3. Market Background

    3.1. Market Dynamics

        3.1.1. Drivers

        3.1.2. Restraints

        3.1.3. Opportunity

        3.1.4. Trends

    3.2. Scenario Forecast

        3.2.1. Demand in Optimistic Scenario

        3.2.2. Demand in Likely Scenario

        3.2.3. Demand in Conservative Scenario

    3.3. Opportunity Map Analysis

    3.4. Product Life Cycle Analysis

    3.5. Supply Chain Analysis

        3.5.1. Supply Side Participants and their Roles

            3.5.1.1. Producers

            3.5.1.2. Mid-Level Participants (Traders/ Agents/ Brokers)

            3.5.1.3. Wholesalers and Distributors

        3.5.2. Value Added and Value Created at Node in the Supply Chain

        3.5.3. List of Raw Material Suppliers

        3.5.4. List of Existing and Potential Buyer’s

    3.6. Investment Feasibility Matrix

    3.7. Value Chain Analysis

        3.7.1. Profit Margin Analysis

        3.7.2. Wholesalers and Distributors

        3.7.3. Retailers

    3.8. PESTLE and Porter’s Analysis

    3.9. Regulatory Landscape

        3.9.1. By Key Regions

        3.9.2. By Key Countries

    3.10. Regional Parent Market Outlook

    3.11. Production and Consumption Statistics

    3.12. Import and Export Statistics

4. Global Market Analysis 2019 to 2023 and Forecast, 2024 to 2034

    4.1. Historical Market Size Value (US$ Million) & Volume (Units) Analysis, 2019 to 2023

    4.2. Current and Future Market Size Value (US$ Million) & Volume (Units) Projections, 2024 to 2034

        4.2.1. Y-o-Y Growth Trend Analysis

        4.2.2. Absolute $ Opportunity Analysis

5. Global Market Analysis 2019 to 2023 and Forecast 2024 to 2034, By Type

    5.1. Introduction / Key Findings

    5.2. Historical Market Size Value (US$ Million) & Volume (Units) Analysis By Type, 2019 to 2023

    5.3. Current and Future Market Size Value (US$ Million) & Volume (Units) Analysis and Forecast By Type, 2024 to 2034

        5.3.1. Electronic Saw

        5.3.2. Reciprocating Saw

        5.3.3. Sliding Table Saw

    5.4. Y-o-Y Growth Trend Analysis By Type, 2019 to 2023

    5.5. Absolute $ Opportunity Analysis By Type, 2024 to 2034

6. Global Market Analysis 2019 to 2023 and Forecast 2024 to 2034, By Application

    6.1. Introduction / Key Findings

    6.2. Historical Market Size Value (US$ Million) & Volume (Units) Analysis By Application, 2019 to 2023

    6.3. Current and Future Market Size Value (US$ Million) & Volume (Units) Analysis and Forecast By Application, 2024 to 2034

        6.3.1. Furniture

        6.3.2. Wood Based

        6.3.3. Wooden Door & Floor Board

        6.3.4. Others

    6.4. Y-o-Y Growth Trend Analysis By Application, 2019 to 2023

    6.5. Absolute $ Opportunity Analysis By Application, 2024 to 2034

7. Global Market Analysis 2019 to 2023 and Forecast 2024 to 2034, By Region

    7.1. Introduction

    7.2. Historical Market Size Value (US$ Million) & Volume (Units) Analysis By Region, 2019 to 2023

    7.3. Current Market Size Value (US$ Million) & Volume (Units) Analysis and Forecast By Region, 2024 to 2034

        7.3.1. North America

        7.3.2. Latin America

        7.3.3. Europe

        7.3.4. East Asia

        7.3.5. South Asia

        7.3.6. Oceania

        7.3.7. MEA

    7.4. Market Attractiveness Analysis By Region

8. North America Market Analysis 2019 to 2023 and Forecast 2024 to 2034, By Country

    8.1. Historical Market Size Value (US$ Million) & Volume (Units) Trend Analysis By Market Taxonomy, 2019 to 2023

    8.2. Market Size Value (US$ Million) & Volume (Units) Forecast By Market Taxonomy, 2024 to 2034

        8.2.1. By Country

            8.2.1.1. USA.

            8.2.1.2. Canada

        8.2.2. By Type

        8.2.3. By Application

    8.3. Market Attractiveness Analysis

        8.3.1. By Country

        8.3.2. By Type

        8.3.3. By Application

    8.4. Key Takeaways

9. Latin America Market Analysis 2019 to 2023 and Forecast 2024 to 2034, By Country

    9.1. Historical Market Size Value (US$ Million) & Volume (Units) Trend Analysis By Market Taxonomy, 2019 to 2023

    9.2. Market Size Value (US$ Million) & Volume (Units) Forecast By Market Taxonomy, 2024 to 2034

        9.2.1. By Country

            9.2.1.1. Brazil

            9.2.1.2. Mexico

            9.2.1.3. Argentina

            9.2.1.4. Rest of Latin America

        9.2.2. By Type

        9.2.3. By Application

    9.3. Market Attractiveness Analysis

        9.3.1. By Country

        9.3.2. By Type

        9.3.3. By Application

    9.4. Key Takeaways

10. Europe Market Analysis 2019 to 2023 and Forecast 2024 to 2034, By Country

    10.1. Historical Market Size Value (US$ Million) & Volume (Units) Trend Analysis By Market Taxonomy, 2019 to 2023

    10.2. Market Size Value (US$ Million) & Volume (Units) Forecast By Market Taxonomy, 2024 to 2034

        10.2.1. By Country

            10.2.1.1. Germany

            10.2.1.2. Italy

            10.2.1.3. France

            10.2.1.4. UK

            10.2.1.5. Spain

            10.2.1.6. Russia

            10.2.1.7. BENELUX

            10.2.1.8. Rest of Europe

        10.2.2. By Type

        10.2.3. By Application

    10.3. Market Attractiveness Analysis

        10.3.1. By Country

        10.3.2. By Type

        10.3.3. By Application

    10.4. Key Takeaways

11. East Asia Market Analysis 2019 to 2023 and Forecast 2024 to 2034, By Country

    11.1. Historical Market Size Value (US$ Million) & Volume (Units) Trend Analysis By Market Taxonomy, 2019 to 2023

    11.2. Market Size Value (US$ Million) & Volume (Units) Forecast By Market Taxonomy, 2024 to 2034

        11.2.1. By Country

            11.2.1.1. China

            11.2.1.2. Japan

            11.2.1.3. South Korea

        11.2.2. By Type

        11.2.3. By Application

    11.3. Market Attractiveness Analysis

        11.3.1. By Country

        11.3.2. By Type

        11.3.3. By Application

    11.4. Key Takeaways

12. South Asia Market Analysis 2019 to 2023 and Forecast 2024 to 2034, By Country

    12.1. Historical Market Size Value (US$ Million) & Volume (Units) Trend Analysis By Market Taxonomy, 2019 to 2023

    12.2. Market Size Value (US$ Million) & Volume (Units) Forecast By Market Taxonomy, 2024 to 2034

        12.2.1. By Country

            12.2.1.1. India

            12.2.1.2. Thailand

            12.2.1.3. Malaysia

            12.2.1.4. Indonesia

            12.2.1.5. Rest of South Asia

        12.2.2. By Type

        12.2.3. By Application

    12.3. Market Attractiveness Analysis

        12.3.1. By Country

        12.3.2. By Type

        12.3.3. By Application

    12.4. Key Takeaways

13. Oceania Market Analysis 2019 to 2023 and Forecast 2024 to 2034, By Country

    13.1. Historical Market Size Value (US$ Million) & Volume (Units) Trend Analysis By Market Taxonomy, 2019 to 2023

    13.2. Market Size Value (US$ Million) & Volume (Units) Forecast By Market Taxonomy, 2024 to 2034

        13.2.1. By Country

            13.2.1.1. Australia

            13.2.1.2. New Zealand

        13.2.2. By Type

        13.2.3. By Application

    13.3. Market Attractiveness Analysis

        13.3.1. By Country

        13.3.2. By Type

        13.3.3. By Application

    13.4. Key Takeaways

14. MEA Market Analysis 2019 to 2023 and Forecast 2024 to 2034, By Country

    14.1. Historical Market Size Value (US$ Million) & Volume (Units) Trend Analysis By Market Taxonomy, 2019 to 2023

    14.2. Market Size Value (US$ Million) & Volume (Units) Forecast By Market Taxonomy, 2024 to 2034

        14.2.1. By Country

            14.2.1.1. GCC

            14.2.1.2. Rest of MEA

        14.2.2. By Type

        14.2.3. By Application

    14.3. Market Attractiveness Analysis

        14.3.1. By Country

        14.3.2. By Type

        14.3.3. By Application

    14.4. Key Takeaways

15. Key Countries Market Analysis

    15.1. USA.

        15.1.1. Pricing Analysis

        15.1.2. Market Share Analysis, 2023

            15.1.2.1. By Type

            15.1.2.2. By Application

    15.2. Canada

        15.2.1. Pricing Analysis

        15.2.2. Market Share Analysis, 2023

            15.2.2.1. By Type

            15.2.2.2. By Application

    15.3. Brazil

        15.3.1. Pricing Analysis

        15.3.2. Market Share Analysis, 2023

            15.3.2.1. By Type

            15.3.2.2. By Application

    15.4. Mexico

        15.4.1. Pricing Analysis

        15.4.2. Market Share Analysis, 2023

            15.4.2.1. By Type

            15.4.2.2. By Application

    15.5. Argentina

        15.5.1. Pricing Analysis

        15.5.2. Market Share Analysis, 2023

            15.5.2.1. By Type

            15.5.2.2. By Application

    15.6. Germany

        15.6.1. Pricing Analysis

        15.6.2. Market Share Analysis, 2023

            15.6.2.1. By Type

            15.6.2.2. By Application

    15.7. Italy

        15.7.1. Pricing Analysis

        15.7.2. Market Share Analysis, 2023

            15.7.2.1. By Type

            15.7.2.2. By Application

    15.8. France

        15.8.1. Pricing Analysis

        15.8.2. Market Share Analysis, 2023

            15.8.2.1. By Type

            15.8.2.2. By Application

    15.9. UK

        15.9.1. Pricing Analysis

        15.9.2. Market Share Analysis, 2023

            15.9.2.1. By Type

            15.9.2.2. By Application

    15.10. Spain

        15.10.1. Pricing Analysis

        15.10.2. Market Share Analysis, 2023

            15.10.2.1. By Type

            15.10.2.2. By Application

    15.11. Russia

        15.11.1. Pricing Analysis

        15.11.2. Market Share Analysis, 2023

            15.11.2.1. By Type

            15.11.2.2. By Application

    15.12. BENELUX

        15.12.1. Pricing Analysis

        15.12.2. Market Share Analysis, 2023

            15.12.2.1. By Type

            15.12.2.2. By Application

    15.13. China

        15.13.1. Pricing Analysis

        15.13.2. Market Share Analysis, 2023

            15.13.2.1. By Type

            15.13.2.2. By Application

    15.14. Japan

        15.14.1. Pricing Analysis

        15.14.2. Market Share Analysis, 2023

            15.14.2.1. By Type

            15.14.2.2. By Application

    15.15. South Korea

        15.15.1. Pricing Analysis

        15.15.2. Market Share Analysis, 2023

            15.15.2.1. By Type

            15.15.2.2. By Application

    15.16. India

        15.16.1. Pricing Analysis

        15.16.2. Market Share Analysis, 2023

            15.16.2.1. By Type

            15.16.2.2. By Application

    15.17. Thailand

        15.17.1. Pricing Analysis

        15.17.2. Market Share Analysis, 2023

            15.17.2.1. By Type

            15.17.2.2. By Application

    15.18. Malaysia

        15.18.1. Pricing Analysis

        15.18.2. Market Share Analysis, 2023

            15.18.2.1. By Type

            15.18.2.2. By Application

    15.19. Indonesia

        15.19.1. Pricing Analysis

        15.19.2. Market Share Analysis, 2023

            15.19.2.1. By Type

            15.19.2.2. By Application

    15.20. Australia

        15.20.1. Pricing Analysis

        15.20.2. Market Share Analysis, 2023

            15.20.2.1. By Type

            15.20.2.2. By Application

    15.21. New Zealand

        15.21.1. Pricing Analysis

        15.21.2. Market Share Analysis, 2023

            15.21.2.1. By Type

            15.21.2.2. By Application

    15.22. GCC Countries

        15.22.1. Pricing Analysis

        15.22.2. Market Share Analysis, 2023

            15.22.2.1. By Type

            15.22.2.2. By Application

16. Market Structure Analysis

    16.1. Competition Dashboard

    16.2. Competition Benchmarking

    16.3. Market Share Analysis of Top Players

        16.3.1. By Regional

        16.3.2. By Type

        16.3.3. By Application

17. Competition Analysis

    17.1. Competition Deep Dive

        17.1.1. HOMAG

            17.1.1.1. Overview

            17.1.1.2. Product Portfolio

            17.1.1.3. Profitability by Market Segments

            17.1.1.4. Sales Footprint

            17.1.1.5. Strategy Overview

                17.1.1.5.1. Marketing Strategy

                17.1.1.5.2. Product Strategy

                17.1.1.5.3. Channel Strategy

        17.1.2. Schelling

            17.1.2.1. Overview

            17.1.2.2. Product Portfolio

            17.1.2.3. Profitability by Market Segments

            17.1.2.4. Sales Footprint

            17.1.2.5. Strategy Overview

                17.1.2.5.1. Marketing Strategy

                17.1.2.5.2. Product Strategy

                17.1.2.5.3. Channel Strategy

        17.1.3. Weinig

            17.1.3.1. Overview

            17.1.3.2. Product Portfolio

            17.1.3.3. Profitability by Market Segments

            17.1.3.4. Sales Footprint

            17.1.3.5. Strategy Overview

                17.1.3.5.1. Marketing Strategy

                17.1.3.5.2. Product Strategy

                17.1.3.5.3. Channel Strategy

        17.1.4. Nanxing

            17.1.4.1. Overview

            17.1.4.2. Product Portfolio

            17.1.4.3. Profitability by Market Segments

            17.1.4.4. Sales Footprint

            17.1.4.5. Strategy Overview

                17.1.4.5.1. Marketing Strategy

                17.1.4.5.2. Product Strategy

                17.1.4.5.3. Channel Strategy

        17.1.5. KDT

            17.1.5.1. Overview

            17.1.5.2. Product Portfolio

            17.1.5.3. Profitability by Market Segments

            17.1.5.4. Sales Footprint

            17.1.5.5. Strategy Overview

                17.1.5.5.1. Marketing Strategy

                17.1.5.5.2. Product Strategy

                17.1.5.5.3. Channel Strategy

        17.1.6. Fulpow

            17.1.6.1. Overview

            17.1.6.2. Product Portfolio

            17.1.6.3. Profitability by Market Segments

            17.1.6.4. Sales Footprint

            17.1.6.5. Strategy Overview

                17.1.6.5.1. Marketing Strategy

                17.1.6.5.2. Product Strategy

                17.1.6.5.3. Channel Strategy

        17.1.7. Hendrick

            17.1.7.1. Overview

            17.1.7.2. Product Portfolio

            17.1.7.3. Profitability by Market Segments

            17.1.7.4. Sales Footprint

            17.1.7.5. Strategy Overview

                17.1.7.5.1. Marketing Strategy

                17.1.7.5.2. Product Strategy

                17.1.7.5.3. Channel Strategy

        17.1.8. TAI CHAN

            17.1.8.1. Overview

            17.1.8.2. Product Portfolio

            17.1.8.3. Profitability by Market Segments

            17.1.8.4. Sales Footprint

            17.1.8.5. Strategy Overview

                17.1.8.5.1. Marketing Strategy

                17.1.8.5.2. Product Strategy

                17.1.8.5.3. Channel Strategy

        17.1.9. MeiJing

            17.1.9.1. Overview

            17.1.9.2. Product Portfolio

            17.1.9.3. Profitability by Market Segments

            17.1.9.4. Sales Footprint

            17.1.9.5. Strategy Overview

                17.1.9.5.1. Marketing Strategy

                17.1.9.5.2. Product Strategy

                17.1.9.5.3. Channel Strategy

        17.1.10. Qingdao Sanmu

            17.1.10.1. Overview

            17.1.10.2. Product Portfolio

            17.1.10.3. Profitability by Market Segments

            17.1.10.4. Sales Footprint

            17.1.10.5. Strategy Overview

                17.1.10.5.1. Marketing Strategy

                17.1.10.5.2. Product Strategy

                17.1.10.5.3. Channel Strategy

18. Assumptions & Acronyms Used

19. Research Methodology

List of Tables

Table 1: Global Market Value (US$ Million) Forecast by Region, 2019 to 2034

Table 2: Global Market Volume (Units) Forecast by Region, 2019 to 2034

Table 3: Global Market Value (US$ Million) Forecast by Type, 2019 to 2034

Table 4: Global Market Volume (Units) Forecast by Type, 2019 to 2034

Table 5: Global Market Value (US$ Million) Forecast by Application, 2019 to 2034

Table 6: Global Market Volume (Units) Forecast by Application, 2019 to 2034

Table 7: North America Market Value (US$ Million) Forecast by Country, 2019 to 2034

Table 8: North America Market Volume (Units) Forecast by Country, 2019 to 2034

Table 9: North America Market Value (US$ Million) Forecast by Type, 2019 to 2034

Table 10: North America Market Volume (Units) Forecast by Type, 2019 to 2034

Table 11: North America Market Value (US$ Million) Forecast by Application, 2019 to 2034

Table 12: North America Market Volume (Units) Forecast by Application, 2019 to 2034

Table 13: Latin America Market Value (US$ Million) Forecast by Country, 2019 to 2034

Table 14: Latin America Market Volume (Units) Forecast by Country, 2019 to 2034

Table 15: Latin America Market Value (US$ Million) Forecast by Type, 2019 to 2034

Table 16: Latin America Market Volume (Units) Forecast by Type, 2019 to 2034

Table 17: Latin America Market Value (US$ Million) Forecast by Application, 2019 to 2034

Table 18: Latin America Market Volume (Units) Forecast by Application, 2019 to 2034

Table 19: Europe Market Value (US$ Million) Forecast by Country, 2019 to 2034

Table 20: Europe Market Volume (Units) Forecast by Country, 2019 to 2034

Table 21: Europe Market Value (US$ Million) Forecast by Type, 2019 to 2034

Table 22: Europe Market Volume (Units) Forecast by Type, 2019 to 2034

Table 23: Europe Market Value (US$ Million) Forecast by Application, 2019 to 2034

Table 24: Europe Market Volume (Units) Forecast by Application, 2019 to 2034

Table 25: East Asia Market Value (US$ Million) Forecast by Country, 2019 to 2034

Table 26: East Asia Market Volume (Units) Forecast by Country, 2019 to 2034

Table 27: East Asia Market Value (US$ Million) Forecast by Type, 2019 to 2034

Table 28: East Asia Market Volume (Units) Forecast by Type, 2019 to 2034

Table 29: East Asia Market Value (US$ Million) Forecast by Application, 2019 to 2034

Table 30: East Asia Market Volume (Units) Forecast by Application, 2019 to 2034

Table 31: South Asia Market Value (US$ Million) Forecast by Country, 2019 to 2034

Table 32: South Asia Market Volume (Units) Forecast by Country, 2019 to 2034

Table 33: South Asia Market Value (US$ Million) Forecast by Type, 2019 to 2034

Table 34: South Asia Market Volume (Units) Forecast by Type, 2019 to 2034

Table 35: South Asia Market Value (US$ Million) Forecast by Application, 2019 to 2034

Table 36: South Asia Market Volume (Units) Forecast by Application, 2019 to 2034

Table 37: Oceania Market Value (US$ Million) Forecast by Country, 2019 to 2034

Table 38: Oceania Market Volume (Units) Forecast by Country, 2019 to 2034

Table 39: Oceania Market Value (US$ Million) Forecast by Type, 2019 to 2034

Table 40: Oceania Market Volume (Units) Forecast by Type, 2019 to 2034

Table 41: Oceania Market Value (US$ Million) Forecast by Application, 2019 to 2034

Table 42: Oceania Market Volume (Units) Forecast by Application, 2019 to 2034

Table 43: MEA Market Value (US$ Million) Forecast by Country, 2019 to 2034

Table 44: MEA Market Volume (Units) Forecast by Country, 2019 to 2034

Table 45: MEA Market Value (US$ Million) Forecast by Type, 2019 to 2034

Table 46: MEA Market Volume (Units) Forecast by Type, 2019 to 2034

Table 47: MEA Market Value (US$ Million) Forecast by Application, 2019 to 2034

Table 48: MEA Market Volume (Units) Forecast by Application, 2019 to 2034

List of Charts

Figure 1: Global Market Value (US$ Million) by Type, 2024 to 2034

Figure 2: Global Market Value (US$ Million) by Application, 2024 to 2034

Figure 3: Global Market Value (US$ Million) by Region, 2024 to 2034

Figure 4: Global Market Value (US$ Million) Analysis by Region, 2019 to 2034

Figure 5: Global Market Volume (Units) Analysis by Region, 2019 to 2034

Figure 6: Global Market Value Share (%) and BPS Analysis by Region, 2024 to 2034

Figure 7: Global Market Y-o-Y Growth (%) Projections by Region, 2024 to 2034

Figure 8: Global Market Value (US$ Million) Analysis by Type, 2019 to 2034

Figure 9: Global Market Volume (Units) Analysis by Type, 2019 to 2034

Figure 10: Global Market Value Share (%) and BPS Analysis by Type, 2024 to 2034

Figure 11: Global Market Y-o-Y Growth (%) Projections by Type, 2024 to 2034

Figure 12: Global Market Value (US$ Million) Analysis by Application, 2019 to 2034

Figure 13: Global Market Volume (Units) Analysis by Application, 2019 to 2034

Figure 14: Global Market Value Share (%) and BPS Analysis by Application, 2024 to 2034

Figure 15: Global Market Y-o-Y Growth (%) Projections by Application, 2024 to 2034

Figure 16: Global Market Attractiveness by Type, 2024 to 2034

Figure 17: Global Market Attractiveness by Application, 2024 to 2034

Figure 18: Global Market Attractiveness by Region, 2024 to 2034

Figure 19: North America Market Value (US$ Million) by Type, 2024 to 2034

Figure 20: North America Market Value (US$ Million) by Application, 2024 to 2034

Figure 21: North America Market Value (US$ Million) by Country, 2024 to 2034

Figure 22: North America Market Value (US$ Million) Analysis by Country, 2019 to 2034

Figure 23: North America Market Volume (Units) Analysis by Country, 2019 to 2034

Figure 24: North America Market Value Share (%) and BPS Analysis by Country, 2024 to 2034

Figure 25: North America Market Y-o-Y Growth (%) Projections by Country, 2024 to 2034

Figure 26: North America Market Value (US$ Million) Analysis by Type, 2019 to 2034

Figure 27: North America Market Volume (Units) Analysis by Type, 2019 to 2034

Figure 28: North America Market Value Share (%) and BPS Analysis by Type, 2024 to 2034

Figure 29: North America Market Y-o-Y Growth (%) Projections by Type, 2024 to 2034

Figure 30: North America Market Value (US$ Million) Analysis by Application, 2019 to 2034

Figure 31: North America Market Volume (Units) Analysis by Application, 2019 to 2034

Figure 32: North America Market Value Share (%) and BPS Analysis by Application, 2024 to 2034

Figure 33: North America Market Y-o-Y Growth (%) Projections by Application, 2024 to 2034

Figure 34: North America Market Attractiveness by Type, 2024 to 2034

Figure 35: North America Market Attractiveness by Application, 2024 to 2034

Figure 36: North America Market Attractiveness by Country, 2024 to 2034

Figure 37: Latin America Market Value (US$ Million) by Type, 2024 to 2034

Figure 38: Latin America Market Value (US$ Million) by Application, 2024 to 2034

Figure 39: Latin America Market Value (US$ Million) by Country, 2024 to 2034

Figure 40: Latin America Market Value (US$ Million) Analysis by Country, 2019 to 2034

Figure 41: Latin America Market Volume (Units) Analysis by Country, 2019 to 2034

Figure 42: Latin America Market Value Share (%) and BPS Analysis by Country, 2024 to 2034

Figure 43: Latin America Market Y-o-Y Growth (%) Projections by Country, 2024 to 2034

Figure 44: Latin America Market Value (US$ Million) Analysis by Type, 2019 to 2034

Figure 45: Latin America Market Volume (Units) Analysis by Type, 2019 to 2034

Figure 46: Latin America Market Value Share (%) and BPS Analysis by Type, 2024 to 2034

Figure 47: Latin America Market Y-o-Y Growth (%) Projections by Type, 2024 to 2034

Figure 48: Latin America Market Value (US$ Million) Analysis by Application, 2019 to 2034

Figure 49: Latin America Market Volume (Units) Analysis by Application, 2019 to 2034

Figure 50: Latin America Market Value Share (%) and BPS Analysis by Application, 2024 to 2034

Figure 51: Latin America Market Y-o-Y Growth (%) Projections by Application, 2024 to 2034

Figure 52: Latin America Market Attractiveness by Type, 2024 to 2034

Figure 53: Latin America Market Attractiveness by Application, 2024 to 2034

Figure 54: Latin America Market Attractiveness by Country, 2024 to 2034

Figure 55: Europe Market Value (US$ Million) by Type, 2024 to 2034

Figure 56: Europe Market Value (US$ Million) by Application, 2024 to 2034

Figure 57: Europe Market Value (US$ Million) by Country, 2024 to 2034

Figure 58: Europe Market Value (US$ Million) Analysis by Country, 2019 to 2034

Figure 59: Europe Market Volume (Units) Analysis by Country, 2019 to 2034

Figure 60: Europe Market Value Share (%) and BPS Analysis by Country, 2024 to 2034

Figure 61: Europe Market Y-o-Y Growth (%) Projections by Country, 2024 to 2034

Figure 62: Europe Market Value (US$ Million) Analysis by Type, 2019 to 2034

Figure 63: Europe Market Volume (Units) Analysis by Type, 2019 to 2034

Figure 64: Europe Market Value Share (%) and BPS Analysis by Type, 2024 to 2034

Figure 65: Europe Market Y-o-Y Growth (%) Projections by Type, 2024 to 2034

Figure 66: Europe Market Value (US$ Million) Analysis by Application, 2019 to 2034

Figure 67: Europe Market Volume (Units) Analysis by Application, 2019 to 2034

Figure 68: Europe Market Value Share (%) and BPS Analysis by Application, 2024 to 2034

Figure 69: Europe Market Y-o-Y Growth (%) Projections by Application, 2024 to 2034

Figure 70: Europe Market Attractiveness by Type, 2024 to 2034

Figure 71: Europe Market Attractiveness by Application, 2024 to 2034

Figure 72: Europe Market Attractiveness by Country, 2024 to 2034

Figure 73: East Asia Market Value (US$ Million) by Type, 2024 to 2034

Figure 74: East Asia Market Value (US$ Million) by Application, 2024 to 2034

Figure 75: East Asia Market Value (US$ Million) by Country, 2024 to 2034

Figure 76: East Asia Market Value (US$ Million) Analysis by Country, 2019 to 2034

Figure 77: East Asia Market Volume (Units) Analysis by Country, 2019 to 2034

Figure 78: East Asia Market Value Share (%) and BPS Analysis by Country, 2024 to 2034

Figure 79: East Asia Market Y-o-Y Growth (%) Projections by Country, 2024 to 2034

Figure 80: East Asia Market Value (US$ Million) Analysis by Type, 2019 to 2034

Figure 81: East Asia Market Volume (Units) Analysis by Type, 2019 to 2034

Figure 82: East Asia Market Value Share (%) and BPS Analysis by Type, 2024 to 2034

Figure 83: East Asia Market Y-o-Y Growth (%) Projections by Type, 2024 to 2034

Figure 84: East Asia Market Value (US$ Million) Analysis by Application, 2019 to 2034

Figure 85: East Asia Market Volume (Units) Analysis by Application, 2019 to 2034

Figure 86: East Asia Market Value Share (%) and BPS Analysis by Application, 2024 to 2034

Figure 87: East Asia Market Y-o-Y Growth (%) Projections by Application, 2024 to 2034

Figure 88: East Asia Market Attractiveness by Type, 2024 to 2034

Figure 89: East Asia Market Attractiveness by Application, 2024 to 2034

Figure 90: East Asia Market Attractiveness by Country, 2024 to 2034

Figure 91: South Asia Market Value (US$ Million) by Type, 2024 to 2034

Figure 92: South Asia Market Value (US$ Million) by Application, 2024 to 2034

Figure 93: South Asia Market Value (US$ Million) by Country, 2024 to 2034

Figure 94: South Asia Market Value (US$ Million) Analysis by Country, 2019 to 2034

Figure 95: South Asia Market Volume (Units) Analysis by Country, 2019 to 2034

Figure 96: South Asia Market Value Share (%) and BPS Analysis by Country, 2024 to 2034

Figure 97: South Asia Market Y-o-Y Growth (%) Projections by Country, 2024 to 2034

Figure 98: South Asia Market Value (US$ Million) Analysis by Type, 2019 to 2034

Figure 99: South Asia Market Volume (Units) Analysis by Type, 2019 to 2034

Figure 100: South Asia Market Value Share (%) and BPS Analysis by Type, 2024 to 2034

Figure 101: South Asia Market Y-o-Y Growth (%) Projections by Type, 2024 to 2034

Figure 102: South Asia Market Value (US$ Million) Analysis by Application, 2019 to 2034

Figure 103: South Asia Market Volume (Units) Analysis by Application, 2019 to 2034

Figure 104: South Asia Market Value Share (%) and BPS Analysis by Application, 2024 to 2034

Figure 105: South Asia Market Y-o-Y Growth (%) Projections by Application, 2024 to 2034

Figure 106: South Asia Market Attractiveness by Type, 2024 to 2034

Figure 107: South Asia Market Attractiveness by Application, 2024 to 2034

Figure 108: South Asia Market Attractiveness by Country, 2024 to 2034

Figure 109: Oceania Market Value (US$ Million) by Type, 2024 to 2034

Figure 110: Oceania Market Value (US$ Million) by Application, 2024 to 2034

Figure 111: Oceania Market Value (US$ Million) by Country, 2024 to 2034

Figure 112: Oceania Market Value (US$ Million) Analysis by Country, 2019 to 2034

Figure 113: Oceania Market Volume (Units) Analysis by Country, 2019 to 2034

Figure 114: Oceania Market Value Share (%) and BPS Analysis by Country, 2024 to 2034

Figure 115: Oceania Market Y-o-Y Growth (%) Projections by Country, 2024 to 2034

Figure 116: Oceania Market Value (US$ Million) Analysis by Type, 2019 to 2034

Figure 117: Oceania Market Volume (Units) Analysis by Type, 2019 to 2034

Figure 118: Oceania Market Value Share (%) and BPS Analysis by Type, 2024 to 2034

Figure 119: Oceania Market Y-o-Y Growth (%) Projections by Type, 2024 to 2034

Figure 120: Oceania Market Value (US$ Million) Analysis by Application, 2019 to 2034

Figure 121: Oceania Market Volume (Units) Analysis by Application, 2019 to 2034

Figure 122: Oceania Market Value Share (%) and BPS Analysis by Application, 2024 to 2034

Figure 123: Oceania Market Y-o-Y Growth (%) Projections by Application, 2024 to 2034

Figure 124: Oceania Market Attractiveness by Type, 2024 to 2034

Figure 125: Oceania Market Attractiveness by Application, 2024 to 2034

Figure 126: Oceania Market Attractiveness by Country, 2024 to 2034

Figure 127: MEA Market Value (US$ Million) by Type, 2024 to 2034

Figure 128: MEA Market Value (US$ Million) by Application, 2024 to 2034

Figure 129: MEA Market Value (US$ Million) by Country, 2024 to 2034

Figure 130: MEA Market Value (US$ Million) Analysis by Country, 2019 to 2034

Figure 131: MEA Market Volume (Units) Analysis by Country, 2019 to 2034

Figure 132: MEA Market Value Share (%) and BPS Analysis by Country, 2024 to 2034

Figure 133: MEA Market Y-o-Y Growth (%) Projections by Country, 2024 to 2034

Figure 134: MEA Market Value (US$ Million) Analysis by Type, 2019 to 2034

Figure 135: MEA Market Volume (Units) Analysis by Type, 2019 to 2034

Figure 136: MEA Market Value Share (%) and BPS Analysis by Type, 2024 to 2034

Figure 137: MEA Market Y-o-Y Growth (%) Projections by Type, 2024 to 2034

Figure 138: MEA Market Value (US$ Million) Analysis by Application, 2019 to 2034

Figure 139: MEA Market Volume (Units) Analysis by Application, 2019 to 2034

Figure 140: MEA Market Value Share (%) and BPS Analysis by Application, 2024 to 2034

Figure 141: MEA Market Y-o-Y Growth (%) Projections by Application, 2024 to 2034

Figure 142: MEA Market Attractiveness by Type, 2024 to 2034

Figure 143: MEA Market Attractiveness by Application, 2024 to 2034

Figure 144: MEA Market Attractiveness by Country, 2024 to 2034

Recommendations

Industrial Automation

Saw Blades Market

Published : July 2023

Industrial Automation

Woodworking Circular Saw Blades Market

Published : July 2022

Explore Industrial Automation Insights

View Reports