Bed Head Panel Market Outlook for 2023 to 2033

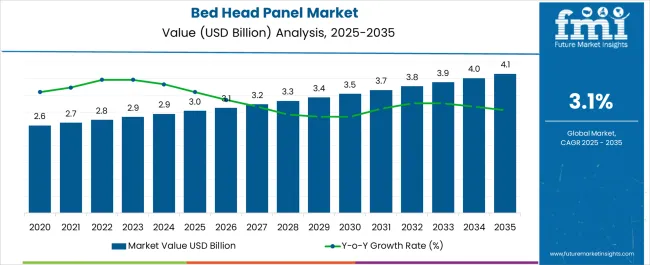
The global bed head panel market is on track to achieve a market valuation of USD 2,847.9 million by the year 2023. This growth is set to gain momentum with a projected CAGR of 3.3% from 2023 to 2033. As we look ahead, the bed head panel market share is expected to reach an estimated value of around USD 3,952.9 million by the end of 2033.

Key Trends and Highlights

  • Bed head panels have become integral components in various healthcare settings, particularly in ICU situations within hospitals. Their convenience and essential features have increased sales in the market.
  • Users seek bed head panels that meet specific design criteria to cater to both patient and hospital staff needs. The criteria often include medical alert systems, medicinal gas outlets, pressure ports, and electrical and communication channels, contributing to the market's growth.
  • The market has witnessed growth through the utilization of innovative materials that enhance bed head panel properties, such as non-flammability, electrostatic protection, and compatibility with various patient services.
  • Increasing efforts by governments to strengthen medical infrastructure are expected to drive future trends in the bed head panel market. This includes investments in healthcare facilities and equipment.
  • The prevalence of chronic illnesses and an aging population have created significant market opportunities. Bed head panels play a crucial role in providing patient care in these scenarios.
  • Manufacturers globally are emphasizing research and development efforts to create sophisticated bed head panel products. The focus on innovation aims to meet evolving healthcare demands.
  • Ongoing advancements in safety features and compliance standards contribute to the market's growth as healthcare providers prioritize patient safety.
Attributes Key Insights
Bed Head Panel Estimated Size in 2023 USD 2,847.9 million
Projected Market Size in 2033 USD 3,952.9 million
Value-based CAGR from 2023 to 2033 3.3%

2018 to 2022 Historical Analysis vs. 2023 to 2033 Market Forecast Projections

The scope for global bed head panel market insights rose at a 3.08% CAGR between 2018 and 2022. The market is anticipated to develop at a moderate CAGR of 3.3% over the forecast period from 2023 to 2033.

Attributes Details
Market Value in 2018 USD 2,480.2 million
Market Value in 2022 USD 2,800.3 million
CAGR from 2018 to 2022 3.08%

The bed head panel market has witnessed substantial growth over the years, primarily driven by the customization options available to cater to the specific needs of patients and end-users. The customizable structures incorporate features such as electric wiring and medical gas pipe outlets, enhancing the utility and convenience of bed head panels.

The adoption of unique materials, including non-flammable materials and those offering electrostatic protection, has contributed significantly to the market's expansion. The innovations have allowed bed head panels to seamlessly integrate with various patient services, driving the market's remarkable growth in size and scope.

Looking ahead to the forecast period from 2023 to 2033, several key factors are expected to shape the future of the bed head panel market. Increased government efforts aimed at bolstering medical infrastructure are anticipated to drive forthcoming trends in the market.

Governments recognize the importance of healthcare infrastructure and are likely to invest in the expansion and modernization of healthcare facilities, including the integration of advanced bed head panel systems. Such proactive approach is poised to create substantial opportunities for market growth.

The aging population and the prevalence of chronic illnesses represent a demographic shift that has already begun to create significant opportunities in the bed head panel market. The demand for advanced bed head panel solutions is expected to surge to address the requirements of aging individuals and patients with chronic conditions.

Manufacturers of bed head panels are responding to the evolving trends by intensifying their research and development efforts. The focus is on creating sophisticated products that align with the changing landscape of healthcare delivery. Such efforts aim to provide innovative and efficient bed head panel solutions that meet the diverse needs of healthcare facilities and patients.

Bed Head Panel Market Propelling Factors

  • The bed head panel market is experiencing significant growth, propelled by various factors, including increasing patient expectations for well-equipped healthcare facilities. Patients seek hospitals and medical centers that offer advanced infrastructure and services, and bed head panels play a crucial role in enhancing the overall healthcare environment. The panels provide essential utilities and services to both patients and healthcare professionals, contributing to the overall quality of care and patient satisfaction.
  • The rising prevalence of chronic diseases has significantly contributed to the growth of the bed head panel market. Chronic conditions such as cancer, cardiovascular disorders, neurovascular diseases, urological disorders, and various other persistent health issues have become increasingly common.
  • The growing health burden has resulted in higher hospital admission rates, further emphasizing the importance of well-equipped healthcare facilities. Bed head panels aid in the efficient delivery of care for patients with chronic illnesses, enhancing their comfort and convenience during their hospital stay.
  • Looking ahead, there is a substantial population at risk of developing chronic illnesses due to factors like high blood pressure, obesity, and smoking. As these risk factors persist, they are expected to create new opportunities for increased sales of bed head panels.
  • Healthcare facilities will continue to prioritize the enhancement of their infrastructure to accommodate the needs of patients with chronic conditions, ultimately driving the demand for advanced bed head panel solutions.

Category-wise Insights

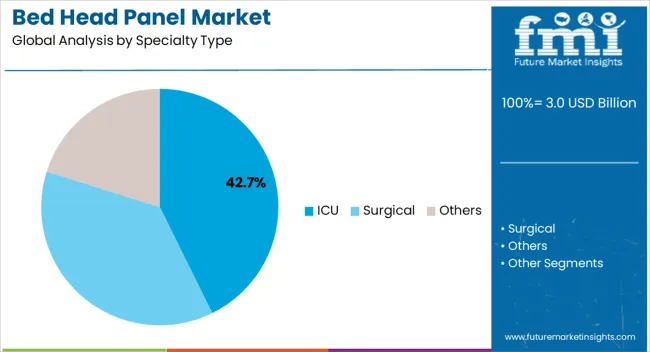
The below table highlights how ICUs are projected to lead the specialty-type market, expanding at a market share of 43.6% through 2033. The table further continues with details about how hospitals are anticipated to witness a market share of 41.2% through 2033.

Category Market Share by 2033
ICU 43.6%
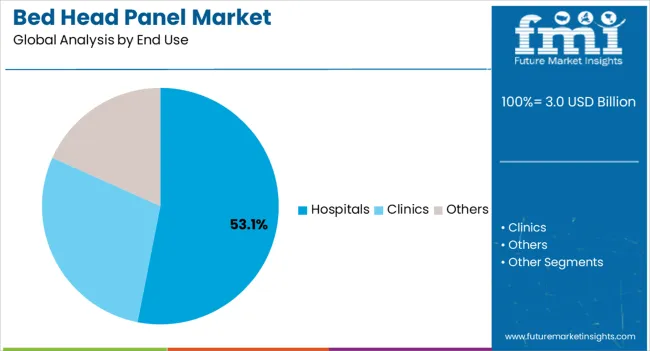
Hospitals 41.2%

Demand for ICUs is Rising and Recording Significant Share

The ICU segment, based on specialty type is leading overall market. The segment is expected to witness significant growth due to an increase in ICU admissions, an aging population, and an uptick in the incidence of infectious diseases.

The surgical bed head panel segment is poised for dominant growth. It encompasses operation rooms, pediatric wards, light-duty daycare units, ambulatory patient beds, and long-term and general care wards. The segment is expected to drive key trends and opportunities in the bed head panel market in the coming days. This segment is further projected to expand due to the increasing number of bariatric patients, the rising number of surgeries performed, and the higher frequency of premature births.

Hospitals to Hold a Prominent Position in the Market

According to bed head panel market statistics, hospitals based on end use type emerged as the dominant force, contributing to 41.2% of global revenue. The segment is expected to be fueled by the increasing rate of hospitalization due to severe illnesses such as COVID-19 and others.

The growth of the bed head panel end use segment is further increasing as the number of well-equipped hospitals with increased footfall continues to rise. The installation of bed head panels in hospitals is set to increase with the establishment of public healthcare facilities offering affordable medical services.

Looking ahead to the forecasted period, the clinic and other healthcare institutions are poised for significant expansion. The category encompasses nursing facilities, senior residences, and local emergency care facilities. Patients are increasingly favoring these segments due to cost savings compared to hospitals, making the clinical bed head panel category the notably growing segment in the target market.
Country-wise Analysis

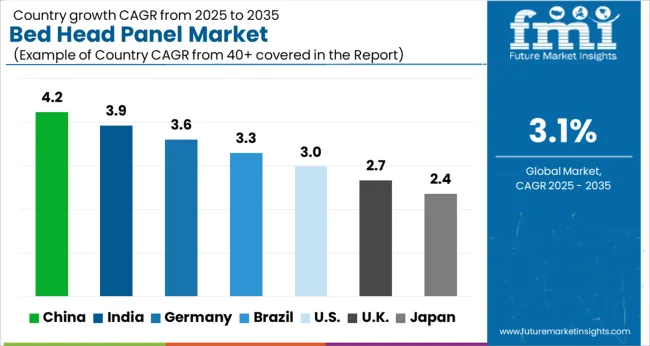
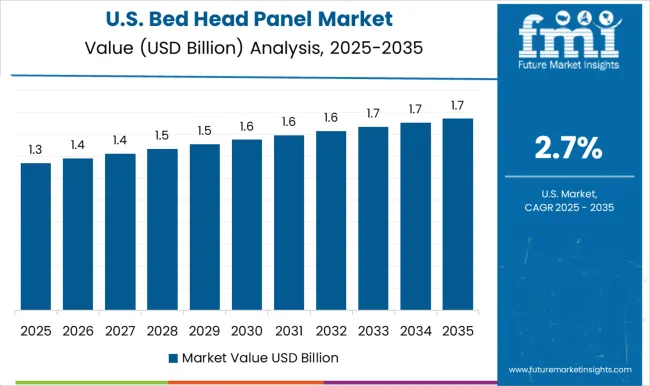
The below table showcases revenues in terms of the five countries, spearheaded by the United States, China, the United Kingdom, Germany, and Japan. Out of these 5 countries, the United States is leading, followed by China.

Countries Market Share in 2023
The United States 19.3%
The United Kingdom 10.3%
Germany 8.7%
India 7.1%
China 12.1%

Expansive Demand in the United States ICU Segment

The United States, with its vast healthcare landscape and a substantial number of patients admitted to intensive care units (ICUs), stands as a promising hub for the bed head panel market. According to a report published by the Society of Critical Care Medicine, over 5 million patients find themselves in ICUs across the country each year, emphasizing the significant need for specialized care facilities.

The United States bed head panel market is poised to continue its profitability and growth trajectory in 2023, catering to the unique requirements of a substantial portion of the population.

The United States witnessed a growing trend in medical procedures such as bariatric surgery, with 256,000 Americans undergoing fat loss surgeries in the previous year. These procedures often entail lengthy hospital stays, demanding enhanced care and support during the recovery process.

The surge in healthcare interventions that necessitate extended hospitalization is expected to fuel the demand for advanced bed head panels in the coming years, presenting a promising outlook for the United States bed head panels market.

A Beacon of Advanced Healthcare Infrastructure in the United Kingdom

As per the latest research report, the United Kingdom has emerged as a significant market in the global market, securing substantial revenue generation. The United Kingdom boasts some of the most advanced technology and well-established infrastructure globally, perfectly poised to meet the increasing demand for bed head panels in its intensive care units.
Pioneering Growth of the Surgical Operations in Germany Market

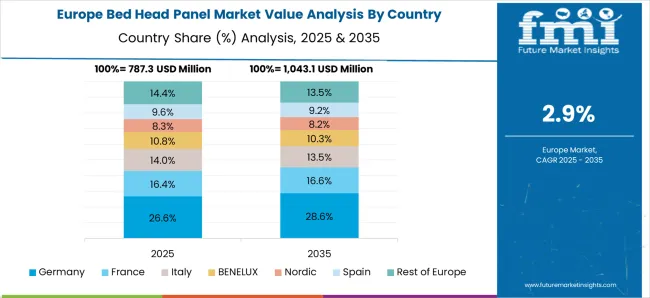
In Germany, a combination of factors is propelling the growth of the bed head panel market. The country has witnessed a rise in surgical operations and auto accidents, contributing to increased demand. Additionally, the presence of several key companies and the introduction of high-tech products further stimulate the expansion of the bed head panel market in Germany.

The Bed Head Panel Market is Leading in China

China is poised to take the lead in the regional bed head panel market, exhibiting a prominent share over the projected period. The country boasts a substantial patient base, coupled with a growing demand for technologically advanced yet affordable healthcare systems. These factors collectively provide significant growth potential for the bed head panel market adoption in the country.

The need for advanced equipment like bed head panels becomes increasingly crucial as China continues to develop and modernize its healthcare infrastructure.

Growing Healthcare Landscape and Bed Head Panel Market in India

The bed head panel market is experiencing significant expansion in India driven by several factors. Healthcare tourism is on the rise, attracting patients from around the world. Also international businesses are allocating significant research and development investments to tap into the region's emerging markets with affordable healthcare services.

India has witnessed a surge in hospitalizations, further stimulating the demand for bed head panels. The country is also making strides in improving its healthcare infrastructure development frameworks, offering a conducive environment for the market to flourish. These combined factors paint a promising picture for the bed head panel market's expansion in India.
Competitive Landscape

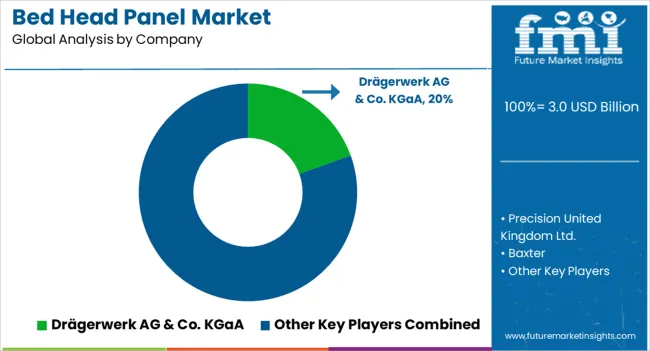
A few leading bed head panel market players are innovating to address critical care requirements and boost user confidence, fostering market expansion. The growing elderly population is expected to significantly impact market growth, driving manufacturers to develop competitive products. A few latest developments in the global bed head panel market are discussed below.

  • In January 2023, Baxter International Inc., a leading global MedTech company, announced a comprehensive strategic roadmap. The purpose behind this roadmap is to meaningfully enhance its operational effectiveness, drive toward improved long-term performance, and accelerate innovation,
  • In May 2023, AMICO Group, a UAE-based leader in the healthcare specialty market in Middle East and North America region, continued its digital transformation journey supported by technology company SAP SE. It is to enhance its customer experience and engagement through personalized, omnichannel solutions, increase agility, and enable future expansion plans.
  • In January 2023, BeaconMedaes, part of the Atlas Copco Group, added external service providers to its already extensive dedicated service team to better provide services to facilities.
  • In June 2023, NOVAIR shared the news that the only European manufacturer offering a DS-PSA oxygen generator capable of producing ultra-high purity oxygen on-site.

The patented Oxygen Generator Premium Plus SX produced pure Medical Oxygen up to 99.5% with exceptional stability (+/- 0.2%). Premium Plus SX is certified Medical Device Class IIB.

Bed Head Panel Market Report Scope

Attributes Details
Estimated Market Size in 2023 USD 2,847.9 million
Projected Market Valuation in 2033 USD 3,952.9 million
CAGR Share from 2023 to 2033 3.3%
Forecast Period 2023 to 2033
Historical Data Available for 2018 to 2022
Market Analysis Value in USD million
Key Regions Covered North America; Latin America; Western Europe; Eastern Europe; South Asia and Pacific; East Asia; The Middle East & Africa
Key Market Segments Covered Specialty Type, End-use, Region
Key Countries Profiled The United States, Canada, Brazil, Mexico, Germany, The United Kingdom, France, Spain, Italy, Russia, Poland, Czech Republic, Romania, India, Bangladesh, Australia, New Zealand, China, Japan, South Korea, GCC countries, South Africa, Israel
Key Companies Profiled Precision United Kingdom Ltd.; Baxter; Novair Medical; Amcaremed Medical; Amico Group of Companies; Drägerwerk AG & Co. KGaA; BIOLUME; BeaconMedaes; Silbermann; INMED

Bed Head Panel Market by Segmentation

By Specialty Type:

  • ICU
  • Surgical
  • Others

By End Use:

  • Hospitals
  • Clinics
  • Others

By Region:

  • North America
  • Latin America
  • Europe
  • East Asia
  • South Asia
  • Oceania
  • The Middle East and Africa

Table of Content

  • 1. Executive Summary
  • 2. Market Overview
  • 3. Market Background
  • 4. Global Market Analysis 2018 to 2022 and Forecast, 2023 to 2033
  • 5. Global Market Analysis 2018 to 2022 and Forecast 2023 to 2033, By Specialty Type
    • 5.1. ICU
    • 5.2. Surgical
    • 5.3. Others
  • 6. Global Market Analysis 2018 to 2022 and Forecast 2023 to 2033, By End Use
    • 6.1. Hospitals
    • 6.2. Clinics
    • 6.3. Others
  • 7. Global Market Analysis 2018 to 2022 and Forecast 2023 to 2033, By Region
    • 7.1. North America
    • 7.2. Latin America
    • 7.3. Western Europe
    • 7.4. Eastern Europe
    • 7.5. South Asia and Pacific
    • 7.6. East Asia
    • 7.7. Middle East and Africa
  • 8. North America Market Analysis 2018 to 2022 and Forecast 2023 to 2033, By Country
  • 9. Latin America Market Analysis 2018 to 2022 and Forecast 2023 to 2033, By Country
  • 10. Western Europe Market Analysis 2018 to 2022 and Forecast 2023 to 2033, By Country
  • 11. Eastern Europe Market Analysis 2018 to 2022 and Forecast 2023 to 2033, By Country
  • 12. South Asia and Pacific Market Analysis 2018 to 2022 and Forecast 2023 to 2033, By Country
  • 13. East Asia Market Analysis 2018 to 2022 and Forecast 2023 to 2033, By Country
  • 14. Middle East and Africa Market Analysis 2018 to 2022 and Forecast 2023 to 2033, By Country
  • 15. Key Countries Market Analysis
  • 16. Market Structure Analysis
  • 17. Competition Analysis
    • 17.1. Precision Value (USD Million) & Volume (Units)
    • 17.2. Baxter
    • 17.3. Novair Medical
    • 17.4. Amcaremed Medical
    • 17.5. Amico Group of Companies
    • 17.6. Drägerwerk AG & Co. KGaA
    • 17.7. BIOLUME
    • 17.8. BeaconMedaes
    • 17.9. Silbermann
    • 17.10. INMED
  • 18. Assumptions & Acronyms Used
  • 19. Research Methodology

List of Tables

Table 1: Global Market Value (US$ Million) Forecast by Region, 2018 to 2033

Table 2: Global Market Volume (Units) Forecast by Region, 2018 to 2033

Table 3: Global Market Value (US$ Million) Forecast by Specialty Type, 2018 to 2033

Table 4: Global Market Volume (Units) Forecast by Specialty Type, 2018 to 2033

Table 5: Global Market Value (US$ Million) Forecast by End Use, 2018 to 2033

Table 6: Global Market Volume (Units) Forecast by End Use, 2018 to 2033

Table 7: North America Market Value (US$ Million) Forecast by Country, 2018 to 2033

Table 8: North America Market Volume (Units) Forecast by Country, 2018 to 2033

Table 9: North America Market Value (US$ Million) Forecast by Specialty Type, 2018 to 2033

Table 10: North America Market Volume (Units) Forecast by Specialty Type, 2018 to 2033

Table 11: North America Market Value (US$ Million) Forecast by End Use, 2018 to 2033

Table 12: North America Market Volume (Units) Forecast by End Use, 2018 to 2033

Table 13: Latin America Market Value (US$ Million) Forecast by Country, 2018 to 2033

Table 14: Latin America Market Volume (Units) Forecast by Country, 2018 to 2033

Table 15: Latin America Market Value (US$ Million) Forecast by Specialty Type, 2018 to 2033

Table 16: Latin America Market Volume (Units) Forecast by Specialty Type, 2018 to 2033

Table 17: Latin America Market Value (US$ Million) Forecast by End Use, 2018 to 2033

Table 18: Latin America Market Volume (Units) Forecast by End Use, 2018 to 2033

Table 19: Western Europe Market Value (US$ Million) Forecast by Country, 2018 to 2033

Table 20: Western Europe Market Volume (Units) Forecast by Country, 2018 to 2033

Table 21: Western Europe Market Value (US$ Million) Forecast by Specialty Type, 2018 to 2033

Table 22: Western Europe Market Volume (Units) Forecast by Specialty Type, 2018 to 2033

Table 23: Western Europe Market Value (US$ Million) Forecast by End Use, 2018 to 2033

Table 24: Western Europe Market Volume (Units) Forecast by End Use, 2018 to 2033

Table 25: Eastern Europe Market Value (US$ Million) Forecast by Country, 2018 to 2033

Table 26: Eastern Europe Market Volume (Units) Forecast by Country, 2018 to 2033

Table 27: Eastern Europe Market Value (US$ Million) Forecast by Specialty Type, 2018 to 2033

Table 28: Eastern Europe Market Volume (Units) Forecast by Specialty Type, 2018 to 2033

Table 29: Eastern Europe Market Value (US$ Million) Forecast by End Use, 2018 to 2033

Table 30: Eastern Europe Market Volume (Units) Forecast by End Use, 2018 to 2033

Table 31: South Asia and Pacific Market Value (US$ Million) Forecast by Country, 2018 to 2033

Table 32: South Asia and Pacific Market Volume (Units) Forecast by Country, 2018 to 2033

Table 33: South Asia and Pacific Market Value (US$ Million) Forecast by Specialty Type, 2018 to 2033

Table 34: South Asia and Pacific Market Volume (Units) Forecast by Specialty Type, 2018 to 2033

Table 35: South Asia and Pacific Market Value (US$ Million) Forecast by End Use, 2018 to 2033

Table 36: South Asia and Pacific Market Volume (Units) Forecast by End Use, 2018 to 2033

Table 37: East Asia Market Value (US$ Million) Forecast by Country, 2018 to 2033

Table 38: East Asia Market Volume (Units) Forecast by Country, 2018 to 2033

Table 39: East Asia Market Value (US$ Million) Forecast by Specialty Type, 2018 to 2033

Table 40: East Asia Market Volume (Units) Forecast by Specialty Type, 2018 to 2033

Table 41: East Asia Market Value (US$ Million) Forecast by End Use, 2018 to 2033

Table 42: East Asia Market Volume (Units) Forecast by End Use, 2018 to 2033

Table 43: Middle East and Africa Market Value (US$ Million) Forecast by Country, 2018 to 2033

Table 44: Middle East and Africa Market Volume (Units) Forecast by Country, 2018 to 2033

Table 45: Middle East and Africa Market Value (US$ Million) Forecast by Specialty Type, 2018 to 2033

Table 46: Middle East and Africa Market Volume (Units) Forecast by Specialty Type, 2018 to 2033

Table 47: Middle East and Africa Market Value (US$ Million) Forecast by End Use, 2018 to 2033

Table 48: Middle East and Africa Market Volume (Units) Forecast by End Use, 2018 to 2033

List of Figures

Figure 1: Global Market Value (US$ Million) by Specialty Type, 2023 to 2033

Figure 2: Global Market Value (US$ Million) by End Use, 2023 to 2033

Figure 3: Global Market Value (US$ Million) by Region, 2023 to 2033

Figure 4: Global Market Value (US$ Million) Analysis by Region, 2018 to 2033

Figure 5: Global Market Volume (Units) Analysis by Region, 2018 to 2033

Figure 6: Global Market Value Share (%) and BPS Analysis by Region, 2023 to 2033

Figure 7: Global Market Y-o-Y Growth (%) Projections by Region, 2023 to 2033

Figure 8: Global Market Value (US$ Million) Analysis by Specialty Type, 2018 to 2033

Figure 9: Global Market Volume (Units) Analysis by Specialty Type, 2018 to 2033

Figure 10: Global Market Value Share (%) and BPS Analysis by Specialty Type, 2023 to 2033

Figure 11: Global Market Y-o-Y Growth (%) Projections by Specialty Type, 2023 to 2033

Figure 12: Global Market Value (US$ Million) Analysis by End Use, 2018 to 2033

Figure 13: Global Market Volume (Units) Analysis by End Use, 2018 to 2033

Figure 14: Global Market Value Share (%) and BPS Analysis by End Use, 2023 to 2033

Figure 15: Global Market Y-o-Y Growth (%) Projections by End Use, 2023 to 2033

Figure 16: Global Market Attractiveness by Specialty Type, 2023 to 2033

Figure 17: Global Market Attractiveness by End Use, 2023 to 2033

Figure 18: Global Market Attractiveness by Region, 2023 to 2033

Figure 19: North America Market Value (US$ Million) by Specialty Type, 2023 to 2033

Figure 20: North America Market Value (US$ Million) by End Use, 2023 to 2033

Figure 21: North America Market Value (US$ Million) by Country, 2023 to 2033

Figure 22: North America Market Value (US$ Million) Analysis by Country, 2018 to 2033

Figure 23: North America Market Volume (Units) Analysis by Country, 2018 to 2033

Figure 24: North America Market Value Share (%) and BPS Analysis by Country, 2023 to 2033

Figure 25: North America Market Y-o-Y Growth (%) Projections by Country, 2023 to 2033

Figure 26: North America Market Value (US$ Million) Analysis by Specialty Type, 2018 to 2033

Figure 27: North America Market Volume (Units) Analysis by Specialty Type, 2018 to 2033

Figure 28: North America Market Value Share (%) and BPS Analysis by Specialty Type, 2023 to 2033

Figure 29: North America Market Y-o-Y Growth (%) Projections by Specialty Type, 2023 to 2033

Figure 30: North America Market Value (US$ Million) Analysis by End Use, 2018 to 2033

Figure 31: North America Market Volume (Units) Analysis by End Use, 2018 to 2033

Figure 32: North America Market Value Share (%) and BPS Analysis by End Use, 2023 to 2033

Figure 33: North America Market Y-o-Y Growth (%) Projections by End Use, 2023 to 2033

Figure 34: North America Market Attractiveness by Specialty Type, 2023 to 2033

Figure 35: North America Market Attractiveness by End Use, 2023 to 2033

Figure 36: North America Market Attractiveness by Country, 2023 to 2033

Figure 37: Latin America Market Value (US$ Million) by Specialty Type, 2023 to 2033

Figure 38: Latin America Market Value (US$ Million) by End Use, 2023 to 2033

Figure 39: Latin America Market Value (US$ Million) by Country, 2023 to 2033

Figure 40: Latin America Market Value (US$ Million) Analysis by Country, 2018 to 2033

Figure 41: Latin America Market Volume (Units) Analysis by Country, 2018 to 2033

Figure 42: Latin America Market Value Share (%) and BPS Analysis by Country, 2023 to 2033

Figure 43: Latin America Market Y-o-Y Growth (%) Projections by Country, 2023 to 2033

Figure 44: Latin America Market Value (US$ Million) Analysis by Specialty Type, 2018 to 2033

Figure 45: Latin America Market Volume (Units) Analysis by Specialty Type, 2018 to 2033

Figure 46: Latin America Market Value Share (%) and BPS Analysis by Specialty Type, 2023 to 2033

Figure 47: Latin America Market Y-o-Y Growth (%) Projections by Specialty Type, 2023 to 2033

Figure 48: Latin America Market Value (US$ Million) Analysis by End Use, 2018 to 2033

Figure 49: Latin America Market Volume (Units) Analysis by End Use, 2018 to 2033

Figure 50: Latin America Market Value Share (%) and BPS Analysis by End Use, 2023 to 2033

Figure 51: Latin America Market Y-o-Y Growth (%) Projections by End Use, 2023 to 2033

Figure 52: Latin America Market Attractiveness by Specialty Type, 2023 to 2033

Figure 53: Latin America Market Attractiveness by End Use, 2023 to 2033

Figure 54: Latin America Market Attractiveness by Country, 2023 to 2033

Figure 55: Western Europe Market Value (US$ Million) by Specialty Type, 2023 to 2033

Figure 56: Western Europe Market Value (US$ Million) by End Use, 2023 to 2033

Figure 57: Western Europe Market Value (US$ Million) by Country, 2023 to 2033

Figure 58: Western Europe Market Value (US$ Million) Analysis by Country, 2018 to 2033

Figure 59: Western Europe Market Volume (Units) Analysis by Country, 2018 to 2033

Figure 60: Western Europe Market Value Share (%) and BPS Analysis by Country, 2023 to 2033

Figure 61: Western Europe Market Y-o-Y Growth (%) Projections by Country, 2023 to 2033

Figure 62: Western Europe Market Value (US$ Million) Analysis by Specialty Type, 2018 to 2033

Figure 63: Western Europe Market Volume (Units) Analysis by Specialty Type, 2018 to 2033

Figure 64: Western Europe Market Value Share (%) and BPS Analysis by Specialty Type, 2023 to 2033

Figure 65: Western Europe Market Y-o-Y Growth (%) Projections by Specialty Type, 2023 to 2033

Figure 66: Western Europe Market Value (US$ Million) Analysis by End Use, 2018 to 2033

Figure 67: Western Europe Market Volume (Units) Analysis by End Use, 2018 to 2033

Figure 68: Western Europe Market Value Share (%) and BPS Analysis by End Use, 2023 to 2033

Figure 69: Western Europe Market Y-o-Y Growth (%) Projections by End Use, 2023 to 2033

Figure 70: Western Europe Market Attractiveness by Specialty Type, 2023 to 2033

Figure 71: Western Europe Market Attractiveness by End Use, 2023 to 2033

Figure 72: Western Europe Market Attractiveness by Country, 2023 to 2033

Figure 73: Eastern Europe Market Value (US$ Million) by Specialty Type, 2023 to 2033

Figure 74: Eastern Europe Market Value (US$ Million) by End Use, 2023 to 2033

Figure 75: Eastern Europe Market Value (US$ Million) by Country, 2023 to 2033

Figure 76: Eastern Europe Market Value (US$ Million) Analysis by Country, 2018 to 2033

Figure 77: Eastern Europe Market Volume (Units) Analysis by Country, 2018 to 2033

Figure 78: Eastern Europe Market Value Share (%) and BPS Analysis by Country, 2023 to 2033

Figure 79: Eastern Europe Market Y-o-Y Growth (%) Projections by Country, 2023 to 2033

Figure 80: Eastern Europe Market Value (US$ Million) Analysis by Specialty Type, 2018 to 2033

Figure 81: Eastern Europe Market Volume (Units) Analysis by Specialty Type, 2018 to 2033

Figure 82: Eastern Europe Market Value Share (%) and BPS Analysis by Specialty Type, 2023 to 2033

Figure 83: Eastern Europe Market Y-o-Y Growth (%) Projections by Specialty Type, 2023 to 2033

Figure 84: Eastern Europe Market Value (US$ Million) Analysis by End Use, 2018 to 2033

Figure 85: Eastern Europe Market Volume (Units) Analysis by End Use, 2018 to 2033

Figure 86: Eastern Europe Market Value Share (%) and BPS Analysis by End Use, 2023 to 2033

Figure 87: Eastern Europe Market Y-o-Y Growth (%) Projections by End Use, 2023 to 2033

Figure 88: Eastern Europe Market Attractiveness by Specialty Type, 2023 to 2033

Figure 89: Eastern Europe Market Attractiveness by End Use, 2023 to 2033

Figure 90: Eastern Europe Market Attractiveness by Country, 2023 to 2033

Figure 91: South Asia and Pacific Market Value (US$ Million) by Specialty Type, 2023 to 2033

Figure 92: South Asia and Pacific Market Value (US$ Million) by End Use, 2023 to 2033

Figure 93: South Asia and Pacific Market Value (US$ Million) by Country, 2023 to 2033

Figure 94: South Asia and Pacific Market Value (US$ Million) Analysis by Country, 2018 to 2033

Figure 95: South Asia and Pacific Market Volume (Units) Analysis by Country, 2018 to 2033

Figure 96: South Asia and Pacific Market Value Share (%) and BPS Analysis by Country, 2023 to 2033

Figure 97: South Asia and Pacific Market Y-o-Y Growth (%) Projections by Country, 2023 to 2033

Figure 98: South Asia and Pacific Market Value (US$ Million) Analysis by Specialty Type, 2018 to 2033

Figure 99: South Asia and Pacific Market Volume (Units) Analysis by Specialty Type, 2018 to 2033

Figure 100: South Asia and Pacific Market Value Share (%) and BPS Analysis by Specialty Type, 2023 to 2033

Figure 101: South Asia and Pacific Market Y-o-Y Growth (%) Projections by Specialty Type, 2023 to 2033

Figure 102: South Asia and Pacific Market Value (US$ Million) Analysis by End Use, 2018 to 2033

Figure 103: South Asia and Pacific Market Volume (Units) Analysis by End Use, 2018 to 2033

Figure 104: South Asia and Pacific Market Value Share (%) and BPS Analysis by End Use, 2023 to 2033

Figure 105: South Asia and Pacific Market Y-o-Y Growth (%) Projections by End Use, 2023 to 2033

Figure 106: South Asia and Pacific Market Attractiveness by Specialty Type, 2023 to 2033

Figure 107: South Asia and Pacific Market Attractiveness by End Use, 2023 to 2033

Figure 108: South Asia and Pacific Market Attractiveness by Country, 2023 to 2033

Figure 109: East Asia Market Value (US$ Million) by Specialty Type, 2023 to 2033

Figure 110: East Asia Market Value (US$ Million) by End Use, 2023 to 2033

Figure 111: East Asia Market Value (US$ Million) by Country, 2023 to 2033

Figure 112: East Asia Market Value (US$ Million) Analysis by Country, 2018 to 2033

Figure 113: East Asia Market Volume (Units) Analysis by Country, 2018 to 2033

Figure 114: East Asia Market Value Share (%) and BPS Analysis by Country, 2023 to 2033

Figure 115: East Asia Market Y-o-Y Growth (%) Projections by Country, 2023 to 2033

Figure 116: East Asia Market Value (US$ Million) Analysis by Specialty Type, 2018 to 2033

Figure 117: East Asia Market Volume (Units) Analysis by Specialty Type, 2018 to 2033

Figure 118: East Asia Market Value Share (%) and BPS Analysis by Specialty Type, 2023 to 2033

Figure 119: East Asia Market Y-o-Y Growth (%) Projections by Specialty Type, 2023 to 2033

Figure 120: East Asia Market Value (US$ Million) Analysis by End Use, 2018 to 2033

Figure 121: East Asia Market Volume (Units) Analysis by End Use, 2018 to 2033

Figure 122: East Asia Market Value Share (%) and BPS Analysis by End Use, 2023 to 2033

Figure 123: East Asia Market Y-o-Y Growth (%) Projections by End Use, 2023 to 2033

Figure 124: East Asia Market Attractiveness by Specialty Type, 2023 to 2033

Figure 125: East Asia Market Attractiveness by End Use, 2023 to 2033

Figure 126: East Asia Market Attractiveness by Country, 2023 to 2033

Figure 127: Middle East and Africa Market Value (US$ Million) by Specialty Type, 2023 to 2033

Figure 128: Middle East and Africa Market Value (US$ Million) by End Use, 2023 to 2033

Figure 129: Middle East and Africa Market Value (US$ Million) by Country, 2023 to 2033

Figure 130: Middle East and Africa Market Value (US$ Million) Analysis by Country, 2018 to 2033

Figure 131: Middle East and Africa Market Volume (Units) Analysis by Country, 2018 to 2033

Figure 132: Middle East and Africa Market Value Share (%) and BPS Analysis by Country, 2023 to 2033

Figure 133: Middle East and Africa Market Y-o-Y Growth (%) Projections by Country, 2023 to 2033

Figure 134: Middle East and Africa Market Value (US$ Million) Analysis by Specialty Type, 2018 to 2033

Figure 135: Middle East and Africa Market Volume (Units) Analysis by Specialty Type, 2018 to 2033

Figure 136: Middle East and Africa Market Value Share (%) and BPS Analysis by Specialty Type, 2023 to 2033

Figure 137: Middle East and Africa Market Y-o-Y Growth (%) Projections by Specialty Type, 2023 to 2033

Figure 138: Middle East and Africa Market Value (US$ Million) Analysis by End Use, 2018 to 2033

Figure 139: Middle East and Africa Market Volume (Units) Analysis by End Use, 2018 to 2033

Figure 140: Middle East and Africa Market Value Share (%) and BPS Analysis by End Use, 2023 to 2033

Figure 141: Middle East and Africa Market Y-o-Y Growth (%) Projections by End Use, 2023 to 2033

Figure 142: Middle East and Africa Market Attractiveness by Specialty Type, 2023 to 2033

Figure 143: Middle East and Africa Market Attractiveness by End Use, 2023 to 2033

Figure 144: Middle East and Africa Market Attractiveness by Country, 2023 to 2033

Frequently Asked Questions

What is the Current Market Valuation?

The bed head panel market is expected to reach a valuation of USD 2,847.9 million in 2023.

What is Germany’s Market Outlook?

Germany registered a market share of 8.7% in 2023.

What is the Projected CAGR for the Bed Head Panel Market through 2033?

The bed head panel market is set to expand at a CAGR of 3.3% by 2033.

How much Valuation is Projected for the Bed Head Panel Market in 2033?

The bed head panel market is forecasted to reach USD 3,952.9 million by 2033.

Which is the Leading End use in the Bed Head Panel Market?

Hospitals are preferred and expected to rise at a market share of 41.2% through 2033.

Explore Vertical Solution Insights

Future Market Insights

Bed Head Panel Market