Embedded Lending Market
Market Insights on Embedded Lending covering sales outlook, demand forecast & up-to-date key trends
Embedded Lending Market By Solution, Deployment, Enterprise Size, End User & Region | Forecast 2022 to 2032
Embedded Lending Market (2022 to 2032)
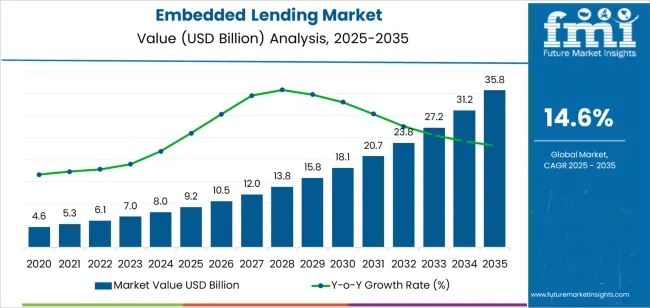
[250 Pages Report] Embedded lending market revenue totaled ~US$ 4.7 Billion in 2021. The embedded lending market is expected to reach ~US$ 32.5 Billion by 2032, growing at a CAGR of 19.4% from 2022 to 2032.
Estimated year (2022) Market Value |
US$ 5.5 Billion |
Projected year (2032) Market Value |
US$ 32.5 Billion |
CAGR% (2022 to 2032) |
19.4% |
Top 5 Vendor Market Share |
Around 35% |
Embedded lending arises when lending is offered through non-financial products or services. It eliminates the need to depend on paying third parties high costs, like financial institutions during the lending process. Instead, customers can access the capital with a few clicks. A business can fully integrate embedded lending services into its platform in ways that are customized to meet the demands of particular clients via a customizable API and white-label solutions.
In the recent era, embedded lending has gained a lot of traction as embedded lending allows businesses to offer customers a contextual experience that enlarges product stickiness and customer engagement, and retention reduces customer churn which results in higher customer switching costs, expands revenue streams, and gives quicker access to capital. Embedded lending comprises 12% of the embedded finance market.
Let us know your requirement to get
100% FREE customization
PSD2 and Open Banking Regulations Have Aided in the Growth of Embedded Lending
Open banking is a collaborative business strategy that enables two or more independent parties to share financial data via APIs in order to provide the market with better capabilities. PSD2 and open banking regulations are promoting the development of banking APIs and universal access. Government legislation imposed on banks through PSD2 required them to permit third parties to access data that consumers have authorized.
PSD2 has demonstrated to be a significant customer benefit in allowing real, data-driven innovation by spurring innovation and incentivizing non-financial institutions to take advantage of Open Banking-related activities. Further, the legislation gives customers more options and control over their financial information and payments, etc.
Due to their enhanced access to consumer data, embedded lending companies have identified opportunities for innovation. Companies that employ Open Banking link a user's different bank accounts to one platform, increasing awareness of the user's financial situation. PSD2 may open up opportunities for better data accessibility, quicker transactions, and more engaging user experiences. Thus, this eventually increases the demand for the embedded lending market.
2017 to 2021 Embedded Lending Demand Outlook Compared to 2022 to 2032 Forecast
The embedded lending demand is estimated to grow at a CAGR of 19.4% between 2022 and 2032. One of the main reasons for this market growth is because consumer demand for quick and easy access to credit, the rise of digitalization, and technological advancement.
Increasing customer demands paired with digitalization. The requirement for collateral and credit history to borrow money from banks were major pain points for clients that led to the development of embedded lending. Today, there is a growing usage of advanced technology to simplify consumer lending and support a strong cashless and digital economy.
Find your sweet spots for generating winning opportunities in this market.
Talk to AnalystRise of Digitalization and Technological Advancement will create lucrative opportunities for Embedded Lending Market
Digitalization enables businesses to provide credit to customers more effectively and without involving financial institutions. Lending is also less expensive and simpler to customize to the needs of the company and its clients. By providing consumers and businesses with small installment loans, vendors are also using the credit markets to help them acquire the tools and services they require to succeed.
Consumer data is expanding rapidly. Vendors may access, analyze, and make important judgments based on consumer behavior and recent market trends based on data collection at a central repository.
AI technology is designed to modernize and simplify administrative operations, freeing up personnel from time-consuming activities so they can concentrate on building relationships with customers. AI-driven interactions enable quick turnaround times for risk and compliance duties as well as seamless customer onboarding. Such satisfying customer experiences can increase brand loyalty and word-of-mouth advertising. Predictive banking is another area where artificial intelligence might enable client engagement and retention. It makes it possible to compile and analyze unstructured data in order to better understand it and get insightful conclusions in the data-driven lending sector. The rise of AI can aid in the detection and eradication of fraud.
Robotic process automation (RPA) is used to quickly handle exceptions and process loan initiation, documentation, comparisons, and verifications. Businesses may rapidly reply to customer inquiries and turn them into sales when RPA is used in conjunction with the appropriate APIs. Fast adoption of technology, investments in strategic skillsets, and timely use of data can create lucrative opportunities in embedded lending.
Regional Analysis
South Asia and the Pacific region are estimated to be the fastest-growing region in the embedded lending market with a 21.3% CAGR during the forecast period. The top embedded lending companies in the world are located in South Asia and the Pacific. The South Asia and Pacific area is now a global leader in fintech innovations due to the increasing number of technological developments produced by vendors. Demand and market expansion are mostly driven by the presence of an increasing population of tech-savvy individuals who have access to smartphones.
The rapid expansion of digitization in developing nations like Indonesia, Malaysia, and India is also grabbing the interest of industry participants. Half of all internet users live in South Asia and the Pacific. The South Asia and Pacific fintech trends suggest that this industry will expand as more people innovate and found new startups to compete in the market. This has led to an increase in the adoption of embedded lending in the region.

A unified Market Research Subscription Platform, built for today's disparate research needs.
Country-wise Insights
How big is the Opportunity for the Adoption of Embedded Lending in India?
The South Asia and Pacific region is expected to remain an attractive market during the forecast period. According to the study, India is predicted to increase at a rate of around 24.1% CAGR between 2022 and 2032. The embedded lending field has been undergoing a huge transformation due to rising digitization. However, the main forces underlying the expansion of India's embedded lending market are the simplicity and convenience of credit access.
Why is Demand for Embedded Lending increasing in China?
The demand for embedded lending in China is expected to account for nearly 19.3% CAGR by 2032. The enormous increase in e-commerce sales and the steadily rising popularity of embedded lending options are key elements in luring foreign investment to the nation. Additionally, China is expected to experience enormous development as a result of the government's increasing efforts to promote the online credit market.
How big is the Opportunity for the Adoption of Embedded Lending in Japan?
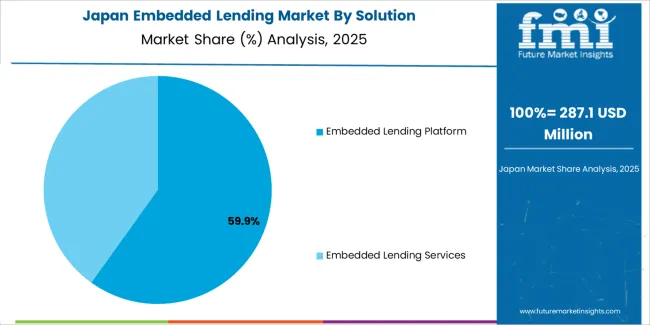
The sales revenue in Japan is estimated to grow at an impressive rate of around 21.7% CAGR between 2022 and 2032. The covid-19 pandemic has accelerated the growth of Japan's e-commerce industry, and as more Japanese consumers adopt online shopping, electronic payments are growing in popularity. In Japan, there is a growing need for convenient payment methods, and market participants are vying for customers' business in an increasingly cutthroat environment. Additionally, industry participants are introducing new items to draw in more customers in Japan and take advantage of the lucrative opportunity.
Category-wise Insights
How Embedded lending platform will drive the overall growth of the Embedded Lending Market?
The embedded lending platform segment is expected to showcase a higher CAGR in the coming years. This segment is predicted to grow at 20.2% CAGR by the end of 2032. Embedded lending platforms aim to make the buying process as smooth as possible, giving customers more options and often not applicable to big purchases, with a “buy now and pay later” policy. It offers an alternative to the "pay" approach. An Embedded lending platform also enables financial institutions to access a market of distributors and dealers to sell banking products.
How Small and Mid-Sized Enterprises Contribute to the Growth of the Embedded Lending Market?
The sales revenue in small and mid-sized enterprises is estimated to grow at an impressive rate of around 19.9% CAGR between 2022 and 2032. Also, owing to the rapid embedded lending adoption, this segment is expected to showcase a strong CAGR over the forecast period. Embedded lending vendors provide a range of payments, loans, e-commerce, marketplaces, and social media platforms for cloud-based financial management, accounting, collaboration, and productivity solutions. These platforms not only have high penetration in the small business market, but they are also highly trusted among small business owners. In addition, it is crucial for SMEs to have access to cash that can increase their bottom line. It might support fixed costs and assist in turning a profit. This profitability eventually turns into retained earnings or dividends that are reinvested in the economy to promote further expansion.
What role does Retail Sector play in Supporting the Growth of Embedded Lending?
The Retail segment holds the largest share of 22.6% in 2021. Digital wallet use will rise, as will the use of flexible financing options including point-of-sale lending and "Buy Now Pay Later" services. This is due to the digitalization of retail services. The advent of mobile devices has changed consumer purchasing and transaction channels. Consumer prefers complete EMI options of payment, credit, or no charge on the same platform. Cart abandonment, where a customer abandons the website before a customer purchases the items in their cart, is a headache for businesses. No cash at the moment is the most prominent reason. Embedded Lending mitigate this by using POS i.e. point of Sale loan providers. This increases consumer purchase rates and ultimately profits. Thus, this trend has increased the adoption of embedded lending in the retail sector.
Competitive Landscape
Embedded lending providers are developing tactics like a strategic partnerships, and product innovation to increase their service offerings and technology to better satisfy customer needs. In order to satisfy end-user expectations and increase their client base, many companies are also working with technology experts to develop their own cutting-edge solutions.
- In August 2021, Banxware formed a strategic partnership with receive. Customers can manage pending claims and handle challenging circumstances with the help of the partnership's simple-to-use tool. The cutting-edge technology from Receive combines analytical and tactical capabilities for teams in a single solution. It is also quick and easy to incorporate into systems and gives organizations the capacity to protect liquidity while driving revenue growth.
- In December 2021, Turnkey lender announced their partnership with LoanPaymentPro to provide their customers more flexibility over the technologies used for loan origination, underwriting, service, collection, fund distribution, and debt repayment. This alliance offers lenders who want a deeper understanding of their business and foster a more trustworthy connection with their borrowers full-service, end-to-end solutions.
Scope of Report
Attribute |
Details |
Market value in 2022 |
US$ 5.5 Billion |
Market CAGR 2022 to 2032 |
19.4% |
Share of top 5 players |
Around 35% |
Forecast Period |
2022 to 2032 |
Historical Data Available for |
2017 to 2021 |
Market Analysis |
USD Billion for Value |
Key Regions Covered |
North America, Latin America, Europe, East Asia, South Asia & Pacific, and the Middle East & Africa (MEA) |
Key Countries Covered |
US, Canada, UK, Germany, France, Italy, Spain, Benelux, Russia, China, Japan, South Korea, India, Malaysia, Indonesia, Singapore, Australia & New Zealand, GCC Countries, Turkey, South Africa |
Key Segments Covered |
The solution, Deployment, Enterprise Size, Industry, and Region |
Key Companies Profiled |
|
Report Coverage |
Market Forecast, Company Share Analysis, Competition Intelligence, DROT Analysis, Market Dynamics and Challenges, and Strategic Growth Initiatives |
Customization & Pricing |
Available upon Request |
Embedded Lending Outlook by Category
By Solution, the Embedded Lending Market is segmented as:
- Embedded Lending Platform
- Embedded Lending Services
By Deployment, the Embedded Lending Market is segmented as:
- Cloud / Web Based
- On-Premise
By Enterprise Size, the Embedded Lending Market is segmented as:
- Small & Mid-sized Enterprises (SMEs)
- Large Enterprises
By Industry, the Embedded Lending Market is segmented as:
- Retail
- Education
- Medical & Healthcare
- IT / IT Services
- Real Estate
- Manufacturing
- Transportation
- Others
By Region, the Embedded Lending Market is segmented as:
- North America
- Latin America
- Europe
- East Asia
- South Asia & Pacific
- Middle East and Africa (MEA)
Frequently Asked Questions
Which region is expected to show high growth in Embedded Lending demand?
South Asia & Pacific is forecasted to deliver strong growth in the market, demonstrating a CAGR of nearly 21.3% during the forecast period with a market share of around 13.9% in 2022.
What are the key trends of Embedded Lending industry?
Key trends in the market includes: • PSD2 and Open Banking Regulations Have Aided in the Growth of Embedded Lending • Rise of Digitalization and Technological Advancement
Which is the leading Solution Segment in Embedded Lending Market?
Embedded lending platform dominates the market with the highest market share of 61.2% in 2021.
How much is the global Embedded Lending Market worth by 2032?
The embedded lending industry was valued at ~US$ 4.7 Billion in 2021 and is estimated to grow at a substantial pace with a CAGR of 19.4% to reach ~US$ 32.5 Billion by 2032.
What will be the demand outlook/ sales forecast for Embedded Lending Market?
The sales of embedded lending are expected to total ~US$ 5.5 Billion by the end of 2022 and are likely to reach ~US$ 32.5 Billion by 2032.
What is the CAGR for forecasted year 2022 to 2032 for Embedded Lending Market?
The forecasted year CAGR from 2022 to 2032 is 19.4%.
Which countries are key providers of Embedded Lending Market?
Countries involved in providing embedded lending include the US, Germany, Japan, and China.
At what rate did the need for Embedded Lending grow during 2021 to 2022?
The global market growth between 2021 and 2022 is around 18.3%.
Which are the top countries driving demand?
The top 5 countries driving demand for embedded lending include India, China, Japan, Germany, UK
Who are the top companies offering Embedded Lending?
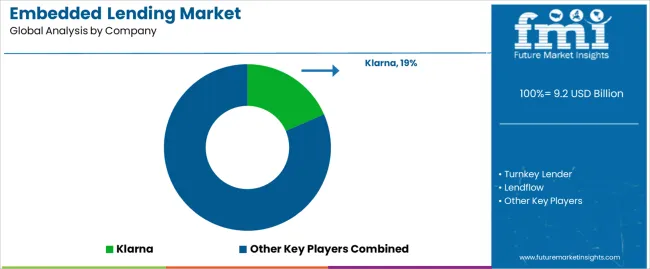
Some of the leading companies in this landscape are Turnkey Lender, Lendflow, Afterpay, Banxware, and Affirm. As per Future Market Insights, nearly 35% of the market share is currently covered by the top players.
Table of Content
1. Executive Summary | Embedded Lending Market 1.1. Global Market Outlook 1.2. Demand Side Trends 1.3. Supply Side Trends 1.4. Analysis and Recommendations 2. Market Overview 2.1. Market Coverage / Taxonomy 2.2. Market Definition / Scope / Limitations 3. Key Market Trends 3.1. Key Trends Impacting the Market 3.2. Product Innovation / Development Trends 4. Pricing Analysis 4.1. Type of Pricing Models 4.2. Global Average Pricing Analysis Benchmark 5. Global Market Demand (in Value in US$ Million) Analysis 2017 to 2021 and Forecast, 2022 to 2032 5.1. Historical Market Value (US$ Million) Analysis, 2017 to 2021 5.2. Current and Future Market Value (US$ Million) Projections, 2022 to 2032 5.2.1. Y-o-Y Growth Trend Analysis 5.2.2. Absolute $ Opportunity Analysis 6. Market Background 6.1. Macro-Economic Factors 6.2. Forecast Factors - Relevance & Impact 6.3. Value Chain 6.4. Market Dynamics 6.4.1. Drivers 6.4.2. Restraints 6.4.3. Opportunities 7. Global Market Analysis 2017 to 2021 and Forecast 2022 to 2032, By Solution 7.1. Introduction / Key Findings 7.2. Historical Market Size (US$ Million) Analysis By Solution, 2017 to 2021 7.3. Current and Future Market Size (US$ Million) Analysis and Forecast By Solution, 2022 to 2032 7.3.1. Platform 7.3.2. Services 7.4. Market Attractiveness Analysis By Solution 8. Global Market Analysis 2017 to 2021 and Forecast 2022 to 2032, By Deployment 8.1. Introduction / Key Findings 8.2. Historical Market Size (US$ Million) Analysis By Deployment, 2017 to 2021 8.3. Current and Future Market Size (US$ Million) Analysis and Forecast By Deployment, 2022 to 2032 8.3.1. Cloud / Web Based 8.3.2. On-Premise 8.4. Market Attractiveness Analysis By Deployment 9. Global Market Analysis 2017 to 2021 and Forecast 2022 to 2032, By Enterprise Size 9.1. Introduction / Key Findings 9.2. Historical Market Size (US$ Million) Analysis By Enterprise Size, 2017 to 2021 9.3. Current and Future Market Size (US$ Million) Analysis and Forecast By Enterprise Size, 2022 to 2032 9.3.1. Small and Mid-Sized Enterprises (SMEs) 9.3.2. Large Enterprises 9.4. Market Attractiveness Analysis By Enterprise Size 10. Global Market Analysis 2017 to 2021 and Forecast 2022 to 2032, By Industry 10.1. Introduction / Key Findings 10.2. Historical Market Size (US$ Million) Analysis By Industry, 2017 to 2021 10.3. Current and Future Market Size (US$ Million) Analysis and Forecast By Industry, 2022 to 2032 10.3.1. Retail 10.3.2. Education 10.3.3. Medical & Healthcare 10.3.4. IT/IT Services 10.3.5. Real Estate 10.3.6. Manufacturing 10.3.7. Transportation 10.3.8. Others 10.4. Market Attractiveness Analysis By Industry 11. Global Market Analysis 2017 to 2021 and Forecast 2022 to 2032, by Region 11.1. Introduction / Key Findings 11.2. Historical Market Size (US$ Million) Analysis By Region, 2017 to 2021 11.3. Current and Future Market Size (US$ Million) Analysis and Forecast By Region, 2022 to 2032 11.3.1. North America 11.3.2. Latin America 11.3.3. Europe 11.3.4. East Asia 11.3.5. South Asia & Pacific 11.3.6. Middle East & Africa (MEA) 11.4. Market Attractiveness Analysis By Region 12. North America Market Analysis 2017 to 2021 and Forecast 2022 to 2032 12.1. Introduction 12.2. Historical Market Size (US$ Million) Trend Analysis By Market Taxonomy, 2017 to 2021 12.3. Current and Future Market Size (US$ Million) Forecast By Market Taxonomy, 2022 to 2032 12.3.1. By Solution 12.3.2. By Deployment 12.3.3. By Enterprise Size 12.3.4. By Industry 12.3.5. By Country 12.3.5.1. The US 12.3.5.2. Canada 12.4. Market Attractiveness Analysis 12.4.1. By Solution 12.4.2. By Deployment 12.4.3. By Enterprise Size 12.4.4. By Industry 12.4.5. By Country 12.5. Market Trends 12.6. Key Market Participants - Intensity Mapping 13. Latin America Market Analysis 2017 to 2021 and Forecast 2022 to 2032 13.1. Introduction 13.2. Historical Market Size (US$ Million) Trend Analysis By Market Taxonomy, 2017 to 2021 13.3. Current and Future Market Size (US$ Million) Forecast By Market Taxonomy, 2022 to 2032 13.3.1. By Solution 13.3.2. By Deployment 13.3.3. By Enterprise Size 13.3.4. By Industry 13.3.5. By Country 13.3.5.1. Brazil 13.3.5.2. Mexico 13.3.5.3. Rest of Latin America 13.4. Market Attractiveness Analysis 13.4.1. By Solution 13.4.2. By Deployment 13.4.3. By Enterprise Size 13.4.4. By Industry 13.4.5. By Country 13.5. Market Trends 13.6. Key Market Participants - Intensity Mapping 14. Europe Market Analysis 2017 to 2021 and Forecast 2022 to 2032 14.1. Introduction 14.2. Historical Market Size (US$ Million) Trend Analysis By Market Taxonomy, 2017 to 2021 14.3. Current and Future Market Size (US$ Million) Forecast By Market Taxonomy, 2022 to 2032 14.3.1. By Solution 14.3.2. By Deployment 14.3.3. By Enterprise Size 14.3.4. By Industry 14.3.5. By Country 14.3.5.1. The UK 14.3.5.2. Germany 14.3.5.3. France 14.3.5.4. Italy 14.3.5.5. Spain 14.3.5.6. BENELUX 14.3.5.7. Russia 14.3.5.8. Rest of Europe 14.4. Market Attractiveness Analysis 14.4.1. By Solution 14.4.2. By Deployment 14.4.3. By Enterprise Size 14.4.4. By Industry 14.4.5. By Country 14.5. Market Trends 14.6. Key Market Participants - Intensity Mapping 15. South Asia & Pacific Market Analysis 2017 to 2021 and Forecast 2022 to 2032 15.1. Introduction 15.2. Historical Market Size (US$ Million) Trend Analysis By Market Taxonomy, 2017 to 2021 15.3. Current and Future Market Size (US$ Million) Forecast By Market Taxonomy, 2022 to 2032 15.3.1. By Solution 15.3.2. By Deployment 15.3.3. By Enterprise Size 15.3.4. By Industry 15.3.5. By Country 15.3.5.1. India 15.3.5.2. Indonesia 15.3.5.3. Malaysia 15.3.5.4. Singapore 15.3.5.5. Australia & New Zealand 15.3.5.6. Rest of South Asia and Pacific 15.4. Market Attractiveness Analysis 15.4.1. By Solution 15.4.2. By Deployment 15.4.3. By Enterprise Size 15.4.4. By Industry 15.4.5. By Country 15.5. Market Trends 15.6. Key Market Participants - Intensity Mapping 16. East Asia Market Analysis 2017 to 2021 and Forecast 2022 to 2032 16.1. Introduction 16.2. Historical Market Size (US$ Million) Trend Analysis By Market Taxonomy, 2017 to 2021 16.3. Current and Future Market Size (US$ Million) Forecast By Market Taxonomy, 2022 to 2032 16.3.1. By Solution 16.3.2. By Deployment 16.3.3. By Enterprise Size 16.3.4. By Industry 16.3.5. By Country 16.3.5.1. China 16.3.5.2. Japan 16.3.5.3. South Korea 16.4. Market Attractiveness Analysis 16.4.1. By Solution 16.4.2. By Deployment 16.4.3. By Enterprise Size 16.4.4. By Industry 16.4.5. By Country 16.5. Market Trends 16.6. Key Market Participants - Intensity Mapping 17. Middle East and Africa Market Analysis 2017 to 2021 and Forecast 2022 to 2032 17.1. Introduction 17.2. Historical Market Size (US$ Million) Trend Analysis By Market Taxonomy, 2017 to 2021 17.3. Current and Future Market Size (US$ Million) Forecast By Market Taxonomy, 2022 to 2032 17.3.1. By Solution 17.3.2. By Deployment 17.3.3. By Enterprise Size 17.3.4. By Industry 17.3.5. By Country 17.3.5.1. GCC Countries 17.3.5.2. Turkey 17.3.5.3. South Africa 17.3.5.4. Rest of Middle East and Africa 17.4. Market Attractiveness Analysis 17.4.1. By Solution 17.4.2. By Deployment 17.4.3. By Enterprise Size 17.4.4. By Industry 17.4.5. By Country 17.5. Market Trends 17.6. Key Market Participants - Intensity Mapping 18. Key Countries Analysis- Market 18.1. The US Market Analysis 18.1.1. By Solution 18.1.2. By Deployment 18.1.3. By Enterprise Size 18.1.4. By Industry 18.2. Canada Market Analysis 18.2.1. By Solution 18.2.2. By Deployment 18.2.3. By Enterprise Size 18.2.4. By Industry 18.3. Mexico Market Analysis 18.3.1. By Solution 18.3.2. By Deployment 18.3.3. By Enterprise Size 18.3.4. By Industry 18.4. Brazil Market Analysis 18.4.1. By Solution 18.4.2. By Deployment 18.4.3. By Enterprise Size 18.4.4. By Industry 18.5. The Uk Market Analysis 18.5.1. By Solution 18.5.2. By Deployment 18.5.3. By Enterprise Size 18.5.4. By Industry 18.6. Germany Market Analysis 18.6.1. By Solution 18.6.2. By Deployment 18.6.3. By Enterprise Size 18.6.4. By Industry 18.7. France Market Analysis 18.7.1. By Solution 18.7.2. By Deployment 18.7.3. By Enterprise Size 18.7.4. By Industry 18.8. Italy Market Analysis 18.8.1. By Solution 18.8.2. By Deployment 18.8.3. By Enterprise Size 18.8.4. By Industry 18.9. Spain Market Analysis 18.9.1. By Solution 18.9.2. By Deployment 18.9.3. By Enterprise Size 18.9.4. By Industry 18.10. BENELUX Market Analysis 18.10.1. By Solution 18.10.2. By Deployment 18.10.3. By Enterprise Size 18.10.4. By Industry 18.11. Russia Market Analysis 18.11.1. By Solution 18.11.2. By Deployment 18.11.3. By Enterprise Size 18.11.4. By Industry 18.12. Rest of Europe Market Analysis 18.12.1. By Solution 18.12.2. By Deployment 18.12.3. By Enterprise Size 18.12.4. By Industry 18.13. China Market Analysis 18.13.1. By Solution 18.13.2. By Deployment 18.13.3. By Enterprise Size 18.13.4. By Industry 18.14. Japan Market Analysis 18.14.1. By Solution 18.14.2. By Deployment 18.14.3. By Enterprise Size 18.14.4. By Industry 18.15. South Korea Market Analysis 18.15.1. By Solution 18.15.2. By Deployment 18.15.3. By Enterprise Size 18.15.4. By Industry 18.16. India Market Analysis 18.16.1. By Solution 18.16.2. By Deployment 18.16.3. By Enterprise Size 18.16.4. By Industry 18.17. Malaysia Market Analysis 18.17.1. By Solution 18.17.2. By Deployment 18.17.3. By Enterprise Size 18.17.4. By Industry 18.18. Indonesia Market Analysis 18.18.1. By Solution 18.18.2. By Deployment 18.18.3. By Enterprise Size 18.18.4. By Industry 18.19. Singapore Market Analysis 18.19.1. By Solution 18.19.2. By Deployment 18.19.3. By Enterprise Size 18.19.4. By Industry 18.20. Australia and New Zealand Market Analysis 18.20.1. By Solution 18.20.2. By Deployment 18.20.3. By Enterprise Size 18.20.4. By Industry 18.21. Rest of South Asia and Pacific Market Analysis 18.21.1. By Solution 18.21.2. By Deployment 18.21.3. By Enterprise Size 18.21.4. By Industry 18.22. GCC Countries Market Analysis 18.22.1. By Solution 18.22.2. By Deployment 18.22.3. By Enterprise Size 18.22.4. By Industry 18.23. Turkey Market Analysis 18.23.1. By Solution 18.23.2. By Deployment 18.23.3. By Enterprise Size 18.23.4. By Industry 18.24. South Africa Market Analysis 18.24.1. By Solution 18.24.2. By Deployment 18.24.3. By Enterprise Size 18.24.4. By Industry 18.25. Rest of Middle East and Africa Market Analysis 18.25.1. By Solution 18.25.2. By Deployment 18.25.3. By Enterprise Size 18.25.4. By Industry 19. Market Structure Analysis 19.1. Market Analysis by Tier of Companies 19.2. Market Share Analysis of Top Players 19.3. Market Presence Analysis 20. Competition Analysis 20.1. Competition Dashboard 20.2. Key Strategies, By Competitors 20.3. Competition Deep Dive 20.3.1. Turnkey Lender 20.3.1.1. Business Overview 20.3.1.2. Product Portfolio 20.3.1.3. Profitability by Market Segments (Business Segments / Region) 20.3.1.4. Sales Footprint 20.3.1.5. Strategy Overview 20.3.2. Lendflow 20.3.2.1. Business Overview 20.3.2.2. Product Portfolio 20.3.2.3. Profitability by Market Segments (Business Segments / Region) 20.3.2.4. Sales Footprint 20.3.2.5. Strategy Overview 20.3.3. Afterpay 20.3.3.1. Business Overview 20.3.3.2. Product Portfolio 20.3.3.3. Profitability by Market Segments (Business Segments / Region) 20.3.3.4. Sales Footprint 20.3.3.5. Strategy Overview 20.3.4. Banxware 20.3.4.1. Business Overview 20.3.4.2. Product Portfolio 20.3.4.3. Profitability by Market Segments (Business Segments / Region) 20.3.4.4. Sales Footprint 20.3.4.5. Strategy Overview 20.3.5. Affirm 20.3.5.1. Business Overview 20.3.5.2. Product Portfolio 20.3.5.3. Profitability by Market Segments (Business Segments / Region) 20.3.5.4. Sales Footprint 20.3.5.5. Strategy Overview 20.3.6. Klarna 20.3.6.1. Business Overview 20.3.6.2. Product Portfolio 20.3.6.3. Profitability by Market Segments (Business Segments / Region) 20.3.6.4. Sales Footprint 20.3.6.5. Strategy Overview 20.3.7. Tapwater 20.3.7.1. Business Overview 20.3.7.2. Product Portfolio 20.3.7.3. Profitability by Market Segments (Business Segments / Region) 20.3.7.4. Sales Footprint 20.3.7.5. Strategy Overview 20.3.8. Alchemy 20.3.8.1. Business Overview 20.3.8.2. Product Portfolio 20.3.8.3. Profitability by Market Segments (Business Segments / Region) 20.3.8.4. Sales Footprint 20.3.8.5. Strategy Overview 20.3.9. Migo 20.3.9.1. Business Overview 20.3.9.2. Product Portfolio 20.3.9.3. Profitability by Market Segments (Business Segments / Region) 20.3.9.4. Sales Footprint 20.3.9.5. Strategy Overview 20.3.10. Liberis 20.3.10.1. Business Overview 20.3.10.2. Product Portfolio 20.3.10.3. Profitability by Market Segments (Business Segments / Region) 20.3.10.4. Sales Footprint 20.3.10.5. Strategy Overview 20.3.11. Kanmon 20.3.11.1. Business Overview 20.3.11.2. Product Portfolio 20.3.11.3. Profitability by Market Segments (Business Segments / Region) 20.3.11.4. Sales Footprint 20.3.11.5. Strategy Overview 20.3.12. Sivo 20.3.12.1. Business Overview 20.3.12.2. Product Portfolio 20.3.12.3. Profitability by Market Segments (Business Segments / Region) 20.3.12.4. Sales Footprint 20.3.12.5. Strategy Overview 20.3.13. Hokodo 20.3.13.1. Business Overview 20.3.13.2. Product Portfolio 20.3.13.3. Profitability by Market Segments (Business Segments / Region) 20.3.13.4. Sales Footprint 20.3.13.5. Strategy Overview 20.3.14. Jaris 20.3.14.1. Business Overview 20.3.14.2. Product Portfolio 20.3.14.3. Profitability by Market Segments (Business Segments / Region) 20.3.14.4. Sales Footprint 20.3.14.5. Strategy Overview 20.3.15. Biz2X 20.3.15.1. Business Overview 20.3.15.2. Product Portfolio 20.3.15.3. Profitability by Market Segments (Business Segments / Region) 20.3.15.4. Sales Footprint 20.3.15.5. Strategy Overview 21. Assumptions and Acronyms Used 22. Research Methodology
Let us know your requirement to get
100% FREE customization
List of Tables
Table 01: Global Market Value (US$ Million) Analysis (2017 to 2021) By Solution Table 02: Global Market Value (US$ Million) Forecast (2022 to 2032) By Solution Table 03: Global Market Volume (‘000 Units) Forecast (2022 to 2032) By Solution Table 04: Global Market Value (US$ Million) Analysis (2017 to 2021) By Deployment Table 05: Global Market Value (US$ Million) Forecast (2022 to 2032) By Deployment Table 06: Global Market Volume (‘000 Units) Forecast (2022 to 2032) By Deployment Table 07: Global Market Value (US$ Million) Analysis (2017 to 2021) By Enterprise Size Table 08: Global Market Value (US$ Million) Forecast (2022 to 2032) By Enterprise Size Table 09: Global Market Value (US$ Million) Analysis (2017 to 2021) By Industry Table 10: Global Market Value (US$ Million) Forecast (2022 to 2032) By Industry Table 11: Global Market Value (US$ Million) Analysis (2017 to 2021) by Region Table 12: Global Market Value (US$ Million) Forecast (2022 to 2032) by Region Table 13: North America Market Value (US$ Million) Analysis (2017 to 2021) By Solution Table 14: North America Market Value (US$ Million) Forecast (2022 to 2032) By Solution Table 15: North America Market Value (US$ Million) Analysis (2017 to 2021) By Deployment Table 16: North America Market Value (US$ Million) Forecast (2022 to 2032) By Deployment Table 17: North America Market Value (US$ Million) Analysis (2017 to 2021) By Enterprise Size Table 18: North America Market Value (US$ Million) Forecast (2022 to 2032) By Enterprise Size Table 19: North America Market Value (US$ Million) Analysis (2017 to 2021) By Industry Table 20: North America Market Value (US$ Million) Forecast (2022 to 2032) By Industry Table 21: North America Market Value (US$ Million) Analysis (2017 to 2021) by Country Table 22: North America Market Value (US$ Million) Forecast (2022 to 2032) by Country Table 23: Latin America Market Value (US$ Million) Analysis (2017 to 2021) By Solution Table 24: Latin America Market Value (US$ Million) Forecast (2022 to 2032) By Solution Table 25: Latin America Market Value (US$ Million) Analysis (2017 to 2021) By Deployment Table 26: Latin America Market Value (US$ Million) Forecast (2022 to 2032) By Deployment Table 27: Latin America Market Value (US$ Million) Analysis (2017 to 2021) By Enterprise Size Table 28: Latin America Market Value (US$ Million) Forecast (2022 to 2032) By Enterprise Size Table 29: Latin America Market Value (US$ Million) Analysis (2017 to 2021) By Industry Table 30: Latin America Market Value (US$ Million) Forecast (2022 to 2032) By Industry Table 31: Latin America Market Value (US$ Million) Analysis (2017 to 2021) by Country Table 32: Latin America Market Value (US$ Million) Forecast (2022 to 2032) by Country Table 33: Europe Market Value (US$ Million) Analysis (2017 to 2021) By Solution Table 34: Europe Market Value (US$ Million) Forecast (2022 to 2032) By Solution Table 35: Europe Market Value (US$ Million) Analysis (2017 to 2021) By Deployment Table 36: Europe Market Value (US$ Million) Forecast (2022 to 2032) By Deployment Table 37: Europe Market Value (US$ Million) Analysis (2017 to 2021) By Enterprise Size Table 38: Europe Market Value (US$ Million) Forecast (2022 to 2032) By Enterprise Size Table 39: Europe Market Value (US$ Million) Analysis (2017 to 2021) By Industry Table 40: Europe Market Value (US$ Million) Forecast (2022 to 2032) By Industry Table 41: Europe Market Value (US$ Million) Analysis (2017 to 2021) by Country Table 42: Europe Market Value (US$ Million) Forecast (2022 to 2032) by Country Table 43: South Asia & Pacific Market Value (US$ Million) Analysis (2017 to 2021) By Solution Table 44: South Asia & Pacific Market Value (US$ Million) Forecast (2022 to 2032) By Solution Table 45: South Asia & Pacific Market Value (US$ Million) Analysis (2017 to 2021) By Deployment Table 46: South Asia & Pacific Market Value (US$ Million) Forecast (2022 to 2032) By Deployment Table 47: South Asia & Pacific Market Value (US$ Million) Analysis (2017 to 2021) By Enterprise Size Table 48: South Asia & Pacific Market Value (US$ Million) Forecast (2022 to 2032) By Enterprise Size Table 49: South Asia & Pacific Market Value (US$ Million) Analysis (2017 to 2021) By Industry Table 50: South Asia & Pacific Market Value (US$ Million) Forecast (2022 to 2032) By Industry Table 51: South Asia & Pacific Market Value (US$ Million) Analysis (2017 to 2021) by Country Table 52: South Asia & Pacific Market Value (US$ Million) Forecast (2022 to 2032) by Country Table 53: East Asia Market Value (US$ Million) Analysis (2017 to 2021) By Solution Table 54: East Asia Market Value (US$ Million) Forecast (2022 to 2032) By Solution Table 55: East Asia Market Value (US$ Million) Analysis (2017 to 2021) By Deployment Table 56: East Asia Market Value (US$ Million) Forecast (2022 to 2032) By Deployment Table 57: East Asia Market Value (US$ Million) Analysis (2017 to 2021) By Enterprise Size Table 58: East Asia Market Value (US$ Million) Forecast (2022 to 2032) By Enterprise Size Table 59: East Asia Market Value (US$ Million) Analysis (2017 to 2021) By Industry Table 60: East Asia Market Value (US$ Million) Forecast (2022 to 2032) By Industry Table 61: East Asia Market Value (US$ Million) Analysis (2017 to 2021) by Country Table 62: East Asia Market Value (US$ Million) Forecast (2022 to 2032) by Country Table 63: Middle East and Africa Market Value (US$ Million) Analysis (2017 to 2021) By Solution Table 64: Middle East and Africa Market Value (US$ Million) Forecast (2022 to 2032) By Solution Table 65: Middle East and Africa Market Value (US$ Million) Analysis (2017 to 2021) By Deployment Table 66: Middle East and Africa Market Value (US$ Million) Forecast (2022 to 2032) By Deployment Table 67: Middle East and Africa Market Value (US$ Million) Analysis (2017 to 2021) By Enterprise Size Table 68: Middle East and Africa Market Value (US$ Million) Forecast (2022 to 2032) By Enterprise Size Table 69: Middle East and Africa Market Value (US$ Million) Analysis (2017 to 2021) By Industry Table 70: Middle East and Africa Market Value (US$ Million) Forecast (2022 to 2032) By Industry Table 71: Middle East and Africa Market Value (US$ Million) Analysis (2017 to 2021) by Country Table 72: Middle East and Africa Market Value (US$ Million) Forecast (2022 to 2032) by Country
Find your sweet spots for generating winning opportunities in this market.
Talk to AnalystList of Charts
Figure 01: Global Market Size (US$ Million) and Y-o-Y Growth Rate from 2022 to 2032 Figure 02: Global Market Size and Y-o-Y Growth Rate from 2022 to 2032 Figure 03: Global Market Value (US$ Million), 2017 to 2021 Figure 04: Global Market Value (US$ Million), 2022 to 2032 Figure 05: Global Market Value Share Analysis (2022 to 2032) By Solution Figure 06: Global Market Value Y-o-Y Growth Trend Analysis (2019 to 2032) By Solution Figure 07: Global Market Attractiveness By Solution Figure 08: Global Market Value Share Analysis (2022 to 2032) By Deployment Figure 09: Global Market Value Y-o-Y Growth Trend Analysis (2019 to 2032) By Deployment Figure 10: Global Market Attractiveness By Deployment Figure 11: Global Market Value Share Analysis (2022 to 2032) By Enterprise Size Figure 12: Global Market Value Y-o-Y Growth Trend Analysis (2019 to 2032) By Enterprise Size Figure 13: Global Market Attractiveness By Enterprise Size Figure 14: Global Market Value Share Analysis (2022 to 2032) By Industry Figure 15: Global Market Value Y-o-Y Growth Trend Analysis (2019 to 2032) By Industry Figure 16: Global Market Attractiveness By Industry Figure 17: Global Market Value Share Analysis (2022 to 2032) by Region Figure 18: Global Market Value Y-o-Y Growth Trend Analysis (2019 to 2032) by Region Figure 19: Global Market Attractiveness by Region Figure 20: North America Market Absolute $ Opportunity (US$ Million), 2017 to 2032 Figure 21: Latin America Market Absolute $ Opportunity (US$ Million), 2017 to 2032 Figure 22: Europe Market Absolute $ Opportunity (US$ Million), 2017 to 2032 Figure 23: East Asia Market Absolute $ Opportunity (US$ Million), 2017 to 2032 Figure 24: South Asia & Pacific Market Absolute $ Opportunity (US$ Million), 2017 to 2032 Figure 25: Middle East & Africa Market Absolute $ Opportunity (US$ Million), 2017 to 2032 Figure 26: North America Market Value (US$ Million), 2017 to 2021 Figure 27: North America Market Value (US$ Million), 2022 to 2032 Figure 28: North America Market Value Share Analysis (2022 to 2032) By Solution Figure 29: North America Market Value Y-o-Y Growth Trend Analysis (2019 to 2032) By Solution Figure 30: North America Market Attractiveness By Solution Figure 31: North America Market Value Share Analysis (2022 to 2032) By Deployment Figure 32: North America Market Value Y-o-Y Growth Trend Analysis (2019 to 2032) By Deployment Figure 33: North America Market Attractiveness By Deployment Figure 34: North America Market Value Share Analysis (2022 to 2032) By Enterprise Size Figure 35: North America Market Value Y-o-Y Growth Trend Analysis (2019 to 2032) By Enterprise Size Figure 36: North America Market Attractiveness By Enterprise Size Figure 37: North America Market Value Share Analysis (2022 to 2032) By Industry Figure 38: North America Market Value Y-o-Y Growth Trend Analysis (2019 to 2032) By Industry Figure 39: North America Market Attractiveness By Industry Figure 40: North America Market Value Share Analysis (2022 to 2032) by Country Figure 41: North America Market Value Y-o-Y Growth Trend Analysis (2019 to 2032) by Country Figure 42: North America Market Attractiveness by Country Figure 43:U.S. Market Absolute $ Opportunity (US$ Million), 2017 to 2032 Figure 44: Canada Market Absolute $ Opportunity (US$ Million), 2017 to 2032 Figure 45: Latin America Market Value (US$ Million), 2017 to 2021 Figure 46: Latin America Market Value (US$ Million), 2022 to 2032 Figure 47: Latin America Market Value Share Analysis (2022 to 2032) By Solution Figure 48: Latin America Market Value Y-o-Y Growth Trend Analysis (2019 to 2032) By Solution Figure 49: Latin America Market Attractiveness By Solution Figure 50: Latin America Market Value Share Analysis (2022 to 2032) By Deployment Figure 51: Latin America Market Value Y-o-Y Growth Trend Analysis (2019 to 2032) By Deployment Figure 52: Latin America Market Attractiveness By Deployment Figure 53: Latin America Market Value Share Analysis (2022 to 2032) By Enterprise Size Figure 54: Latin America Market Value Y-o-Y Growth Trend Analysis (2019 to 2032) By Enterprise Size Figure 55: Latin America Market Attractiveness By Enterprise Size Figure 56: Latin America Market Value Share Analysis (2022 to 2032) By Industry Figure 57: Latin America Market Value Y-o-Y Growth Trend Analysis (2019 to 2032) By Industry Figure 58: Latin America Market Attractiveness By Industry Figure 59: Latin America Market Value Share Analysis (2022 to 2032) by Country Figure 60: Latin America Market Value Y-o-Y Growth Trend Analysis (2019 to 2032) by Country Figure 61: Latin America Market Attractiveness by Country Figure 62: Brazil Market Absolute $ Opportunity (US$ Million), 2017 to 2032 Figure 63: Mexico Market Absolute $ Opportunity (US$ Million), 2017 to 2032 Figure 64: Rest of Latin America Market Absolute $ Opportunity (US$ Million), 2017 to 2032 Figure 65: Europe Market Value (US$ Million), 2017 to 2021 Figure 66: Europe Market Value (US$ Million), 2022 to 2032 Figure 67: Europe Market Value Share Analysis (2022 to 2032) By Solution Figure 68: Europe Market Value Y-o-Y Growth Trend Analysis (2019 to 2032) By Solution Figure 69: Europe Market Attractiveness By Solution Figure 70: Europe Market Value Share Analysis (2022 to 2032) By Deployment Figure 71: Europe Market Value Y-o-Y Growth Trend Analysis (2019 to 2032) By Deployment Figure 72: Europe Market Attractiveness By Deployment Figure 73: Europe Market Value Share Analysis (2022 to 2032) By Enterprise Size Figure 74: Europe Market Value Y-o-Y Growth Trend Analysis (2019 to 2032) By Enterprise Size Figure 75: Europe Market Attractiveness By Enterprise Size Figure 76: Europe Market Value Share Analysis (2022 to 2032) By Industry Figure 77: Europe Market Value Y-o-Y Growth Trend Analysis (2019 to 2032) By Industry Figure 78: Europe Market Attractiveness By Industry Figure 79: Europe Market Value Share Analysis (2022 to 2032) by Country Figure 80: Europe Market Value Y-o-Y Growth Trend Analysis (2019 to 2032) by Country Figure 81: Europe Market Attractiveness by Country Figure 82: Germany Market Absolute $ Opportunity (US$ Million), 2017 to 2032 Figure 83: Italy Market Absolute $ Opportunity (US$ Million), 2017 to 2032 Figure 84: France Market Absolute $ Opportunity (US$ Million), 2017 to 2032 Figure 85: U.K. Market Absolute $ Opportunity (US$ Million), 2017 to 2032 Figure 86: Spain Market Absolute $ Opportunity (US$ Million), 2017 to 2032 Figure 87: BENELUX Market Absolute $ Opportunity (US$ Million), 2017 to 2032 Figure 88: Russia Market Absolute $ Opportunity (US$ Million), 2017 to 2032 Figure 89: Rest of Europe Market Absolute $ Opportunity (US$ Million), 2017 to 2032 Figure 90: South Asia & Pacific Market Value (US$ Million), 2017 to 2021 Figure 91: South Asia & Pacific Market Value (US$ Million), 2022 to 2032 Figure 92: South Asia & Pacific Market Value Share Analysis (2022 to 2032) By Solution Figure 93: South Asia & Pacific Market Value Y-o-Y Growth Trend Analysis (2019 to 2032) By Solution Figure 94: South Asia & Pacific Market Attractiveness By Solution Figure 95: South Asia & Pacific Market Value Share Analysis (2022 to 2032) By Deployment Figure 96: South Asia & Pacific Market Value Y-o-Y Growth Trend Analysis (2019 to 2032) By Deployment Figure 97: South Asia & Pacific Market Attractiveness By Deployment Figure 98: South Asia & Pacific Market Value Share Analysis (2022 to 2032) By Enterprise Size Figure 99: South Asia & Pacific Market Value Y-o-Y Growth Trend Analysis (2019 to 2032) By Enterprise Size Figure 100: South Asia & Pacific Market Attractiveness By Enterprise Size Figure 101: South Asia & Pacific Market Value Share Analysis (2022 to 2032) By Industry Figure 102: South Asia & Pacific Market Value Y-o-Y Growth Trend Analysis (2019 to 2032) By Industry Figure 103: South Asia & Pacific Market Attractiveness By Industry Figure 104: South Asia & Pacific Market Value Share Analysis (2022 to 2032) by Country Figure 105: South Asia & Pacific Market Value Y-o-Y Growth Trend Analysis (2019 to 2032) by Country Figure 106: South Asia & Pacific Market Attractiveness by Country Figure 107: India Market Absolute $ Opportunity (US$ Million), 2017 to 2032 Figure 108: Indonesia Market Absolute $ Opportunity (US$ Million), 2017 to 2032 Figure 109: Malaysia Market Absolute $ Opportunity (US$ Million), 2017 to 2032 Figure 110: Singapore Market Absolute $ Opportunity (US$ Million), 2017 to 2032 Figure 111: Australia& New Zealand Market Absolute $ Opportunity (US$ Million), 2017 to 2032 Figure 112: Rest of South Asia & Pacific Market Absolute $ Opportunity (US$ Million), 2017 to 2032 Figure 113: East Asia Market Value (US$ Million), 2017 to 2021 Figure 114: East Asia Market Value (US$ Million), 2022 to 2032 Figure 115: East Asia Market Value Share Analysis (2022 to 2032) By Solution Figure 116: East Asia Market Value Y-o-Y Growth Trend Analysis (2019 to 2032) By Solution Figure 117: East Asia Market Attractiveness By Solution Figure 118: East Asia Market Value Share Analysis (2022 to 2032) By Deployment Figure 119: East Asia Market Value Y-o-Y Growth Trend Analysis (2019 to 2032) By Deployment Figure 120: East Asia Market Attractiveness By Deployment Figure 121: East Asia Market Value Share Analysis (2022 to 2032) By Enterprise Size Figure 122: East Asia Market Value Y-o-Y Growth Trend Analysis (2019 to 2032) By Enterprise Size Figure 123: East Asia Market Attractiveness By Enterprise Size Figure 124: East Asia Market Value Share Analysis (2022 to 2032) By Industry Figure 125: East Asia Market Value Y-o-Y Growth Trend Analysis (2019 to 2032) By Industry Figure 126: East Asia Market Attractiveness By Industry Figure 127: East Asia Market Value Share Analysis (2022 to 2032) by Country Figure 128: East Asia Market Value Y-o-Y Growth Trend Analysis (2019 to 2032) by Country Figure 129: East Asia Market Attractiveness by Country Figure 130: China Market Absolute $ Opportunity (US$ Million), 2017 to 2032 Figure 131: Japan Market Absolute $ Opportunity (US$ Million), 2017 to 2032 Figure 132: South Korea Market Absolute $ Opportunity (US$ Million), 2017 to 2032 Figure 133: Middle East and Africa Market Value (US$ Million), 2017 to 2021 Figure 134: Middle East and Africa Market Value (US$ Million), 2022 to 2032 Figure 135: Middle East and Africa Market Value Share Analysis (2022 to 2032) By Solution Figure 136: Middle East and Africa Market Value Y-o-Y Growth Trend Analysis (2019 to 2032) By Solution Figure 137: Middle East and Africa Market Attractiveness By Solution Figure 138: Middle East and Africa Market Value Share Analysis (2022 to 2032) By Deployment Figure 139: Middle East and Africa Market Value Y-o-Y Growth Trend Analysis (2019 to 2032) By Deployment Figure 140: Middle East and Africa Market Attractiveness By Deployment Figure 141: Middle East and Africa Market Value Share Analysis (2022 to 2032) By Enterprise Size Figure 142: Middle East and Africa Market Value Y-o-Y Growth Trend Analysis (2019 to 2032) By Enterprise Size Figure 143: Middle East and Africa Market Attractiveness By Enterprise Size Figure 144: Middle East and Africa Market Value Share Analysis (2022 to 2032) By Industry Figure 145: Middle East and Africa Market Value Y-o-Y Growth Trend Analysis (2019 to 2032) By Industry Figure 146: Middle East and Africa Market Attractiveness By Industry Figure 147: Middle East and Africa Market Value Share Analysis (2022 to 2032) by Country Figure 148: Middle East and Africa Market Value Y-o-Y Growth Trend Analysis (2019 to 2032) by Country Figure 149: Middle East and Africa Market Attractiveness by Country Figure 150: GCC Countries Market Absolute $ Opportunity (US$ Million), 2017 to 2032 Figure 151: Turkey Market Absolute $ Opportunity (US$ Million), 2017 to 2032 Figure 152: South Africa Market Absolute $ Opportunity (US$ Million), 2017 to 2032 Figure 153: Rest of Middle East and Africa Market Absolute $ Opportunity (US$ Million), 2017 to 2032
Need specific information?
Request CustomizationExplore Technology Insights
View Reports