The Alternative Lending Platform Market is estimated to be valued at USD 5.3 billion in 2025 and is projected to reach USD 46.3 billion by 2035, registering a compound annual growth rate (CAGR) of 24.1% over the forecast period.
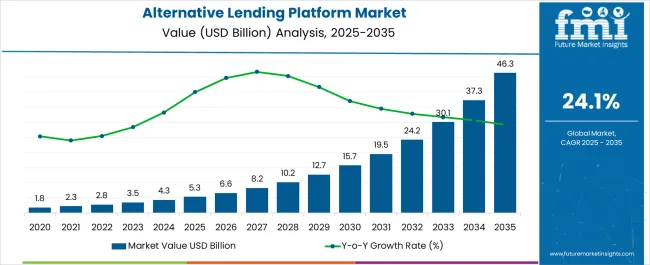
| Metric | Value |
|---|---|
| Alternative Lending Platform Market Estimated Value in (2025 E) | USD 5.3 billion |
| Alternative Lending Platform Market Forecast Value in (2035 F) | USD 46.3 billion |
| Forecast CAGR (2025 to 2035) | 24.1% |
The alternative lending platform market is expanding rapidly as financial institutions and fintech providers focus on improving accessibility, speed, and personalization in lending services. The shift away from traditional banking models has been reinforced by the growing demand for credit from underserved small and medium enterprises, as well as from individual borrowers seeking more flexible options.
Regulatory encouragement of digital lending ecosystems, combined with advances in artificial intelligence, machine learning, and blockchain, has improved risk assessment, fraud detection, and operational efficiency. Enhanced customer experience through automated loan processing, faster approvals, and tailored financial products has further accelerated adoption.
The market outlook remains optimistic as digital lending platforms continue to evolve with integrated analytics, omnichannel presence, and strong compliance frameworks, enabling greater scalability and trust among borrowers and investors.
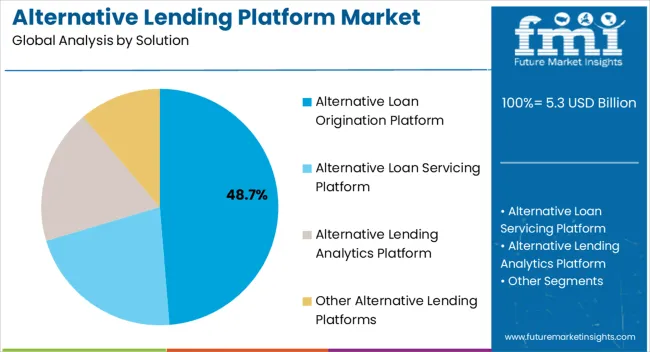
The alternative loan origination platform solution is expected to hold 48.70% of total revenue by 2025 within the solution category, positioning it as the leading segment. Its dominance is being reinforced by the growing need for efficient loan application processing, automated credit risk evaluation, and enhanced customer experience.
Financial institutions are increasingly prioritizing platforms that streamline loan origination through digitized workflows, document verification, and integrated scoring models. The ability to reduce turnaround time while ensuring regulatory compliance has further strengthened adoption.
As lending ecosystems embrace scalable and automated solutions, the alternative loan origination platform continues to be the most impactful solution type.
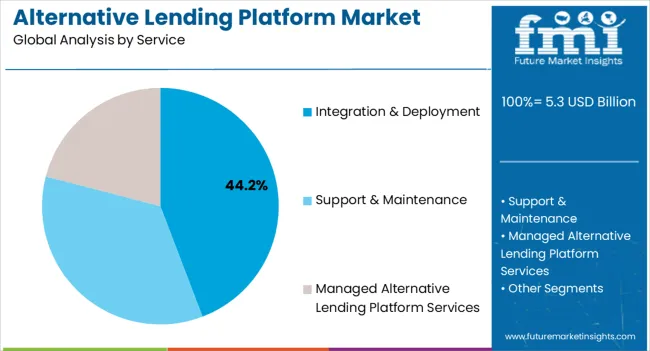
The integration and deployment service segment is projected to account for 44.20% of total market revenue by 2025, making it the most prominent service category. This share is attributed to rising demand for seamless integration of lending platforms with existing financial infrastructure, including legacy banking systems and customer relationship management tools.
Institutions are prioritizing services that ensure smooth deployment, minimal downtime, and strong customization capabilities. The emphasis on scalability and long-term performance reliability has accelerated demand for specialized integration expertise.
As the complexity of digital lending ecosystems grows, this service segment remains central to ensuring successful implementation and sustainable platform utilization.
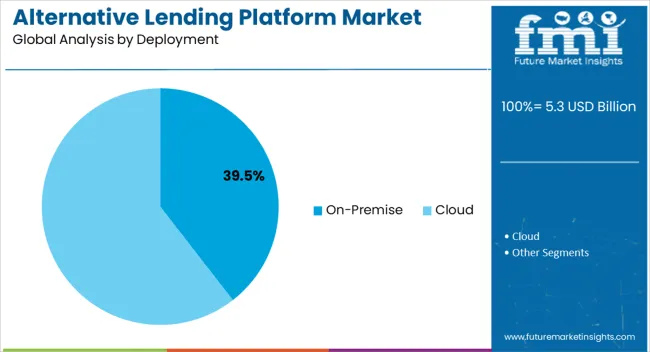
The on premise deployment segment is expected to represent 39.50% of total market revenue by 2025, emerging as the dominant deployment model. Preference for this model is driven by heightened concerns over data privacy, security, and regulatory compliance, particularly within large financial institutions and regions with stringent data protection mandates.
On premise platforms provide organizations with direct control over sensitive borrower data and allow customization to meet specific operational needs. Despite the rising trend toward cloud based solutions, the demand for greater security, governance, and reliability continues to sustain adoption of on premise deployments.
This has positioned the segment as the leading choice for institutions prioritizing compliance and data control.
The alternative lending platform market witnessed significant growth and transformation between 2020 and 2025. During this period, the market experienced a surge in alternative lending platforms, driven by technological advancements, increasing demand for faster and more accessible lending options, and the rise of peer-to-peer lending models.
The alternative lending platform market saw the emergence of established players and new start-ups offering various lending services, including peer-to-peer lending, crowdfunding, and marketplace lending. Investors also grew interested in this sector, contributing to the market's expansion.
From 2025 to 2035, the alternative lending platform industry is expected to continue its upward trajectory. The alternative lending platform market is projected to witness further innovation and technological advancements, resulting in enhanced user experiences, streamlined processes, and improved risk assessment capabilities. With the increasing acceptance and adoption of alternative lending platforms, they are likely to become a mainstream option for borrowers seeking quick and convenient access to financing.
Regulatory frameworks are expected to evolve to accommodate the growing market, ensuring consumer protection and maintaining market stability. The future of the alternative lending platform market appears promising, with sustained growth and potential for disruption in the traditional lending landscape.
Rising Digitalization in Financial Transactions to Boost the Market
The digital transformation of financial transactions is anticipated to make them more transparent and consistent for end users than the conventional approach. Computer algorithms make Lending decisions on alternative platforms in real time. As a result, the increasing penetration of such media in advanced economies is expected to propel market growth for alternative lending platforms.
The soaring markets of developing countries with less disclosure of legal financing services provide an optimistic perspective for the alternative lending platform industry. Tavant Technologies, for example, has generated a blockchain-based digital solution that takes full advantage of data-driven processes in accumulating alternative funding lifecycles.
Alternative lending is experiencing consistent global growth, and financial regulators are attempting to devise solutions to control the sector and allow it to grow securely. Many developed economies, including the United Kingdom, Singapore, the United States, and Australia, have established sandboxes to support and ramp sector progress.
Reduction of Operating Costs and Market Risk to Augment the Market Growth for Alternative Lending Platform
The burgeoning student population may create more opportunities, as most students require loans with substantially lower interest rates. As their operating expenses are less than traditional lenders, alternative lending platforms can offer lower interest rates. Many individuals worldwide have applied for loans via alternative lending platforms because of the numerous benefits they offer, such as convenient access and quick approvals.
The emergence of startups and fintech lending companies favors the industry because these entrepreneurs are considered high-risk ventures. Alternative lending platforms finance such ventures even if the borrower does not own a mortgage and has no credit record. Legacy lending institutions' strict lending regulations raise the demand for these platforms.
The potential hazard of investors losing money due to reimbursement defaults is anticipated to impede alternative lending platform industry development significantly. These threats arise because most borrowers on the alternative lending platform need a better credit score. Lenders on the alternative lending platform allow borrowers to qualify to utilize sales figures.
| Attribute | Details |
|---|---|
| North America Market Share - 2025 | 25.5% |
| United States Market Share - 2025 | 16.5% |
| Australia Market Share - 2025 | 2.5% |
Need for Ensuring Financial Stability to Weather Out Economic Crises to Stimulate Growth.
In 2025, North America is expected to dominate the alternative lending platform market, accounting for 30.4% of global revenue. The region's dominance is due to the presence of several prominent stakeholders. Furthermore, technological advancements and adoptions are stirring up regional market growth for alternative lending platforms.
According to the Global Entrepreneurship Monitor, start-ups in the United States account for more than 17.4% of the population. As a result, it represents a wonderful opportunity for cloud lending in the region. This region's collaborative approach between banks and market lenders is rapidly expanding.
Due to the ongoing housing crisis and higher debt rates in the United States, the institution intends to increase its loan pipeline from USD 751 million to USD 2.48 billion. T30 and Blueprint are expected to draw on their combined investing expertise and extensive network of industry contacts to increase T30's lending capability and offer borrowing opportunities.
| Attribute | Details |
|---|---|
| Japan Market Share - 2025 | 3.4% |
| China Market CAGR (From 2025 to 2035) | 24.2% |
| India Market CAGR (From 2025 to 2035) | 25.4% |
A Flourishing SME Culture to Widen Growth Prospects in the Region
During the forecast period, the Asia Pacific alternative lending platforms market is expected to expand at a CAGR of 24% from 2025 to 2035. The market growth for alternative lending platforms can be attributed to a high perception of the advantages of alternative lending platforms in countries such as China, India, and Japan. The combative efforts made by various associations throughout the Asia Pacific to promote alternative lending platforms are also expected to contribute to the regional market's growth.
Asia Pacific offers significant opportunities for the alternative lending platform industry, particularly in markets such as Indonesia, the Philippines, and Vietnam. Robust growth in consumer expenditure, combined with low banking permeability and a penchant for borrowing from non-traditional sources, bodes well for the alternative lending platform industry in these markets. There is a huge opportunity for the alternative lending industry to help SMEs in the region bridge the financing gap. SMEs play an important role in SEA economies, accounting for between 35 and 55% of GDP.
| Attribute | Details |
|---|---|
| Europe Market Share - 2025 | 22.1% |
| Germany Market Share - 2025 | 9.1% |
| United Kingdom Market CAGR (From 2025 to 2035) | 20.5% |
The European alternative financing platform sector has grown significantly. As traditional lending institutions confront constraints, alternative lending platforms have become appealing to borrowers and investors. These platforms use technology and data-driven procedures to create faster and more accessible finance options.
Peer-to-peer lending, crowdfunding, invoice finance, and marketplace lending are among the available options. Governments and regulators have recognized the potential of alternative lending and are working to create favorable regulatory conditions. The European alternative lending platform sector is primed for significant expansion and innovation as demand for efficient and transparent financing solutions grows.
| Segment | Solution |
|---|---|
| Segment Name | Alternative Loan Servicing Platform |
| Segment Share | 27.70% |
According to current trends and market analysis, the alternative loan servicing platform category is expected to experience the leading growth. This platform offers innovative solutions for managing and servicing loans, providing alternatives to traditional banking methods.
With the rise of financial technology and the demand for more efficient loan servicing, this sector is anticipated to expand rapidly. The alternative loan servicing platform category leverages technology and automation to streamline processes, enhance customer experiences, and offer greater flexibility in loan management, contributing to its projected accelerated market growth.
| Segment | Service |
|---|---|
| Segment Name | Alternative Lending Platform Integration & Deployment |
| Segment Share | 43.30% |
Among the services within the alternative lending platform market, the alternative lending platform support & maintenance segment is expected to lead in demand. This is primarily due to its crucial role in ensuring the smooth functioning and continuous operation of lending platforms.
Support and maintenance services are essential for addressing technical issues, providing updates and enhancements, and offering ongoing assistance to lenders and borrowers. As the reliance on alternative lending platforms grows, the need for reliable support and maintenance services becomes increasingly critical, leading to higher demand in this particular service category.
Demand for On-premise Alternative Lending Platforms to Witness Surging Demand
In 2025, on-premise alternative lending platforms are expected to account for 68.9% of global revenue. Although the lending industry is gradually moving to the cloud, many lenders still witness it as a barrier due to concerns about data security.
They prefer on-premise deployment over cloud deployment because they need to familiarize themselves with the technology and fear losing access to their data. The information stored by lending institutions is susceptible and can be stolen or misinterpreted. As a result, businesses continue to prefer on-premise deployment.
Keeping Pace with Dynamic Industry Trends to Heighten Adoption
During the forecast period from 2025 to 2035, managed alternative lending platform services may likely experience heightened growth, registering a CAGR of 23.5%. Managed services can assist organizations in dealing with constantly evolving industry trends and technological breakthroughs.
Businesses must keep up with the ongoing IT trend to run their operations. Companies can focus on what they excel at best with the help of managed services. Furthermore, technology partners sustain these endeavors with strong IT support, resulting in significant progress in the segment.
Alternative Lending Platforms for Crowdfunding to Gather Significant Momentum
According to Future Market Insights, alternative lending platforms for crowdfunding are expected to reign supreme, comprising nearly 70% of overall applications in 2025. The growing usage of social media platforms contributes to the segment's dominance because they serve as low cost promotional tools for crowdfunding platforms.
The global reach of social media grants crowdfunding campaigns the necessary push to attract investors worldwide. Several crowdfunding platforms are also employed to raise funds for various approaches or fight a cause, contributing to the segment's optimistic outlook.
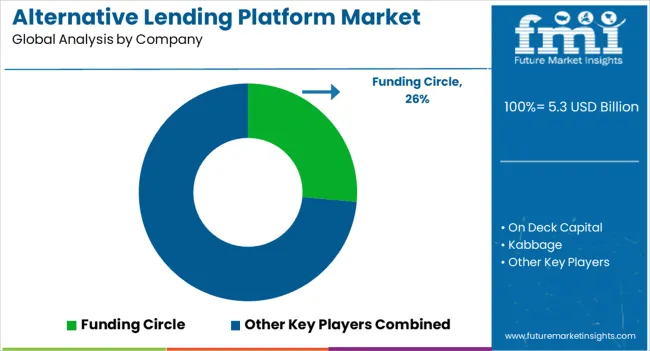
The competition in the alternative lending platform market is intense and dynamic. With the increasing demand for alternative financing options, numerous players, from traditional financial institutions to fintech startups, have entered the market. Traditional banks have joined the space with their lending platforms.
The need for innovative loan products, faster application processes, competitive interest rates, and excellent customer service fuel the competition. Market players differentiate themselves through unique features, technological advancements, partnerships, and strategic marketing efforts to attract borrowers and investors.
Manufacturers are adopting various marketing strategies such as new product launches, geographical expansion, mergers and acquisitions, partnerships, and collaboration to identify the interest of potential buyers and create a larger customer base. For instance,
Novel Breakthroughs and Advancements
| Company | Funding Circle |
|---|---|
| Strategy | Funding Circle Partners with Bird & Blend Tea Co. |
| Details | In July 2025, Funding Circle decided to continue supporting SMEs, helping stock a unique selection of tea blends created by Bird & Blend Tea Co. for its London office. Bird & Blend accessed finance through Funding Circle during the Coronavirus pandemic when it closed its 11 United Kingdom stores and shifted its business online. |
| Company | On Deck Capital |
|---|---|
| Strategy | OnDeck Capital's New Strategic Partnerships Revolutionize Working Capital Access |
| Details | On a similar plane, On Deck Capital announced new strategic partnership initiatives to facilitate equal access to working capital for small businesses in May 2025. The partnership includes companies such as SoFi Technologies Inc. and LendingTree. These partnerships combine best-in-class digital lending products and FinTech offerings with OnDeck’s Artificial Intelligence (AI) and Machine Learning (ML) expertise, giving small businesses more options for obtaining effortless access to working capital that supports their growth. |
| Company | Kabbage |
|---|---|
| Strategy | American Express Expands Support for Small Businesses with Kabbage Funding |
| Details | In December 2024, Kabbage from American Express introduced Kabbage FundingTM, offering eligible small businesses flexible lines of credit between USD 1,000 and USD 150,000. With Kabbage Funding, small businesses can apply in minutes to access working capital 24/7 to help manage their company’s cash flow. The launch of Kabbage Funding builds on American Express’s momentum to go beyond the Card and become an essential partner to small businesses through a broad range of cash flow management tools. |
The global alternative lending platform market is estimated to be valued at USD 5.3 billion in 2025.
The market size for the alternative lending platform market is projected to reach USD 46.3 billion by 2035.
The alternative lending platform market is expected to grow at a 24.1% CAGR between 2025 and 2035.
The key product types in alternative lending platform market are alternative loan origination platform, alternative loan servicing platform, alternative lending analytics platform and other alternative lending platforms.
In terms of service, integration & deployment segment to command 44.2% share in the alternative lending platform market in 2025.


Full Research Suite comprises of:
Market outlook & trends analysis
Interviews & case studies
Strategic recommendations
Vendor profiles & capabilities analysis
5-year forecasts
8 regions and 60+ country-level data splits
Market segment data splits
12 months of continuous data updates
DELIVERED AS:
PDF EXCEL ONLINE
Alternatives For Injectable Diabetes Care Market Size and Share Forecast Outlook 2025 to 2035
Alternative Fuel Vehicles Market Size and Share Forecast Outlook 2025 to 2035
Alternative Protein Production Equipment Market Size and Share Forecast Outlook 2025 to 2035
Alternative Proteins for Pets Market Analysis - Size, Share, and Forecast Outlook 2025 to 2035
Alternative Protein Market Insights - Sustainable Food Trends 2025 to 2035
Alternative Retailing Technologies Market Analysis 2020 to 2024 and Forecast 2025 to 2035, By Online and In-Store Technologies
Alternative Accommodation Market Trends - Growth & Forecast 2025 to 2035
Alternative Tourism Market Growth – Forecast 2024-2034
Down Alternative Mattresses Market Size and Share Forecast Outlook 2025 to 2035
Milk Alternatives Market – Growth, Demand & Dairy-Free Trends
Meat Alternative Market Trends – Growth & Industry Forecast 2024 to 2034
Dairy Alternatives Market Analysis - Size, Share, and Forecast Outlook 2025 to 2035
Cheese Alternatives Market Analysis - Size, Share, and Forecast 2025 to 2035
Retinol Alternatives (Bakuchiol) Market Size and Share Forecast Outlook 2025 to 2035
Carmine Alternatives Market Size and Share Forecast Outlook 2025 to 2035
Fish Oil Alternatives Market Size and Share Forecast Outlook 2025 to 2035
Fish Meal Alternative Market Size and Share Forecast Outlook 2025 to 2035
Demand for Alternative Protein Meat Extenders with Shelf-life Control in CIS Size and Share Forecast Outlook 2025 to 2035
Animal Feed Alternative Protein Market Analysis - Size, Share, & Forecast Outlook 2025 to 2035
A detailed global analysis of Brand Share Analysis for Animal Feed Alternative Protein Industry

Thank you!
You will receive an email from our Business Development Manager. Please be sure to check your SPAM/JUNK folder too.
Chat With
MaRIA