Complementary and Alternative Medicine for Anti Aging & Longetivity Market Size and Share Forecast Outlook (2022 to 2032)

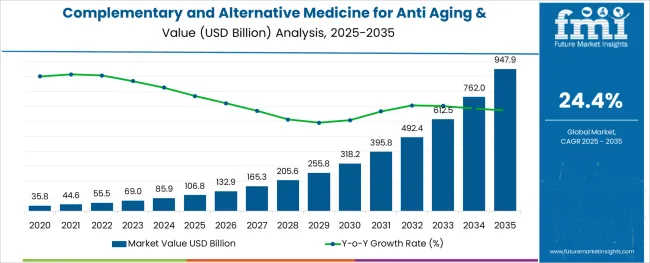
The market for Complementary and Alternative Medicine for Anti-Aging & Longevity was USD 44.6 billion in 2021, and it is expected to grow at a CAGR of 24.4% from 2022 to 2032.

The market for complementary and alternative medicine (CAM) in anti-ageing and longevity will be driven by the growing ageing population and diseases associated with it. The Complementary and Alternative Medicine for Anti-Aging & Longevity Market accounted for an absolute dollar opportunity of nearly USD 347.7 billion from 2022 to 2032.

Attributes Details
Global Complementary and Alternative Medicine for Anti-Aging & Longevity (2022) USD 44.6 Billion
Global Complementary and Alternative Medicine for Anti-Aging & Longevity (2032) USD 347.7 Billion
Global Complementary and Alternative Medicine for Anti-Aging & Longevity CAGR (2022 to 2032) 24.4%
USA Complementary and Alternative Medicine for Anti-Aging & Longevity (2032) 24.9%
Key Companies Profiled Anadolu Medical Center; Sinomedica; Acupuncture Enfants; Ayurveda Kuwait; Maylilacs; Al Zuahir Holistic Medicine Center; Ayurmana by Dharma Ayurveda; Trinicum; Miskawaan Health Group; Therme Wien

Comparison of Market Demand (2017 to 2021) vs Forecast Outlook (2022 to 2032)

As per the Complementary and Alternative Medicine for Anti-Aging & Longevity Market industry research by Future Market Insights - a market research and competitive intelligence provider, historically, from 2017 to 2021, the market value of the Complementary and Alternative Medicine for Anti-Aging & Longevity increased at around 20.9% CAGR.

The Complementary and Alternative Medicine for Anti-Aging & Longevity Market is projected to grow at a CAGR of 24.4% over the coming ten years.

Key Growth Drivers for Complementary and Alternative Anti-Aging Treatments

The market is expected to grow in the coming years as a result of the changing regulatory landscape and strong government initiatives, which have led to the establishment of strong transnational links across therapeutic paths that connect global, national, and local alternative medicine groups.

Furthermore, government activities examining standards relating to the right to health in all of its manifestations are expected to bolster consumers' participation and service providers in the field of CAM. Government actions, such as increased targeted spending, the establishment of government facilities, and the publication of guidelines to ensure the use of complementary and alternative medicine, all help to drive demand for integrative health and complementary medicine practices (CAM).

Medical tourism, which attracts people from all over the world and allows them to seek world-class alternative medical care, is also being promoted by regulatory organizations. In some Indian states, for example, regulatory authorities have invested significantly in the creation and standardization of alternative medical services. A government entity named the Ministry of Ayush has been established to oversee Yoga, Ayurveda, homeopathic, and naturopathy instruction, product creation, research, and other services in India.
Furthermore, in the next years, research focusing on the utilization of traditional medications for the treatment of COVID-19 patients is expected to gain pace. Traditional COVID-19 therapy alternatives are being supported by governments all around the world, but they must meet the same research standards as all other pharmacological choices. This is consequently having a positive ripple effect on complementary and alternative medicine for the anti-aging & longevity market.

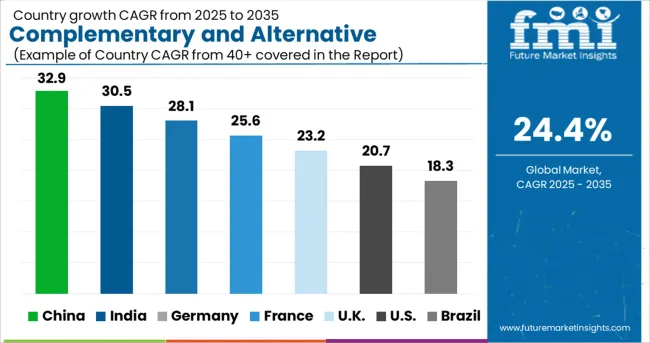
Analysis of Top Countries Adopting and Regulating Longevity-Focused Medical Solutions

Which Region holds the Significant Potential for Complementary and Alternative Medicine for Anti-Aging & Longevity?

In 2020, Europe dominated the global market, accounting for nearly 30% of total sales. In Europe, complementary and alternative medicine (CAM) has become significantly popular and well-accepted. Chiropractic, massage, homeopathy, reflexology, acupuncture, and herbal medicine are the most often used CAM therapies in Europe.

Women and people in their middle years are more likely to use complementary and alternative medicine (CAM). Musculoskeletal issues are the most common conditions addressed with complementary and alternative medicine (CAM) in terms of health determinants. Depression, severe headaches, back issues, stomach or intestinal diseases, and sleeplessness are the most common conditions linked to the use of complementary and alternative medicine.

Furthermore, Ayurveda is gaining popularity in several European countries, with Germany serving as the epicenter of Ayurveda and leading the way in the region, with Austria and Switzerland following suit. EUAA is a federation of educational institutions, Ayurvedic organizations, manufacturers, hospitals, distributors, therapists, and suppliers. The EUAA is a non-profit organization that represents 16 European Economic Area countries and institutions. The mission of the organization is to promote Ayurveda as a holistic medicine throughout the region.

Anti-Aging & Longevity Industry Analysis by Top Investment Segments

Which Country is the focus of Complementary and Alternative Medicine for the Anti-aging & Longevity Market?

Over the projected period, the market in the Middle East and Africa is expected to expand at the fastest pace. The long history of adopting spiritual approaches as well as herbal remedies to cure various ailments is projected to drive the regional market throughout the forecast period. In the coming years, Qatar is expected to be the region's fastest-growing market for mind-body therapies.
Competitive Landscape of the Complementary and Alternative Anti-Aging Market

What are the growth prospects of the Traditional Alternative Medicine/Botanicals segment?

In 2020, the traditional alternative medicine or Traditional Alternative Medicine/Botanicals segment accounted for more than 30% of complementary and alternative medicine for anti-aging & longevity sales. Key players have been investing in CAM therapies since the regulatory rules for starting a business in this industry are less strict than for pharmaceutical enterprises. Government actions meanwhile, boost entrepreneur activity in the CAM domain.

Tai Chi is a type of relaxation exercise that assists older adults, especially those with Parkinson's disease, improve their stability, balance, and flexibility. According to a study released in 2021, in older people, the aggregate cerebral vascular hemodynamic index who practiced Tai Chi was similar to that of the young population and showed a substantial improvement when compared to older adults who did not practice Tai Chi.

The segment growth is being boosted by technological breakthroughs in sensory healing. HUSO, for example, is a sound therapy system that uses acupuncture meridians to control and harmonize the body, as well as a tone to cope with stress and harmful electromagnetic fields. Headphones and wrist and ankle padding are included in the product.

Consumer awareness about the benefits of complementary and alternative medicine goods is expected to grow, as is the adoption of innovative sensory healing technology in hospitals and clinics. However, as western medicine becomes more involved in the anti-aging and longevity business, the sector's expansion will be constrained.

What are the predictions for market growth through high-net-worth individuals?

Since several emerging economies perceive CAM products for antiaging and lifespan to be expensive and undercut the need for them, HNWs represent a lucrative consumer pool for complementary and alternative medicine for anti-aging & longevity. Individuals with high net worth in industrialized countries are more inclined than those in poor countries to spend money on complementary and alternative medicine for antiaging and longevity. The low opportunity cost and high social presence are the reasons behind this.

Top Segments Studied in the Anti-Aging and Longevity Market Research Report

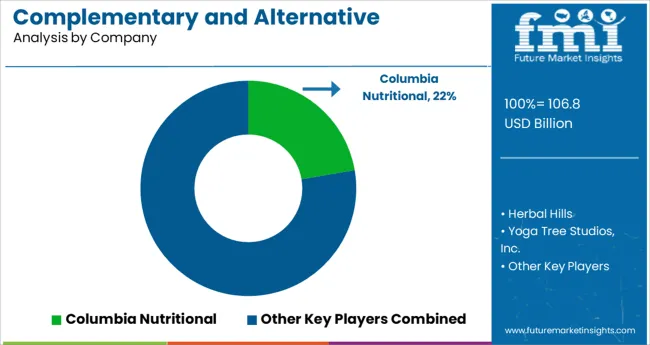
The global market is significantly competitive due to the existence of several companies. Key players focus on growth strategies such as improvement of existing technology, geographic expansion, product launch, and product approval to gain higher market share. Various development strategies help raise consumer awareness of new processes and products, such as product launches and collaborations.

The key players in the global Complementary and Alternative Medicine for Anti-Aging & Longevity market are Anadolu Medical Center, Sinomedica, Acupuncture Enfants, and Ayurveda Kuwait.

Some of the recent developments in complementary and alternative medicine for the anti-aging & longevity market are:

  • In April 2021, Miskawaan Health Group announced the arrival of integrated tailored German cancer medicines in Thailand. Miskawaan Integrative Cancer Care was established in Bangkok by the corporation.
  • In June 2021, the Indian government unveiled the mYoga application, which was created in collaboration with the WHO by the Morarji Desai National Institute of Yoga and the Ministry of Ayush. The app includes audio and video practice and training sessions based on the Common Yoga Protocol. The goal is to promote the concept of one planet, one health.
  • In December 2019, a new clinic in Pinecrest, the second in Florida and the 54th in the USA was opened by Modern Acupuncture. This is intended to broaden the scope of the clinic's acupuncture services in the country, bolstering its market position.

Market Segments Covered in Complementary and Alternative Medicine for Anti-Aging & Longevity Market Analysis

By Intervention Type:

  • Body Healing
    • Yoga
    • Acupuncture & Massage
    • Chiropractic
    • Qigong & Tai chi
    • Kinesiology
    • Reflexology
    • Eurythmy
    • Other Body Healings
  • Traditional Alternative Medicine/Traditional Alternative Medicine/Botanicals
    • Ayurveda
    • Naturopathic Medicine
    • Traditional Chinese Medicine
    • Zang Fu Theory
    • Other Traditional Alternative Medicine/Traditional Alternative Medicine/Botanicals
  • Mind Healing
    • Meditation & Mindfulness
    • Relaxation
    • Other Mind Healings
  • External Energy Healing
    • Magnetic & Electromagnetic therapy
    • Chakra healing
    • Reiki
    • Other External Energy Healings
  • Sensory Healing
    • Aromatherapy
    • Sound healing

By Customer Type:

  • High Net Worth (HNW) Individuals
  • Very High Net Worth (VHNW) Individuals
  • Ultra-high Net Worth (UHNW) Individuals
  • Other Customer Types

By Region:

  • North America
    • USA
    • Canada
  • Europe
    • United Kingdom
    • Germany
    • France
    • Italy
    • Spain
  • Asia Pacific
    • Japan
    • China
    • India
    • Thailand
    • South Korea
  • Latin America
    • Brazil
    • Mexico
    • Argentina
    • Colombia
  • Middle East & Africa
    • South Africa
    • Saudi Arabia
    • United Arab Emirates(UAE)

Table of Content

  • 1. Executive Summary
  • 2. Market Overview
  • 3. Market Background
  • 4. Global Market Analysis 2017 to 2021 and Forecast, 2022 to 2032
  • 5. Global Market Analysis 2017 to 2021 and Forecast 2022 to 2032, By Intervention
    • 5.1. Traditional Alternative Medicine/Botanicals
      • 5.1.1. Ayurveda
      • 5.1.2. Apitherapy
      • 5.1.3. Bach Flower Therapy
      • 5.1.4. Naturopathic Medicine
      • 5.1.5. Traditional Chinese Medicine
      • 5.1.6. Traditional Korean Medicine
      • 5.1.7. Traditional Japanese Medicine
      • 5.1.8. Traditional Mongolian Medicine
      • 5.1.9. Traditional Tibetan Medicine
      • 5.1.10. Zang Fu Theory
    • 5.2. Mind Healing
      • 5.2.1. Autosuggestion
      • 5.2.2. Hypnotherapy
      • 5.2.3. Neuro-linguistic Programming
      • 5.2.4. Self-hypnosis
      • 5.2.5. Other Mind Healing
      • 5.2.6. Auriculotherapy
    • 5.3. Body Healing
      • 5.3.1. Acupressure
      • 5.3.2. Acupuncture
      • 5.3.3. Alexander Technique
      • 5.3.4. Auriculotherapy
      • 5.3.5. Other Body Healing
    • 5.4. External Energy
      • 5.4.1. Magnetic Therapy
      • 5.4.2. Radionics
      • 5.4.3. Reiki
      • 5.4.4. Therapeutic Touch
      • 5.4.5. Chakra Healing
    • 5.5. Sensory Healing
      • 5.5.1. Aromatherapy
      • 5.5.2. Music therapy
      • 5.5.3. Sonopuncture
      • 5.5.4. Sound Therapy
  • 6. Global Market Analysis 2017 to 2021 and Forecast 2022 to 2032, By Distribution Method
    • 6.1. Direct Sales
    • 6.2. E-sales
    • 6.3. Distance Correspondence
  • 7. Global Market Analysis 2017 to 2021 and Forecast 2022 to 2032, By Region
    • 7.1. North America
    • 7.2. Latin America
    • 7.3. Europe
    • 7.4. Asia Pacific
    • 7.5. Middle East and Africa
  • 8. North America Market Analysis 2017 to 2021 and Forecast 2022 to 2032, By Country
  • 9. Latin America Market Analysis 2017 to 2021 and Forecast 2022 to 2032, By Country
  • 10. Europe Market Analysis 2017 to 2021 and Forecast 2022 to 2032, By Country
  • 11. Asia Pacific Market Analysis 2017 to 2021 and Forecast 2022 to 2032, By Country
  • 12. Middle East and Africa Market Analysis 2017 to 2021 and Forecast 2022 to 2032, By Country
  • 13. Key Countries Market Analysis
  • 14. Market Structure Analysis
  • 15. Competition Analysis
    • 15.1. Columbia Nutritional
    • 15.2. Herbal Hills
    • 15.3. Yoga Tree Studios, Inc.
    • 15.4. Helio USA Inc.
    • 15.5. NatureKue
    • 15.6. Nordic Nutraceuticals
    • 15.7. Pure Encapsulations, LLC.
    • 15.8. The Healing Company Ltd.
    • 15.9. Quantum-Touch
    • 15.10. Amrita Ayurveda & Yoga
    • 15.11. Sheng Chang Pharmaceutical Company
    • 15.12. LKK Health Products Group Limited
    • 15.13. Herb Pharm
  • 16. Assumptions & Acronyms Used
  • 17. Research Methodology

List of Tables

Table 1: Global Market Value (US$ Million) Forecast by Region, 2017 to 2032

Table 2: Global Market Volume (Units) Forecast by Region, 2017 to 2032

Table 3: Global Market Value (US$ Million) Forecast by Intervention, 2017 to 2032

Table 4: Global Market Volume (Units) Forecast by Intervention, 2017 to 2032

Table 5: Global Market Value (US$ Million) Forecast by Distribution Method, 2017 to 2032

Table 6: Global Market Volume (Units) Forecast by Distribution Method, 2017 to 2032

Table 7: North America Market Value (US$ Million) Forecast by Country, 2017 to 2032

Table 8: North America Market Volume (Units) Forecast by Country, 2017 to 2032

Table 9: North America Market Value (US$ Million) Forecast by Intervention, 2017 to 2032

Table 10: North America Market Volume (Units) Forecast by Intervention, 2017 to 2032

Table 11: North America Market Value (US$ Million) Forecast by Distribution Method, 2017 to 2032

Table 12: North America Market Volume (Units) Forecast by Distribution Method, 2017 to 2032

Table 13: Latin America Market Value (US$ Million) Forecast by Country, 2017 to 2032

Table 14: Latin America Market Volume (Units) Forecast by Country, 2017 to 2032

Table 15: Latin America Market Value (US$ Million) Forecast by Intervention, 2017 to 2032

Table 16: Latin America Market Volume (Units) Forecast by Intervention, 2017 to 2032

Table 17: Latin America Market Value (US$ Million) Forecast by Distribution Method, 2017 to 2032

Table 18: Latin America Market Volume (Units) Forecast by Distribution Method, 2017 to 2032

Table 19: Europe Market Value (US$ Million) Forecast by Country, 2017 to 2032

Table 20: Europe Market Volume (Units) Forecast by Country, 2017 to 2032

Table 21: Europe Market Value (US$ Million) Forecast by Intervention, 2017 to 2032

Table 22: Europe Market Volume (Units) Forecast by Intervention, 2017 to 2032

Table 23: Europe Market Value (US$ Million) Forecast by Distribution Method, 2017 to 2032

Table 24: Europe Market Volume (Units) Forecast by Distribution Method, 2017 to 2032

Table 25: Asia Pacific Market Value (US$ Million) Forecast by Country, 2017 to 2032

Table 26: Asia Pacific Market Volume (Units) Forecast by Country, 2017 to 2032

Table 27: Asia Pacific Market Value (US$ Million) Forecast by Intervention, 2017 to 2032

Table 28: Asia Pacific Market Volume (Units) Forecast by Intervention, 2017 to 2032

Table 29: Asia Pacific Market Value (US$ Million) Forecast by Distribution Method, 2017 to 2032

Table 30: Asia Pacific Market Volume (Units) Forecast by Distribution Method, 2017 to 2032

Table 31: Middle East and Africa Market Value (US$ Million) Forecast by Country, 2017 to 2032

Table 32: Middle East and Africa Market Volume (Units) Forecast by Country, 2017 to 2032

Table 33: Middle East and Africa Market Value (US$ Million) Forecast by Intervention, 2017 to 2032

Table 34: Middle East and Africa Market Volume (Units) Forecast by Intervention, 2017 to 2032

Table 35: Middle East and Africa Market Value (US$ Million) Forecast by Distribution Method, 2017 to 2032

Table 36: Middle East and Africa Market Volume (Units) Forecast by Distribution Method, 2017 to 2032

List of Figures

Figure 1: Global Market Value (US$ Million) by Intervention, 2022 to 2032

Figure 2: Global Market Value (US$ Million) by Distribution Method, 2022 to 2032

Figure 3: Global Market Value (US$ Million) by Region, 2022 to 2032

Figure 4: Global Market Value (US$ Million) Analysis by Region, 2017 to 2032

Figure 5: Global Market Volume (Units) Analysis by Region, 2017 to 2032

Figure 6: Global Market Value Share (%) and BPS Analysis by Region, 2022 to 2032

Figure 7: Global Market Y-o-Y Growth (%) Projections by Region, 2022 to 2032

Figure 8: Global Market Value (US$ Million) Analysis by Intervention, 2017 to 2032

Figure 9: Global Market Volume (Units) Analysis by Intervention, 2017 to 2032

Figure 10: Global Market Value Share (%) and BPS Analysis by Intervention, 2022 to 2032

Figure 11: Global Market Y-o-Y Growth (%) Projections by Intervention, 2022 to 2032

Figure 12: Global Market Value (US$ Million) Analysis by Distribution Method, 2017 to 2032

Figure 13: Global Market Volume (Units) Analysis by Distribution Method, 2017 to 2032

Figure 14: Global Market Value Share (%) and BPS Analysis by Distribution Method, 2022 to 2032

Figure 15: Global Market Y-o-Y Growth (%) Projections by Distribution Method, 2022 to 2032

Figure 16: Global Market Attractiveness by Intervention, 2022 to 2032

Figure 17: Global Market Attractiveness by Distribution Method, 2022 to 2032

Figure 18: Global Market Attractiveness by Region, 2022 to 2032

Figure 19: North America Market Value (US$ Million) by Intervention, 2022 to 2032

Figure 20: North America Market Value (US$ Million) by Distribution Method, 2022 to 2032

Figure 21: North America Market Value (US$ Million) by Country, 2022 to 2032

Figure 22: North America Market Value (US$ Million) Analysis by Country, 2017 to 2032

Figure 23: North America Market Volume (Units) Analysis by Country, 2017 to 2032

Figure 24: North America Market Value Share (%) and BPS Analysis by Country, 2022 to 2032

Figure 25: North America Market Y-o-Y Growth (%) Projections by Country, 2022 to 2032

Figure 26: North America Market Value (US$ Million) Analysis by Intervention, 2017 to 2032

Figure 27: North America Market Volume (Units) Analysis by Intervention, 2017 to 2032

Figure 28: North America Market Value Share (%) and BPS Analysis by Intervention, 2022 to 2032

Figure 29: North America Market Y-o-Y Growth (%) Projections by Intervention, 2022 to 2032

Figure 30: North America Market Value (US$ Million) Analysis by Distribution Method, 2017 to 2032

Figure 31: North America Market Volume (Units) Analysis by Distribution Method, 2017 to 2032

Figure 32: North America Market Value Share (%) and BPS Analysis by Distribution Method, 2022 to 2032

Figure 33: North America Market Y-o-Y Growth (%) Projections by Distribution Method, 2022 to 2032

Figure 34: North America Market Attractiveness by Intervention, 2022 to 2032

Figure 35: North America Market Attractiveness by Distribution Method, 2022 to 2032

Figure 36: North America Market Attractiveness by Country, 2022 to 2032

Figure 37: Latin America Market Value (US$ Million) by Intervention, 2022 to 2032

Figure 38: Latin America Market Value (US$ Million) by Distribution Method, 2022 to 2032

Figure 39: Latin America Market Value (US$ Million) by Country, 2022 to 2032

Figure 40: Latin America Market Value (US$ Million) Analysis by Country, 2017 to 2032

Figure 41: Latin America Market Volume (Units) Analysis by Country, 2017 to 2032

Figure 42: Latin America Market Value Share (%) and BPS Analysis by Country, 2022 to 2032

Figure 43: Latin America Market Y-o-Y Growth (%) Projections by Country, 2022 to 2032

Figure 44: Latin America Market Value (US$ Million) Analysis by Intervention, 2017 to 2032

Figure 45: Latin America Market Volume (Units) Analysis by Intervention, 2017 to 2032

Figure 46: Latin America Market Value Share (%) and BPS Analysis by Intervention, 2022 to 2032

Figure 47: Latin America Market Y-o-Y Growth (%) Projections by Intervention, 2022 to 2032

Figure 48: Latin America Market Value (US$ Million) Analysis by Distribution Method, 2017 to 2032

Figure 49: Latin America Market Volume (Units) Analysis by Distribution Method, 2017 to 2032

Figure 50: Latin America Market Value Share (%) and BPS Analysis by Distribution Method, 2022 to 2032

Figure 51: Latin America Market Y-o-Y Growth (%) Projections by Distribution Method, 2022 to 2032

Figure 52: Latin America Market Attractiveness by Intervention, 2022 to 2032

Figure 53: Latin America Market Attractiveness by Distribution Method, 2022 to 2032

Figure 54: Latin America Market Attractiveness by Country, 2022 to 2032

Figure 55: Europe Market Value (US$ Million) by Intervention, 2022 to 2032

Figure 56: Europe Market Value (US$ Million) by Distribution Method, 2022 to 2032

Figure 57: Europe Market Value (US$ Million) by Country, 2022 to 2032

Figure 58: Europe Market Value (US$ Million) Analysis by Country, 2017 to 2032

Figure 59: Europe Market Volume (Units) Analysis by Country, 2017 to 2032

Figure 60: Europe Market Value Share (%) and BPS Analysis by Country, 2022 to 2032

Figure 61: Europe Market Y-o-Y Growth (%) Projections by Country, 2022 to 2032

Figure 62: Europe Market Value (US$ Million) Analysis by Intervention, 2017 to 2032

Figure 63: Europe Market Volume (Units) Analysis by Intervention, 2017 to 2032

Figure 64: Europe Market Value Share (%) and BPS Analysis by Intervention, 2022 to 2032

Figure 65: Europe Market Y-o-Y Growth (%) Projections by Intervention, 2022 to 2032

Figure 66: Europe Market Value (US$ Million) Analysis by Distribution Method, 2017 to 2032

Figure 67: Europe Market Volume (Units) Analysis by Distribution Method, 2017 to 2032

Figure 68: Europe Market Value Share (%) and BPS Analysis by Distribution Method, 2022 to 2032

Figure 69: Europe Market Y-o-Y Growth (%) Projections by Distribution Method, 2022 to 2032

Figure 70: Europe Market Attractiveness by Intervention, 2022 to 2032

Figure 71: Europe Market Attractiveness by Distribution Method, 2022 to 2032

Figure 72: Europe Market Attractiveness by Country, 2022 to 2032

Figure 73: Asia Pacific Market Value (US$ Million) by Intervention, 2022 to 2032

Figure 74: Asia Pacific Market Value (US$ Million) by Distribution Method, 2022 to 2032

Figure 75: Asia Pacific Market Value (US$ Million) by Country, 2022 to 2032

Figure 76: Asia Pacific Market Value (US$ Million) Analysis by Country, 2017 to 2032

Figure 77: Asia Pacific Market Volume (Units) Analysis by Country, 2017 to 2032

Figure 78: Asia Pacific Market Value Share (%) and BPS Analysis by Country, 2022 to 2032

Figure 79: Asia Pacific Market Y-o-Y Growth (%) Projections by Country, 2022 to 2032

Figure 80: Asia Pacific Market Value (US$ Million) Analysis by Intervention, 2017 to 2032

Figure 81: Asia Pacific Market Volume (Units) Analysis by Intervention, 2017 to 2032

Figure 82: Asia Pacific Market Value Share (%) and BPS Analysis by Intervention, 2022 to 2032

Figure 83: Asia Pacific Market Y-o-Y Growth (%) Projections by Intervention, 2022 to 2032

Figure 84: Asia Pacific Market Value (US$ Million) Analysis by Distribution Method, 2017 to 2032

Figure 85: Asia Pacific Market Volume (Units) Analysis by Distribution Method, 2017 to 2032

Figure 86: Asia Pacific Market Value Share (%) and BPS Analysis by Distribution Method, 2022 to 2032

Figure 87: Asia Pacific Market Y-o-Y Growth (%) Projections by Distribution Method, 2022 to 2032

Figure 88: Asia Pacific Market Attractiveness by Intervention, 2022 to 2032

Figure 89: Asia Pacific Market Attractiveness by Distribution Method, 2022 to 2032

Figure 90: Asia Pacific Market Attractiveness by Country, 2022 to 2032

Figure 91: Middle East and Africa Market Value (US$ Million) by Intervention, 2022 to 2032

Figure 92: Middle East and Africa Market Value (US$ Million) by Distribution Method, 2022 to 2032

Figure 93: Middle East and Africa Market Value (US$ Million) by Country, 2022 to 2032

Figure 94: Middle East and Africa Market Value (US$ Million) Analysis by Country, 2017 to 2032

Figure 95: Middle East and Africa Market Volume (Units) Analysis by Country, 2017 to 2032

Figure 96: Middle East and Africa Market Value Share (%) and BPS Analysis by Country, 2022 to 2032

Figure 97: Middle East and Africa Market Y-o-Y Growth (%) Projections by Country, 2022 to 2032

Figure 98: Middle East and Africa Market Value (US$ Million) Analysis by Intervention, 2017 to 2032

Figure 99: Middle East and Africa Market Volume (Units) Analysis by Intervention, 2017 to 2032

Figure 100: Middle East and Africa Market Value Share (%) and BPS Analysis by Intervention, 2022 to 2032

Figure 101: Middle East and Africa Market Y-o-Y Growth (%) Projections by Intervention, 2022 to 2032

Figure 102: Middle East and Africa Market Value (US$ Million) Analysis by Distribution Method, 2017 to 2032

Figure 103: Middle East and Africa Market Volume (Units) Analysis by Distribution Method, 2017 to 2032

Figure 104: Middle East and Africa Market Value Share (%) and BPS Analysis by Distribution Method, 2022 to 2032

Figure 105: Middle East and Africa Market Y-o-Y Growth (%) Projections by Distribution Method, 2022 to 2032

Figure 106: Middle East and Africa Market Attractiveness by Intervention, 2022 to 2032

Figure 107: Middle East and Africa Market Attractiveness by Distribution Method, 2022 to 2032

Figure 108: Middle East and Africa Market Attractiveness by Country, 2022 to 2032

Frequently Asked Questions

How big is the Complementary and Alternative Medicine for Anti-Aging & Longevity Market?

The global Complementary and Alternative Medicine for Anti-Aging & Longevity market size was estimated at USD 36.5 Billion in 2021 and is estimated to grow further to USD 44.6 Billion in 2022.

What is the sales forecast of Complementary and Alternative Medicine for Anti-Aging & Longevity Market?

The value of Complementary and Alternative Medicine for the Anti-Aging & Longevity Market is projected to increase at a CAGR of around 24.4% from 2022 to 2032.

What was the last 5 year’s market CAGR?

The value of Complementary and Alternative Medicine for the Anti-Aging & Longevity Market increased at a CAGR of around 20.9% from 2017 to 2021.

What is driving revenue for the Complementary and Alternative Medicine for Anti-Aging & Longevity Market?

The market for complementary and alternative medicine (CAM) for antiaging and lifespan will be driven by the growing aging population and diseases linked with it.

Which are the top 5 countries driving demand for the Complementary and Alternative Medicine for Anti-Aging & Longevity Market?

The top 5 countries driving demand for the Complementary and Alternative Medicine for Anti-Aging & Longevity Market are the USA, China, Japan, the United Kingdom, and South Korea

What is the outlook for the market in USA?

USA accounted for over 40% of global Complementary and Alternative Medicine for Anti-Aging & Longevity Market demand in 2021.

At what percentage are Complementary and Alternative Medicine for Anti-Aging & Longevity Market sales going to register growth in United Kingdom?

The United Kingdom market for Complementary and Alternative Medicine for Anti-Aging & Longevity Market is projected to expand at a CAGR of around 22.8% from 2022 to 2032.

Explore Similar Insights

Future Market Insights

Complementary and Alternative Medicine for Anti Aging & Longetivity Market