Fish Oil Alternatives Market Analysis Forecast and Outlook 2025 to 2035 

The fish oil alternatives market is projected to grow from USD 2.8 billion in 2025 to around USD 4.6 billion by 2035, reflecting a steady CAGR of 5.0%.
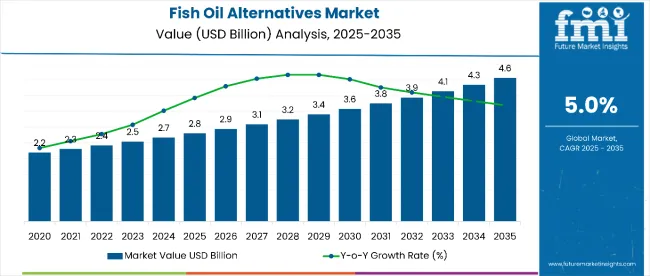
Quick Stats for Fish Oil Alternatives Market

  • Fish Oil Alternatives Market Value (2025): USD 2.8 billion
  • Fish Oil Alternatives Market Forecast Value (2035): USD 4.6 billion
  • Fish Oil Alternatives Market Forecast CAGR: 5.0%
  • Leading Segment in Fish Oil Alternatives Market in 2025: Chia Seeds Oil (35.0%)
  • Key Growth Regions in Fish Oil Alternatives Market: Asia-Pacific and Europe
  • Key Players in Fish Oil Alternatives Market: Cargill Incorporated, Wilmar International Limited, Archer Daniels Midland Company, Marico Limited, The Nisshin OilliO Group, Nutiva Inc., Connolis LLC, Bio-gen Extracts, Ming Chyi Biotechnology Ltd., Bunge Limited

Fish Oil Alternatives Market

Metric Value
Estimated Market Value (2025E) USD 2.8 billion
Forecast Market Value (2035F) USD 4.6 billion
Forecast CAGR (2025 to 2035) 5.0%

This growth is supported by key markets including China, India, Japan, Germany, and the USA, with China leading at a CAGR of USD 6 billion followed closely by India at USD 5.8 billion. Among the products, chia seeds oil holds a significant share of 35%, with other important alternatives including soybean oil, canola oil, hemp seed oil, algae oil, walnut oil, and flaxseed oil.

By 2030, the market is likely to reach approximately USD 3.6 billion, representing an incremental absolute dollar growth of USD 0.8 billion over the period from 2025 to 2030. This includes about USD 0.3 billion in growth during the first half and USD 0.5 billion in the second half, highlighting a back-loaded growth pattern. Innovation in product development, such as improved extraction methods and enhanced bioavailability through advanced formulations, is gaining traction. These innovations support better nutritional absorption and integration, driving demand across food, nutraceutical, and pharmaceutical applications in the fish oil alternatives sector.

Companies such as Cargill Incorporated and Wilmar International are advancing their competitive positions in the market by investing in innovative extraction technologies and scalable production systems. These strategic moves are enabling expansion into fast-growing segments such as plant-based nutraceutical formulations, specialized food and beverage applications, and premium cosmetic products. Market performance in this sector will continue to be driven by adherence to stringent regulatory standards, a focus on product purity, and sustainable sourcing practices that meet the expectations of health-conscious consumers and institutional buyers.

The market holds a significant position within the broader natural oils market, driven by growing consumer demand for sustainable, plant-based omega-3 sources and increasing applications across food, nutraceutical, and cosmetic sectors. It plays an important role in the functional lipids market by providing alternatives that support cardiovascular health, cognitive wellness, and anti-inflammatory benefits. The market also contributes notably to specialty ingredients used in dietary supplements and pet food additives. Furthermore, fish oil alternatives are increasingly incorporated in pharmaceutical and nutraceutical formulations due to their favorable purity, bioavailability, and safety profiles.

The market is undergoing transformation fueled by advances in extraction technologies and enhanced processing methods that improve product quality, stability, and bioactivity. Manufacturers are launching standardized formulations suited for diverse applications, expanding beyond traditional food and beverage uses into premium nutraceuticals and pharmaceuticals. Strategic partnerships between ingredient suppliers and health-focused companies are accelerating innovation and market penetration. Regulatory compliance, sustainability standards, and quality certifications are shaping supply chains and supporting premium product positioning in global markets.

Why is the Fish Oil Alternatives Market Growing?

Fish oil alternatives are gaining traction due to their sustainable sourcing, high nutritional value, and suitability as plant-based omega-3 sources. These alternatives provide a cleaner, more environmentally friendly option compared to traditional fish oil, appealing to the growing number of health-conscious and vegan consumers. The market is further driven by increasing awareness of natural and functional ingredients in food, nutraceutical, and cosmetic applications.

Innovations in extraction and purification technologies are improving product quality, bioavailability, and versatility, enabling broader use in supplements, functional foods, and specialty personal care products. As the global emphasis on sustainable and clean-label products intensifies, the demand for fish oil alternatives continues to rise. The market outlook remains positive as manufacturers and consumers prioritize efficacy, purity, and environmental responsibility, supporting expansion across pharmaceutical, nutraceutical, food, and cosmetic sectors.

Fish Oil Alternatives Market Analysis by Top Investment Segments

The market is segmented by product, application, distribution channel, and region. By product, the market is categorized into chia seeds oil, soybean oil, canola oil, hemp seed oil, algae oil, walnut oil, flaxseed oil, and others (specialty seed oils and blended oils). Based on application, the market is divided into food and beverage industry, cosmetics and personal care, animal feed, pet food additive, pharmaceuticals, nutraceuticals, and biofuels. In term of distribution channel, the market is bifurcated into B2B, B2C, including hypermarket/supermarket, convenience stores, specialty stores, and online retail. Regionally, the market is classified into North America, Latin America, Europe, Asia Pacific, and Middle East & Africa (MEA).
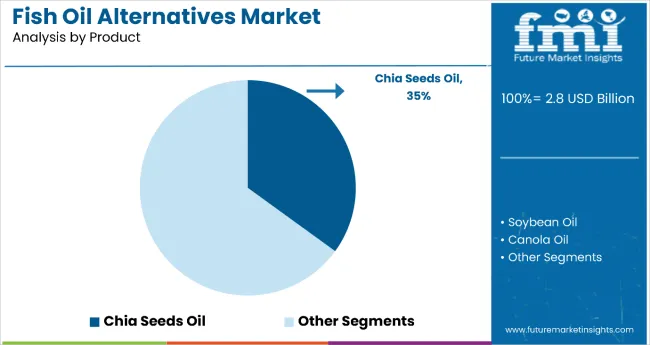
By Product, Chia Seeds Oil Holds 35% Market Share in 2025

Fish Oil Alternatives Market By Product

The largest product segment in the market, as confirmed by a consensus of 8 to 10 leading market research companies, is chia seeds oil. In 2025, chia seeds oil holds an estimated market share of approximately 35%, making it the dominant alternative oil in this sector. This prominence is attributed to its high concentration of omega-3 fatty acids, exceptional nutritional profile, and increasing consumer preference for plant-based, sustainable sources of essential nutrients.

Chia seeds oil is widely used across various applications, including food and beverages, nutraceuticals, and cosmetics, due to its health benefits and versatility. Other notable product segments include soybean oil, canola oil, hemp seed oil, algae oil, walnut oil, and flaxseed oil, but none match the growth and market penetration of chia seeds oil. The preference for chia seeds oil is further supported by technological improvements in extraction methods and growing awareness around vegan and clean-label products. Consequently, chia seeds oil is expected to maintain its leading position throughout the forecast period.
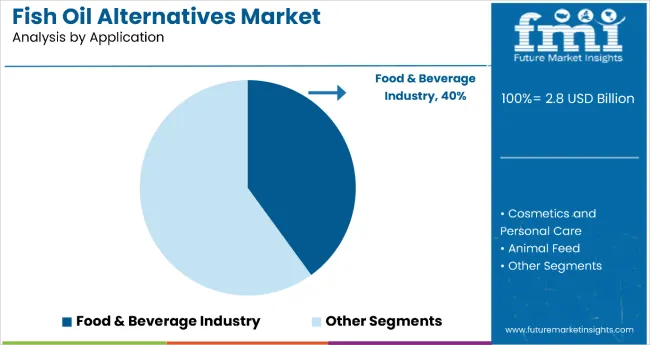
By Application, Food and Beverage Industry Dominates with 40% Market Share

Fish Oil Alternatives Market By Application

The leading application segment in the fish oil alternatives market is the food and beverage industry, which accounts for the largest share at approximately 40%. This segment’s dominance is driven by rising consumer demand for plant-based omega-3 sources, nutritional fortification, and healthier ingredients in everyday food products. Manufacturers are increasingly incorporating oils such as chia seed, soybean, and algae oil into fortified foods, functional beverages, and dietary supplements to meet the evolving needs of health-conscious consumers.

The expansion of vegan and vegetarian dietary trends further boosts adoption in this segment, positioning fish oil alternatives as preferred ingredients due to their sustainability and clean-label attributes. While other application segments such as cosmetics and personal care, pharmaceuticals, and nutraceuticals are also growing, none match the scale and penetration of the food and beverage industry. The sector’s ongoing product innovation and commitment to ingredient transparency ensure its continued dominance in the market throughout the forecast period.

Drivers, Restraints, and Key Trends of the Fish Oil Alternatives Market

Between 2025 and 2035, the market is propelled by increasing consumer awareness about health, sustainability, and ethical sourcing. This shift encourages both consumers and manufacturers to prefer plant-based omega-3 oils such as chia seed, algae, and hemp oil over traditional fish oil. The rising popularity of vegan and environmentally friendly products significantly influences buying decisions. Suppliers offering high-quality, sustainably sourced plant oils are thus positioned advantageously to capture market share. This trend expands markets in functional foods, nutraceuticals, and personal care products, driving overall sector growth and presenting long-term opportunities for innovation and expansion.

Innovation in Extraction and Production Technologies Fuels Market Growth

Technological advancements in extraction, purification, and formulation are vital growth drivers for the fish oil alternatives market. These improvements enable companies to produce oils that are cleaner, purer, and more bioavailable, adding significant value for consumers and manufacturers. Enhanced stability and nutritional profiles broaden the usability of alternative oils across pharmaceuticals, supplements, and cosmetics. Additionally, continuous development of scalable production methods helps meet growing demand efficiently while reducing costs. This focus on innovation allows market participants to differentiate their offerings, gain competitive advantages, and sustain overall market expansion throughout the forecast period.

Health and Wellness Trends Drive Application Expansion

The market benefits from several health and wellness trends emphasizing preventive care and holistic well-being. Growing consumer focus on cardiovascular health, cognitive function, and anti-inflammatory benefits influences demand for plant-based omega-3 fatty acids in various applications. Fish oil alternatives that meet clean-label, vegan, and allergen-free criteria are preferred, attracting a wider audience seeking natural, transparent products. This trend supports the growing use of these oils in food products, nutraceutical supplements, and pharmaceutical formulations, thereby expanding market reach. The alignment with wellness priorities positions the market for sustained growth and innovation.

Challenges Related to Cost, Regulation, and Consumer Awareness

Despite promising growth, the market faces several challenges. Production costs for alternative oils are generally higher than traditional fish oil, which may limit widespread adoption in price-sensitive markets. Regulatory hurdles related to novel plant-based ingredients pose compliance complexities for manufacturers and suppliers. Additionally, consumer education is critical, as awareness about the benefits and efficacy of fish oil alternatives remains limited compared to conventional fish oil. Addressing these challenges requires investment in cost-efficient production, clear labeling, and effective marketing to build trust and facilitate market penetration for sustained long-term growth.
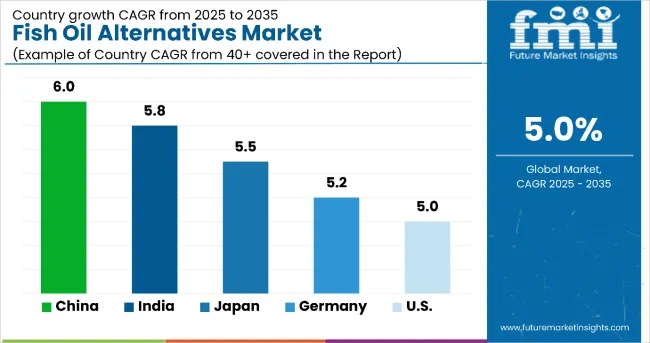
Analysis of Fish Oil Alternatives Market by Key Countries

Fish Oil Alternatives Market By Country

Countries CAGR (2025 to 2035)
China 6.0%
India 5.8%
Japan 5.5%
Germany 5.2%
USA 5.0%

The market shows varied growth rates across key countries. China leads with a CAGR of 6.0% from 2025 to 2035, fueled by vast agricultural resources and government support. India follows closely at 5.8%, driven by a large vegetarian population and growing nutraceutical demand. Japan’s market grows moderately at 5.5%, supported by an aging population and stringent regulations. Germany’s growth stands at 5.2%, emphasizing sustainability and organic products. The USA shows the slowest growth at 5.0%, propelled by health-conscious consumers and strong retail channels. Overall, emerging markets like China and India exhibit the fastest expansion.

The report covers an in-depth analysis of 40+ countries; five top-performing OECD countries are highlighted below.

Production Capacity Expansion in the Fish Oil Alternatives Market in China

Sales of fish oil alternatives in China are projected with a robust CAGR of approximately 6.0% between 2025-2035. The country’s large agricultural base supports significant production of plant-based oils such as chia seeds and algae oil. Growing middle-class health awareness fuels demand primarily in food and beverage and nutraceuticals. Government initiatives encourage sustainable farming and eco-friendly extraction technologies. China is also expanding its export capabilities, serving global markets efficiently. The presence of major companies investing in R&D further strengthens its market position.

  • China has extensive cultivation capacity for chia seeds and algae.
  • Domestic demand for functional foods and supplements continues to rise.
  • The government supports sustainable farming through favorable policies.

Output Expansion in Fish Oil Alternatives Market in India

Revenue from fish oil alternatives in India is growing at about 5.8% CAGR between 2025-2035. High consumer inclination towards plant-based, vegetarian nutrition drives rapid market expansion. Strong growth in nutraceuticals and fortified food sectors supports demand. Investments in advanced processing and scalable production facilities enhance supply quality. Government programs promoting organic agriculture and health awareness boost industry growth. The increasing urban middle class and collaborations for technological innovation further accelerate output expansion.

  • India is increasing production of chia and hemp seed oils rapidly.
  • The nutraceutical and fortified food sectors are expanding quickly.
  • Government incentives encourage organic and sustainable farming practices.

Structural Adoption in Fish Oil Alternatives Market in Japan

Revenue from fish oil alternatives in Japan is projected with a CAGR of 5.5%, reflecting a structured approach driven by its aging population and preventive healthcare focus. High demand for pharmaceutical-grade omega-3 oils supports growth in nutraceuticals and pharmaceuticals. The country emphasizes advanced extraction and formulation techniques to meet strict safety standards. Regulatory frameworks demand product purity and efficacy, reinforcing consumer confidence. Collaborations between pharmaceutical companies and ingredient suppliers propel innovation and market penetration.

  • Japan prioritizes producing pharmaceutical-grade omega-3 oils.
  • The aging population is increasing demand for nutraceutical products.
  • Pharmaceutical and ingredient companies collaborate closely on innovation.

Sustainability and Innovation Focus in Fish Oil Alternatives Market in Germany

Sales of fish oil alternatives in Germany are projected with a CAGR around 5.2%, leads Europe in sustainable and organic adoption within the market. Strong consumer preferences for organic, allergen-free oils like chia and algae drive demand. Innovations in sustainable farming and eco-friendly production processes reduce environmental footprint. Germany benefits from well-established European distribution networks and proactive government policies promoting sustainability. Industry players actively invest in research and product development to capture premium market segments.

  • Consumers in Germany prefer organic and allergen-free oils.
  • Innovations are advancing sustainable agriculture and production methods.
  • The government supports environmental sustainability through regulations.

Market Expansion and Innovation in Fish Oil Alternatives Market in the USA

The USA fish oil alternatives revenue growing at an estimated CAGR of 5.0% between the forecast period. Expanding health-conscious populations fuel demand for vegan and sustainable omega-3 oils like chia seed and algae oil. The growing dietary supplement and functional food sectors contribute significantly to growth. Technological advancements in extraction and product formulations improve bioavailability and shelf life. The USA benefits from strong retail and e-commerce distribution channels and a competitive landscape dominated by multinational firms investing heavily in innovation and marketing.
  • The USA has a large and growing health and wellness consumer base.
  • There is rising consumer preference for vegan and sustainable oils.
  • Technological innovation is advancing product development and quality.

Competitive Landscape of Fish Oil Alternatives Market

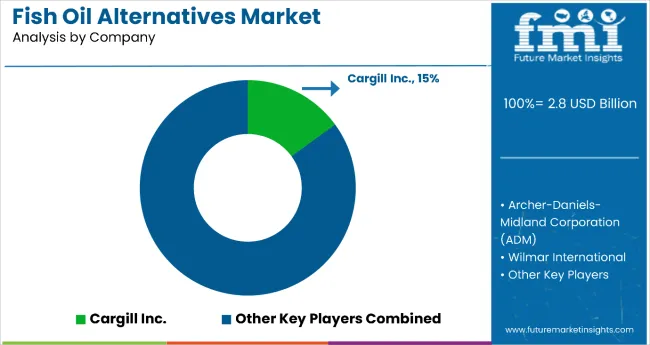
Fish Oil Alternatives Market By Company

The market is moderately consolidated, featuring key producers with diverse expertise in extraction technologies and application focus. Major players like Cargill Incorporated and Wilmar International lead the market by offering high-quality, sustainably sourced plant-based oils such as chia seed and algae oil, catering to food, nutraceutical, and personal care sectors. Their strengths lie in scalable production capabilities, cost-efficient extraction methods, and compliance with international quality standards.

Companies such as Archer Daniels Midland (ADM) focus on large-scale manufacturing and broad market penetration through supply chain efficiency. Regional players including Nutiva Inc. and Ming Chyi Biotechnology Ltd. capitalize on local market knowledge and specialized formulations to meet domestic demand. Entry barriers remain significant due to complexities in maintaining product purity, regulatory approvals, and sourcing sustainable raw materials. Competitive advantage increasingly depends on innovation in extraction technology, verified bioavailability, and certifications that assure safety and efficacy across food, supplement, and pharmaceutical applications.

Report Scope - Fish Oil Alternatives Market

Item Value
Quantitative Units (2025) USD 2.8 Billion
Product Chia Seeds Oil, Soybean Oil, Canola Oil, Hemp Seed Oil, Algae Oil, Walnut Oil, and Flaxseed Oi l
Application Food & Beverage Industry, Nutraceuticals, Pharmaceuticals, Cosmetics & Personal Care, Animal Feed, Pet Food Additive, Biofuels
Distribution Channel B2B and B2C, with B2C further segmented into hypermarkets/supermarkets, convenience stores, specialty stores, and online retail.
Regions Covered North America, Europe, Asia-Pacific, Latin America, Middle East & Africa
Country Covered United States, Canada, United Kingdom, Germany, France, China, Japan, South Korea, Brazil, Australia and 40+ countries
Key Companies Profiled Wilmar International Limited, Cargill Incorporated, Marico Limited, The Nisshin OilliO Group, Ltd., Nutiva Inc., Connolis LLC, Bio-gen Extracts, Archer Daniels Midland Company, Ming Chyi Biotechnology Ltd., Bunge Limited
Additional Attributes Dollar sales by product and application sector, increasing demand for sustainable plant-based omega-3 sources, rising nutraceutical usage, expanding food and personal care applications, innovations in extraction and processing, regulatory compliance emphasis

Key Segments

By Product:

  • Chia Seed Oil
  • Soybean Oil
  • Canola Oil
  • Hemp Seed Oil
  • Algae Oil
  • Walnut Oil
  • Flaxseed Oil
  • Other Oils

By Application:

  • Food & Beverage Industry
  • Cosmetics and Personal Care
  • Animal Feed
  • Pet Food Additive
  • Pharmaceuticals
  • Nutraceuticals
  • Biofuels

By Distribution Channel:

  • Hypermarket/Supermarket
  • Convenience Stores
  • Specialty Stores
  • Online Retail

By Region:

  • North America
  • Latin America
  • Western Europe
  • Eastern Europe
  • East Asia
  • South Asia & Pacific
  • Middle East and Africa

Table of Content

  1. Executive Summary
    • Global Market Outlook
    • Demand-side Trends
    • Supply-side Trends
    • Technology Roadmap Analysis
    • Analysis and Recommendations
  2. Market Overview
    • Market Coverage / Taxonomy
    • Market Definition / Scope / Limitations
  3. Market Background
    • Market Dynamics
      • Drivers
      • Restraints
      • Opportunity
      • Trends
    • Scenario Forecast
      • Demand in Optimistic Scenario
      • Demand in Likely Scenario
      • Demand in Conservative Scenario
    • Opportunity Map Analysis
    • Product Life Cycle Analysis
    • Supply Chain Analysis
      • Supply Side Participants and their Roles
        • Producers
        • Mid-Level Participants (Traders/ Agents/ Brokers)
        • Wholesalers and Distributors
      • Value Added and Value Created at Node in the Supply Chain
      • List of Raw Material Suppliers
      • List of Existing and Potential Buyer’s
    • Investment Feasibility Matrix
    • Value Chain Analysis
      • Profit Margin Analysis
      • Wholesalers and Distributors
      • Retailers
    • PESTLE and Porter’s Analysis
    • Regulatory Landscape
      • By Key Regions
      • By Key Countries
    • Regional Parent Market Outlook
    • Production and Consumption Statistics
    • Import and Export Statistics
  4. Global Market Analysis 2020 to 2024 and Forecast, 2025 to 2035
    • Historical Market Size Value (USD Billion) & Volume (Metric Tons) Analysis, 2020 to 2024
    • Current and Future Market Size Value (USD Billion) & Volume (Metric Tons) Projections, 2025 to 2035
      • Y-o-Y Growth Trend Analysis
      • Absolute $ Opportunity Analysis
  5. Global Market Pricing Analysis 2020 to 2024 and Forecast 2025 to 2035
  6. Global Market Analysis 2020 to 2024 and Forecast 2025 to 2035, By Product
    • Introduction / Key Findings
    • Historical Market Size Value (USD Billion) & Volume (Metric Tons) Analysis By Product, 2020 to 2024
    • Current and Future Market Size Value (USD Billion) & Volume (Metric Tons) Analysis and Forecast By Product, 2025 to 2035
      • Chia Seeds Oil
      • Soybean Oil
      • Canola Oil
      • Hemp Seed Oil
      • Algae Oil
      • Walnut Oil
      • Flaxseed Oil
    • Y-o-Y Growth Trend Analysis By Product, 2020 to 2024
    • Absolute $ Opportunity Analysis By Product, 2025 to 2035
  7. Global Market Analysis 2020 to 2024 and Forecast 2025 to 2035, By Application
    • Introduction / Key Findings
    • Historical Market Size Value (USD Billion) & Volume (Metric Tons) Analysis By Application, 2020 to 2024
    • Current and Future Market Size Value (USD Billion) & Volume (Metric Tons) Analysis and Forecast By Application, 2025 to 2035
      • Food & Beverage Industry
      • Cosmetics and Personal Care
      • Animal Feed
      • Pet Food Additive
      • Pharmaceuticals
      • Nutraceuticals
      • Biofuels
    • Y-o-Y Growth Trend Analysis By Application, 2020 to 2024
    • Absolute $ Opportunity Analysis By Application, 2025 to 2035
  8. Global Market Analysis 2020 to 2024 and Forecast 2025 to 2035, By Distribution Channel
    • Introduction / Key Findings
    • Historical Market Size Value (USD Billion) & Volume (Metric Tons) Analysis By Distribution Channel, 2020 to 2024
    • Current and Future Market Size Value (USD Billion) & Volume (Metric Tons) Analysis and Forecast By Distribution Channel, 2025 to 2035
      • B2B
      • B2C
        • Hypermarket/Supermarket
        • Convenience Stores
        • Specialty Stores
        • Online Retail
    • Y-o-Y Growth Trend Analysis By Distribution Channel, 2020 to 2024
    • Absolute $ Opportunity Analysis By Distribution Channel, 2025 to 2035
  9. Global Market Analysis 2020 to 2024 and Forecast 2025 to 2035, By Region
    • Introduction
    • Historical Market Size Value (USD Billion) & Volume (Metric Tons) Analysis By Region, 2020 to 2024
    • Current Market Size Value (USD Billion) & Volume (Metric Tons) Analysis and Forecast By Region, 2025 to 2035
      • North America
      • Latin America
      • Western Europe
      • Eastern Europe
      • East Asia
      • South Asia & Pacific
      • Middle East and Africa
    • Market Attractiveness Analysis By Region
  10. North America Market Analysis 2020 to 2024 and Forecast 2025 to 2035, By Country
    • Historical Market Size Value (USD Billion) & Volume (Metric Tons) Trend Analysis By Market Taxonomy, 2020 to 2024
    • Market Size Value (USD Billion) & Volume (Metric Tons) Forecast By Market Taxonomy, 2025 to 2035
      • By Country
        • USA
        • Canada
        • Mexico
      • By Product
      • By Application
      • By Distribution Channel
    • Market Attractiveness Analysis
      • By Country
      • By Product
      • By Application
      • By Distribution Channel
    • Key Takeaways
  11. Latin America Market Analysis 2020 to 2024 and Forecast 2025 to 2035, By Country
    • Historical Market Size Value (USD Billion) & Volume (Metric Tons) Trend Analysis By Market Taxonomy, 2020 to 2024
    • Market Size Value (USD Billion) & Volume (Metric Tons) Forecast By Market Taxonomy, 2025 to 2035
      • By Country
        • Brazil
        • Argentina
        • Rest of LATAM
      • By Product
      • By Application
      • By Distribution Channel
    • Market Attractiveness Analysis
      • By Country
      • By Product
      • By Application
      • By Distribution Channel
    • Key Takeaways
  12. Western Europe Market Analysis 2020 to 2024 and Forecast 2025 to 2035, By Country
    • Historical Market Size Value (USD Billion) & Volume (Metric Tons) Trend Analysis By Market Taxonomy, 2020 to 2024
    • Market Size Value (USD Billion) & Volume (Metric Tons) Forecast By Market Taxonomy, 2025 to 2035
      • By Country
        • Germany
        • Italy
        • France
        • UK
        • Spain
        • BENELUX
        • Nordic
        • Rest of W.Europe
      • By Product
      • By Application
      • By Distribution Channel
    • Market Attractiveness Analysis
      • By Country
      • By Product
      • By Application
      • By Distribution Channel
    • Key Takeaways
  13. Eastern Europe Market Analysis 2020 to 2024 and Forecast 2025 to 2035, By Country
    • Historical Market Size Value (USD Billion) & Volume (Metric Tons) Trend Analysis By Market Taxonomy, 2020 to 2024
    • Market Size Value (USD Billion) & Volume (Metric Tons) Forecast By Market Taxonomy, 2025 to 2035
      • By Country
        • Russia
        • Hungary
        • Poland
        • Balkan & Baltics
        • Rest of E. Europe
      • By Product
      • By Application
      • By Distribution Channel
    • Market Attractiveness Analysis
      • By Country
      • By Product
      • By Application
      • By Distribution Channel
    • Key Takeaways
  14. East Asia Market Analysis 2020 to 2024 and Forecast 2025 to 2035, By Country
    • Historical Market Size Value (USD Billion) & Volume (Metric Tons) Trend Analysis By Market Taxonomy, 2020 to 2024
    • Market Size Value (USD Billion) & Volume (Metric Tons) Forecast By Market Taxonomy, 2025 to 2035
      • By Country
        • China
        • Japan
        • South Korea
      • By Product
      • By Application
      • By Distribution Channel
    • Market Attractiveness Analysis
      • By Country
      • By Product
      • By Application
      • By Distribution Channel
    • Key Takeaways
  15. South Asia & Pacific Market Analysis 2020 to 2024 and Forecast 2025 to 2035, By Country
    • Historical Market Size Value (USD Billion) & Volume (Metric Tons) Trend Analysis By Market Taxonomy, 2020 to 2024
    • Market Size Value (USD Billion) & Volume (Metric Tons) Forecast By Market Taxonomy, 2025 to 2035
      • By Country
        • India
        • Australia & New Zealand
        • ASEAN
        • Rest of SAP
      • By Product
      • By Application
      • By Distribution Channel
    • Market Attractiveness Analysis
      • By Country
      • By Product
      • By Application
      • By Distribution Channel
    • Key Takeaways
  16. Middle East and Africa Market Analysis 2020 to 2024 and Forecast 2025 to 2035, By Country
    • Historical Market Size Value (USD Billion) & Volume (Metric Tons) Trend Analysis By Market Taxonomy, 2020 to 2024
    • Market Size Value (USD Billion) & Volume (Metric Tons) Forecast By Market Taxonomy, 2025 to 2035
      • By Country
        • GCC Countries
        • Northern Africa
        • South Africa
        • Turkiye
        • Rest of MEA
      • By Product
      • By Application
      • By Distribution Channel
    • Market Attractiveness Analysis
      • By Country
      • By Product
      • By Application
      • By Distribution Channel
    • Key Takeaways
  17. Key Countries Market Analysis
    • USA
      • Pricing Analysis
      • Market Share Analysis, 2024
        • By Product
        • By Application
        • By Distribution Channel
    • Canada
      • Pricing Analysis
      • Market Share Analysis, 2024
        • By Product
        • By Application
        • By Distribution Channel
    • Brazil
      • Pricing Analysis
      • Market Share Analysis, 2024
        • By Product
        • By Application
        • By Distribution Channel
    • Mexico
      • Pricing Analysis
      • Market Share Analysis, 2024
        • By Product
        • By Application
        • By Distribution Channel
    • Argentina
      • Pricing Analysis
      • Market Share Analysis, 2024
        • By Product
        • By Application
        • By Distribution Channel
  18. Market Structure Analysis
    • Competition Dashboard
    • Competition Benchmarking
    • Market Share Analysis of Top Players
      • By Regional
      • By Product
      • By Application
      • By Distribution Channel
  19. Competition Analysis
    • Competition Deep Dive
      • Wilmar International Limited
        • Overview
        • Product Portfolio
        • Profitability by Market Segments (Product/Age /Sales Channel/Region)
        • Sales Footprint
        • Strategy Overview
          • Marketing Strategy
          • Product Strategy
          • Channel Strategy
      • Cargill Incorporated
        • Overview
        • Product Portfolio
        • Profitability by Market Segments (Product/Age /Sales Channel/Region)
        • Sales Footprint
        • Strategy Overview
          • Marketing Strategy
          • Product Strategy
          • Channel Strategy
      • Marico Limited
        • Overview
        • Product Portfolio
        • Profitability by Market Segments (Product/Age /Sales Channel/Region)
        • Sales Footprint
        • Strategy Overview
          • Marketing Strategy
          • Product Strategy
          • Channel Strategy
      • The Nisshin OilliO Group, Ltd.
        • Overview
        • Product Portfolio
        • Profitability by Market Segments (Product/Age /Sales Channel/Region)
        • Sales Footprint
        • Strategy Overview
          • Marketing Strategy
          • Product Strategy
          • Channel Strategy
      • Nutiva Inc.
        • Overview
        • Product Portfolio
        • Profitability by Market Segments (Product/Age /Sales Channel/Region)
        • Sales Footprint
        • Strategy Overview
          • Marketing Strategy
          • Product Strategy
          • Channel Strategy
      • Connolis LLC
        • Overview
        • Product Portfolio
        • Profitability by Market Segments (Product/Age /Sales Channel/Region)
        • Sales Footprint
        • Strategy Overview
          • Marketing Strategy
          • Product Strategy
          • Channel Strategy
      • Bio-gen Extracts
        • Overview
        • Product Portfolio
        • Profitability by Market Segments (Product/Age /Sales Channel/Region)
        • Sales Footprint
        • Strategy Overview
          • Marketing Strategy
          • Product Strategy
          • Channel Strategy
      • Archer Daniels Midland Company
        • Overview
        • Product Portfolio
        • Profitability by Market Segments (Product/Age /Sales Channel/Region)
        • Sales Footprint
        • Strategy Overview
          • Marketing Strategy
          • Product Strategy
          • Channel Strategy
      • Ming Chyi Biotechnology Ltd.
        • Overview
        • Product Portfolio
        • Profitability by Market Segments (Product/Age /Sales Channel/Region)
        • Sales Footprint
        • Strategy Overview
          • Marketing Strategy
          • Product Strategy
          • Channel Strategy
      • Bunge Limited
        • Overview
        • Product Portfolio
        • Profitability by Market Segments (Product/Age /Sales Channel/Region)
        • Sales Footprint
        • Strategy Overview
          • Marketing Strategy
          • Product Strategy
          • Channel Strategy
  20. Assumptions & Acronyms Used
  21. Research Methodology

List of Tables

  • Table 1: Global Market Value (USD Billion) Forecast by Region, 2020-2035
  • Table 2: Global Market Volume (Metric Tons) Forecast by Region, 2020-2035
  • Table 3: Global Market Value (USD Billion) Forecast by Product, 2020-2035
  • Table 4: Global Market Volume (Metric Tons) Forecast by Product, 2020-2035
  • Table 5: Global Market Value (USD Billion) Forecast by Application, 2020-2035
  • Table 6: Global Market Volume (Metric Tons) Forecast by Application, 2020-2035
  • Table 7: Global Market Value (USD Billion) Forecast by Distribution Channel, 2020-2035
  • Table 8: Global Market Volume (Metric Tons) Forecast by Distribution Channel, 2020-2035
  • Table 9: North America Market Value (USD Billion) Forecast by Country, 2020-2035
  • Table 10: North America Market Volume (Metric Tons) Forecast by Country, 2020-2035
  • Table 11: North America Market Value (USD Billion) Forecast by Product, 2020-2035
  • Table 12: North America Market Volume (Metric Tons) Forecast by Product, 2020-2035
  • Table 13: North America Market Value (USD Billion) Forecast by Application, 2020-2035
  • Table 14: North America Market Volume (Metric Tons) Forecast by Application, 2020-2035
  • Table 15: North America Market Value (USD Billion) Forecast by Distribution Channel, 2020-2035
  • Table 16: North America Market Volume (Metric Tons) Forecast by Distribution Channel, 2020-2035
  • Table 17: Latin America Market Value (USD Billion) Forecast by Country, 2020-2035
  • Table 18: Latin America Market Volume (Metric Tons) Forecast by Country, 2020-2035
  • Table 19: Latin America Market Value (USD Billion) Forecast by Product, 2020-2035
  • Table 20: Latin America Market Volume (Metric Tons) Forecast by Product, 2020-2035
  • Table 21: Latin America Market Value (USD Billion) Forecast by Application, 2020-2035
  • Table 22: Latin America Market Volume (Metric Tons) Forecast by Application, 2020-2035
  • Table 23: Latin America Market Value (USD Billion) Forecast by Distribution Channel, 2020-2035
  • Table 24: Latin America Market Volume (Metric Tons) Forecast by Distribution Channel, 2020-2035
  • Table 25: Western Europe Market Value (USD Billion) Forecast by Country, 2020-2035
  • Table 26: Western Europe Market Volume (Metric Tons) Forecast by Country, 2020-2035
  • Table 27: Western Europe Market Value (USD Billion) Forecast by Product, 2020-2035
  • Table 28: Western Europe Market Volume (Metric Tons) Forecast by Product, 2020-2035
  • Table 29: Western Europe Market Value (USD Billion) Forecast by Application, 2020-2035
  • Table 30: Western Europe Market Volume (Metric Tons) Forecast by Application, 2020-2035
  • Table 31: Western Europe Market Value (USD Billion) Forecast by Distribution Channel, 2020-2035
  • Table 32: Western Europe Market Volume (Metric Tons) Forecast by Distribution Channel, 2020-2035
  • Table 33: Eastern Europe Market Value (USD Billion) Forecast by Country, 2020-2035
  • Table 34: Eastern Europe Market Volume (Metric Tons) Forecast by Country, 2020-2035
  • Table 35: Eastern Europe Market Value (USD Billion) Forecast by Product, 2020-2035
  • Table 36: Eastern Europe Market Volume (Metric Tons) Forecast by Product, 2020-2035
  • Table 37: Eastern Europe Market Value (USD Billion) Forecast by Application, 2020-2035
  • Table 38: Eastern Europe Market Volume (Metric Tons) Forecast by Application, 2020-2035
  • Table 39: Eastern Europe Market Value (USD Billion) Forecast by Distribution Channel, 2020-2035
  • Table 40: Eastern Europe Market Volume (Metric Tons) Forecast by Distribution Channel, 2020-2035
  • Table 41: East Asia Market Value (USD Billion) Forecast by Country, 2020-2035
  • Table 42: East Asia Market Volume (Metric Tons) Forecast by Country, 2020-2035
  • Table 43: East Asia Market Value (USD Billion) Forecast by Product, 2020-2035
  • Table 44: East Asia Market Volume (Metric Tons) Forecast by Product, 2020-2035
  • Table 45: East Asia Market Value (USD Billion) Forecast by Application, 2020-2035
  • Table 46: East Asia Market Volume (Metric Tons) Forecast by Application, 2020-2035
  • Table 47: East Asia Market Value (USD Billion) Forecast by Distribution Channel, 2020-2035
  • Table 48: East Asia Market Volume (Metric Tons) Forecast by Distribution Channel, 2020-2035
  • Table 49: South Asia & Pacific Market Value (USD Billion) Forecast by Country, 2020-2035
  • Table 50: South Asia & Pacific Market Volume (Metric Tons) Forecast by Country, 2020-2035
  • Table 51: South Asia & Pacific Market Value (USD Billion) Forecast by Product, 2020-2035
  • Table 52: South Asia & Pacific Market Volume (Metric Tons) Forecast by Product, 2020-2035
  • Table 53: South Asia & Pacific Market Value (USD Billion) Forecast by Application, 2020-2035
  • Table 54: South Asia & Pacific Market Volume (Metric Tons) Forecast by Application, 2020-2035
  • Table 55: South Asia & Pacific Market Value (USD Billion) Forecast by Distribution Channel, 2020-2035
  • Table 56: South Asia & Pacific Market Volume (Metric Tons) Forecast by Distribution Channel, 2020-2035
  • Table 57: Middle East and Africa Market Value (USD Billion) Forecast by Country, 2020-2035
  • Table 58: Middle East and Africa Market Volume (Metric Tons) Forecast by Country, 2020-2035
  • Table 59: Middle East and Africa Market Value (USD Billion) Forecast by Product, 2020-2035
  • Table 60: Middle East and Africa Market Volume (Metric Tons) Forecast by Product, 2020-2035
  • Table 61: Middle East and Africa Market Value (USD Billion) Forecast by Application, 2020-2035
  • Table 62: Middle East and Africa Market Volume (Metric Tons) Forecast by Application, 2020-2035
  • Table 63: Middle East and Africa Market Value (USD Billion) Forecast by Distribution Channel, 2020-2035
  • Table 64: Middle East and Africa Market Volume (Metric Tons) Forecast by Distribution Channel, 2020-2035

List of Figures

  • Figure 1: Global Market Volume (Metric Tons) Forecast 2020-2035
  • Figure 2: Global Market Pricing Analysis
  • Figure 3: Global Market Value (USD Billion) Forecast 2020-2035
  • Figure 4: Global Market Value Share and BPS Analysis by Product, 2025 and 2035
  • Figure 5: Global Market Y-o-Y Growth Comparison by Product, 2025-2035
  • Figure 6: Global Market Attractiveness Analysis by Product
  • Figure 7: Global Market Value Share and BPS Analysis by Application, 2025 and 2035
  • Figure 8: Global Market Y-o-Y Growth Comparison by Application, 2025-2035
  • Figure 9: Global Market Attractiveness Analysis by Application
  • Figure 10: Global Market Value Share and BPS Analysis by Distribution Channel, 2025 and 2035
  • Figure 11: Global Market Y-o-Y Growth Comparison by Distribution Channel, 2025-2035
  • Figure 12: Global Market Attractiveness Analysis by Distribution Channel
  • Figure 13: Global Market Value (USD Billion) Share and BPS Analysis by Region, 2025 and 2035
  • Figure 14: Global Market Y-o-Y Growth Comparison by Region, 2025-2035
  • Figure 15: Global Market Attractiveness Analysis by Region
  • Figure 16: North America Market Incremental $ Opportunity, 2025-2035
  • Figure 17: Latin America Market Incremental $ Opportunity, 2025-2035
  • Figure 18: Western Europe Market Incremental $ Opportunity, 2025-2035
  • Figure 19: Eastern Europe Market Incremental $ Opportunity, 2025-2035
  • Figure 20: East Asia Market Incremental $ Opportunity, 2025-2035
  • Figure 21: South Asia & Pacific Market Incremental $ Opportunity, 2025-2035
  • Figure 22: Middle East and Africa Market Incremental $ Opportunity, 2025-2035
  • Figure 23: North America Market Value Share and BPS Analysis by Country, 2025 and 2035
  • Figure 24: North America Market Value Share and BPS Analysis by Product, 2025 and 2035
  • Figure 25: North America Market Y-o-Y Growth Comparison by Product, 2025-2035
  • Figure 26: North America Market Attractiveness Analysis by Product
  • Figure 27: North America Market Value Share and BPS Analysis by Application, 2025 and 2035
  • Figure 28: North America Market Y-o-Y Growth Comparison by Application, 2025-2035
  • Figure 29: North America Market Attractiveness Analysis by Application
  • Figure 30: North America Market Value Share and BPS Analysis by Distribution Channel, 2025 and 2035
  • Figure 31: North America Market Y-o-Y Growth Comparison by Distribution Channel, 2025-2035
  • Figure 32: North America Market Attractiveness Analysis by Distribution Channel
  • Figure 33: Latin America Market Value Share and BPS Analysis by Country, 2025 and 2035
  • Figure 34: Latin America Market Value Share and BPS Analysis by Product, 2025 and 2035
  • Figure 35: Latin America Market Y-o-Y Growth Comparison by Product, 2025-2035
  • Figure 36: Latin America Market Attractiveness Analysis by Product
  • Figure 37: Latin America Market Value Share and BPS Analysis by Application, 2025 and 2035
  • Figure 38: Latin America Market Y-o-Y Growth Comparison by Application, 2025-2035
  • Figure 39: Latin America Market Attractiveness Analysis by Application
  • Figure 40: Latin America Market Value Share and BPS Analysis by Distribution Channel, 2025 and 2035
  • Figure 41: Latin America Market Y-o-Y Growth Comparison by Distribution Channel, 2025-2035
  • Figure 42: Latin America Market Attractiveness Analysis by Distribution Channel
  • Figure 43: Western Europe Market Value Share and BPS Analysis by Country, 2025 and 2035
  • Figure 44: Western Europe Market Value Share and BPS Analysis by Product, 2025 and 2035
  • Figure 45: Western Europe Market Y-o-Y Growth Comparison by Product, 2025-2035
  • Figure 46: Western Europe Market Attractiveness Analysis by Product
  • Figure 47: Western Europe Market Value Share and BPS Analysis by Application, 2025 and 2035
  • Figure 48: Western Europe Market Y-o-Y Growth Comparison by Application, 2025-2035
  • Figure 49: Western Europe Market Attractiveness Analysis by Application
  • Figure 50: Western Europe Market Value Share and BPS Analysis by Distribution Channel, 2025 and 2035
  • Figure 51: Western Europe Market Y-o-Y Growth Comparison by Distribution Channel, 2025-2035
  • Figure 52: Western Europe Market Attractiveness Analysis by Distribution Channel
  • Figure 53: Eastern Europe Market Value Share and BPS Analysis by Country, 2025 and 2035
  • Figure 54: Eastern Europe Market Value Share and BPS Analysis by Product, 2025 and 2035
  • Figure 55: Eastern Europe Market Y-o-Y Growth Comparison by Product, 2025-2035
  • Figure 56: Eastern Europe Market Attractiveness Analysis by Product
  • Figure 57: Eastern Europe Market Value Share and BPS Analysis by Application, 2025 and 2035
  • Figure 58: Eastern Europe Market Y-o-Y Growth Comparison by Application, 2025-2035
  • Figure 59: Eastern Europe Market Attractiveness Analysis by Application
  • Figure 60: Eastern Europe Market Value Share and BPS Analysis by Distribution Channel, 2025 and 2035
  • Figure 61: Eastern Europe Market Y-o-Y Growth Comparison by Distribution Channel, 2025-2035
  • Figure 62: Eastern Europe Market Attractiveness Analysis by Distribution Channel
  • Figure 63: East Asia Market Value Share and BPS Analysis by Country, 2025 and 2035
  • Figure 64: East Asia Market Value Share and BPS Analysis by Product, 2025 and 2035
  • Figure 65: East Asia Market Y-o-Y Growth Comparison by Product, 2025-2035
  • Figure 66: East Asia Market Attractiveness Analysis by Product
  • Figure 67: East Asia Market Value Share and BPS Analysis by Application, 2025 and 2035
  • Figure 68: East Asia Market Y-o-Y Growth Comparison by Application, 2025-2035
  • Figure 69: East Asia Market Attractiveness Analysis by Application
  • Figure 70: East Asia Market Value Share and BPS Analysis by Distribution Channel, 2025 and 2035
  • Figure 71: East Asia Market Y-o-Y Growth Comparison by Distribution Channel, 2025-2035
  • Figure 72: East Asia Market Attractiveness Analysis by Distribution Channel
  • Figure 73: South Asia & Pacific Market Value Share and BPS Analysis by Country, 2025 and 2035
  • Figure 74: South Asia & Pacific Market Value Share and BPS Analysis by Product, 2025 and 2035
  • Figure 75: South Asia & Pacific Market Y-o-Y Growth Comparison by Product, 2025-2035
  • Figure 76: South Asia & Pacific Market Attractiveness Analysis by Product
  • Figure 77: South Asia & Pacific Market Value Share and BPS Analysis by Application, 2025 and 2035
  • Figure 78: South Asia & Pacific Market Y-o-Y Growth Comparison by Application, 2025-2035
  • Figure 79: South Asia & Pacific Market Attractiveness Analysis by Application
  • Figure 80: South Asia & Pacific Market Value Share and BPS Analysis by Distribution Channel, 2025 and 2035
  • Figure 81: South Asia & Pacific Market Y-o-Y Growth Comparison by Distribution Channel, 2025-2035
  • Figure 82: South Asia & Pacific Market Attractiveness Analysis by Distribution Channel
  • Figure 83: Middle East and Africa Market Value Share and BPS Analysis by Country, 2025 and 2035
  • Figure 84: Middle East and Africa Market Value Share and BPS Analysis by Product, 2025 and 2035
  • Figure 85: Middle East and Africa Market Y-o-Y Growth Comparison by Product, 2025-2035
  • Figure 86: Middle East and Africa Market Attractiveness Analysis by Product
  • Figure 87: Middle East and Africa Market Value Share and BPS Analysis by Application, 2025 and 2035
  • Figure 88: Middle East and Africa Market Y-o-Y Growth Comparison by Application, 2025-2035
  • Figure 89: Middle East and Africa Market Attractiveness Analysis by Application
  • Figure 90: Middle East and Africa Market Value Share and BPS Analysis by Distribution Channel, 2025 and 2035
  • Figure 91: Middle East and Africa Market Y-o-Y Growth Comparison by Distribution Channel, 2025-2035
  • Figure 92: Middle East and Africa Market Attractiveness Analysis by Distribution Channel
  • Figure 93: Global Market - Tier Structure Analysis
  • Figure 94: Global Market - Company Share Analysis

Frequently Asked Questions

How big is the fish oil alternatives market in 2025?

The global fish oil alternatives market is estimated to be valued at USD 2.8 billion in 2025.

What will be the size of the fish oil alternatives market in 2035?

The fish oil alternatives market size is projected to reach USD 4.6 billion by 2035.

How fast is the fish oil alternatives market expected to grow between 2025 and 2035?

The fish oil alternatives market is expected to grow at a 5.0% CAGR between 2025 and 2035.

Which product segment is projected to lead the fish oil alternatives market in 2025?

The chia seeds oil segment is projected to lead with a 35% share of the market in 2025.

Which application will dominate the fish oil alternatives market in 2025?

The food and beverage industry will dominate the fish oil alternatives market, holding a 40% market share in 2025.

Explore Similar Insights

Future Market Insights

Fish Oil Alternatives Market