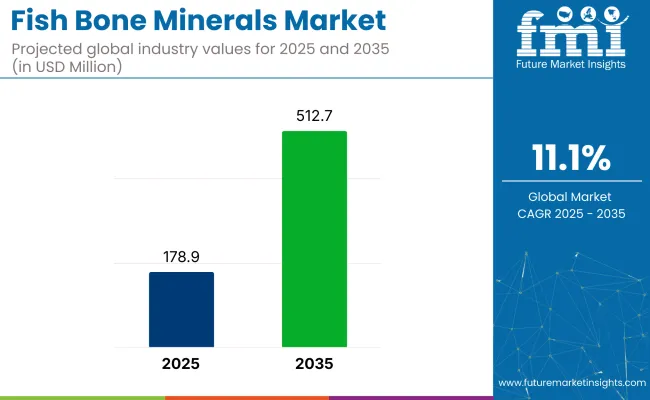
World fish bone minerals markets were worth USD 146.1 million in 2023. Fish bone minerals consumption increased annually by a value of 11.1% in 2024, and thus the world market would be worth USD 178.9 million in 2025. World sales during the forecast period (2025 to 2035) will expand with an 11.1% CAGR in the terminal value of USD 512.7 million in the last year of 2035.
Good quality fish bone minerals such as calcium, phosphorus, and trace minerals are employed in animal feed, fertilizers, and food additives. Such renewable and natural minerals are extremely popular for the application, and this is the driving force for the market. Fish bone minerals are employed as they are bioavailable and may increase the nutritional value of the majority of the animal food and agriculture products.
Increasing organic farming and increasing focus on natural input use in crops and livestock agriculture are least likely to be deterred as stimuli to demand for fish bone minerals, particularly as a method of de-emphasizing reliance on chemical additives.
Fish bone minerals are gaining popularity because they are effective and environmentally friendly as a natural substitute for man-made mineral supplements. Fish bone minerals contain calcium along with trace minerals essential to animal and global health.
Fish bone minerals for fertilizer use are increasing, as they can improve the soil structure and provide extra nutrients to crops. With the world shifting towards organic and sustainable farming, fish bone minerals used as soil conditioners are poised to experience phenomenal growth. Demand for natural mineral-based food supplements is also fueling demand for fish bone minerals in the nutraceuticals segment.
The following table includes comparative half-yearly change in the CAGR of base year (2024) and current year (2025) in the global fish bone minerals market. Analysis gives significant changes in performance and presents revenue realization patterns, thereby giving a clearer picture to stakeholders regarding the growth trend for the year, which has been divided into two halves, i.e., January to June (H1) and July to December (H2).
Particular | Value CAGR |
---|---|
H1 (2024 to 2034) | 10.7% |
H2 (2024 to 2034) | 10.8% |
H1 (2025 to 2035) | 10.9% |
H2 (2025 to 2035) | 11.1% |
The industry expands at 10.9% growth in the first half (H1) of the decade 2025 to 2035 and slightly higher 11.1% growth rate in the second half (H2) of the decade. The second decade experiences moderate growth with additional applications of natural mineral resources as feed for crop and animal use. During the first half (H1) of the period, the market has shown a growth of 20 BPS, but the company will probably show an even better growth of 20 BPS in the second half (H2).
This trend towards health and sustainability positions the fish bone minerals industry to achieve sustainable long-term growth in the forecast period. The fish bone minerals industry, or fish bone calcium, will record robust growth with the momentum of health drivers, green production process, and use in agriculture. Environmental concerns and competition in the market will be key for operators to address to capitalize on this new industry.
World fish bone minerals industry is quite concentrated with a mix of regional firms, multinational companies, and increasing number of Chinese companies. Demand is driven by increasing demand for natural calcium and phosphorus sources for diet supplement, animal feed, and fertilizer application. Regional companies manage processing and distribution of fish bone minerals for sustainability and local market penetration.
Local players dominate the Asia-Pacific, European, and North American markets. Home players are leaders in the production of high-purity fish bone minerals as diet additives and animal nutrition products in North America. Home players are leaders in offering sustainable and safe seafood processing plant ingredients and follow the latest extraction technology to provide maximum mineral content.
Increasing demand for natural phosphorus and calcium nutritional supplements created home players' doors for functional and food-for-diet uses. Home country players in home countries Norway, Denmark, and the Netherlands dominate the market significantly.
The countries of the Asia-Pacific region, such as India, Thailand, and Vietnam, are gradually emerging as the center for regional companies manufacturing fish bone minerals. The countries have set up seafood processing facilities where regional companies can convert fish waste into value-added minerals for agribusiness, animal nutrition, and human health supplement markets.
Indian demand has been driven by the country's need for Ayurveda and natural health supplements, which has generated demand for fish bone calcium, while Thailand and Vietnam sell fish bone minerals to other nations.
Chinese companies are monstroscale monsters of a fish processing and low-scale production monster in the world's fish bone minerals. China is the top producer and exporter of fish minerals used to serve animal feed, fertilizer, and food supplement industries. Chinese companies are focusing on mass production and price competition as a move to further solidify their positions in the world's supply chains.
Growing Demand for Sustainable and Upcycled Calcium Sources
Shift: In line with rising concerns over sustainability and food waste, customers and producers are shifting towards sustainable sources of essential minerals. Fish bone minerals, also rich in calcium, phosphorus, and collagen, are also sought as a low-wastage upcycled seafood process by-product offering high bioavailability over traditional sources of calcium.
Strategic Response: Brands are marketing fish bone minerals as a greener alternative to standard calcium supplements. Norwegian bio-tech firm Hofseth BioCare is upcycling fish bones from salmon processing, increasing its sales of functional ingredients by 38%.
Marinova has launched marine-sourced mineral supplements in Canada, distributing these through nutraceutical and functional food companies. Japanese firm Nissui Corporation is employing fish bone calcium in fortified milk drinks, which appeal to health-conscious and eco-friendly consumers.
Fortification of Fish Bone Minerals in Functional Foods & Beverages
Shift: As bone health and joint welfare are on the minds of the growing older generation, fish bone minerals are entering fortified foods and beverages. Natural and bioavailable calcium sources, not artificial ones, are what consumers desire, and fish bone minerals are a success in dairy foods, plant-based beverages, and protein powders.
Strategic Response: Food and beverage firms now market fish bone minerals into everyday nutrition. Meiji, a Japanese dairy firm, has introduced calcium-fortified milk made based on fish bone minerals with deeper penetration in the elderly nutrition market.
In America, Vital Proteins launched fish bone calcium-fortified marine collagen powders with a sales growth of 26% with customers aged more than 40 years. NutraLife in Australia launched a fish bone mineral blend for plant-based yogurts with its customer base growing among people suffering from lactose intolerance.
Growing Consumer Trend Towards Natural & Clean-Label Supplements
Shift: Artificial supplements are distrusted even more by consumers, who choose naturally occurring, whole-food-source-originated minerals launched in clean-label form. Synthesizer additive-free, fish bone minerals are riding the bandwagon of minimally processed health product trends.
Strategic Response: Nutraceutical makers are re-formulating to highlight natural character. Sea to Me, a New Zealand company, launched a 100% natural fish bone calcium supplement that resonated with clean-label consumers and gained retail distribution in over 500 stores.
Marine BioHealth, in the EU, launched fish bone mineral capsules without the aid of artificial binders, with online sales increasing 19%. Ancient Nutrition, based in the US, is marketing fish-derived bone minerals as a paleo-friendly alternative, targeting whole-food supplement consumers.
Increasing Use in Pet Foods for Bone & Joint Well-being
Shift: Pet owners are appreciating the necessity of bone and joint health in older pets, and therefore natural calcium ingredients are in greater demand in pet foods. Fish bone minerals consist of essential minerals to support dog and cat bones' strength, flexibility, and health.
Strategic Response: Pet food manufacturers are incorporating fish bone minerals into pet food to provide another nutrition boost. US-based Blue Buffalo introduced fish bone calcium-enriched dog food for older dogs, with a 24% growth in sales from the senior pet segment.
UK's Lily's Kitchen introduced pet treats supplemented with fish bone minerals for pet owners seeking functional pet treats. South Korean company Harim Pet Food introduced a collaborative supplement derived from fish bones, leveraging market demand from high-end pet care consumers.
Sport Nutrition & Sport Performance Supplements Role of Fish Bone Minerals
Shift: Female athletes and athletes are increasingly depending on nature's own sources of calcium and phosphorus for bone processes, muscle performance, and repair. Fish bone minerals' ability to deliver excellent bioavailability along with trace mineral concentration is setting them in a comfortable position as against synthetic calcium carbonate in sport nutrition.
Strategic Response: Sport nutrition brands are reformulating with fish bone minerals. Swedish brand Arctic Sport introduced a calcium blend from fish bones for endurance sports, driving direct-to-consumer sales by 31%.
USA brand Optimum Nutrition added marine-sourced minerals to its post-workout recovery shake, riding the clean-performance diet trend. Brazilian brand ProBiome introduced a fish bone mineral-enriched protein supplement, targeting vegan and pescatarian athletes seeking sustainable sources of minerals.
Heightening Demand for Fish Bone Minerals as a Part of Child & Infant Nutrition
Shift: Parents look for progressively natural and bioavailable calcium sources that can provide bones with structure formation as well as overall child development. Fish bone minerals replace earlier calcium sources such as synthetic calcium carbonate to meet the need, offering increased absorptiveness together with trace elements such as phosphorus and magnesium.
Strategic Response: Companies manufacturing infant food, cereal, and milk fortification are incorporating fish bone minerals into infant nutrition products. Danone in Europe introduced a toddler formula with fish bone minerals and sales rose 15% as parents sought natural nutrition.
Feihe in China introduced an organic infant cereal with fish-based calcium, driving demand from premium infant nutrition consumers. Nestlé NAN Supreme in Australia incorporated fish bone minerals in infant up-growth milk, propelling its lead in clean-label infant nutrition.
Rise of Fish Bone Minerals in Personalized Nutrition & Biohacking
Shift: The growing biohacking and personalized nutrition trend is driving interest in individual, bioavailable minerals that can be tailored to suit personal health needs. Fish bone minerals, which have a high calcium-phosphorus ratio and are more bioavailable than others, are being incorporated into personalized supplements to support bones, mental function, and metabolism.
Strategic Response: Supplement businesses and brands are combining fish bone minerals with artificial intelligence-based nutritional strategies and DNA-based supplementation. USA Rootine introduced its customized calcium blend infused with fish bone minerals and achieved a 28% subscription increase from its biohacker database.
South Korea's Nutrafolix introduced a customized fish bone mineral supplement for preventing osteoporosis with open orders from aging consumers. Persona Nutrition Swiss introduced marine-derived minerals into its customized daily vitamin packs in order to capture data-driven health-oriented consumers.
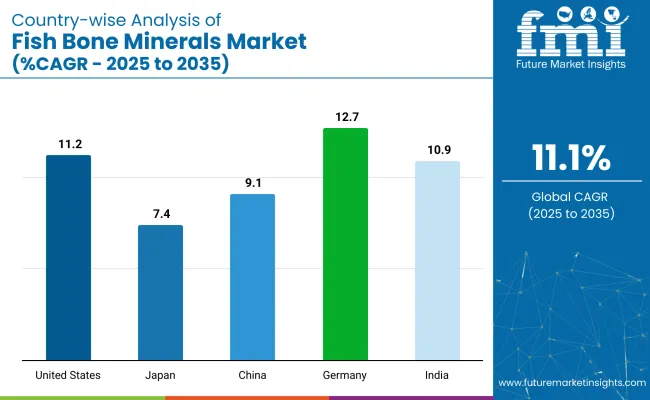
The following table shows the estimated growth rates of the top five territories expected to exhibit high consumption of fish bone minerals through 2035.
Countries | CAGR 2025 to 2035 |
---|---|
USA | 11.2% |
Germany | 12.7% |
China | 9.1% |
Japan | 7.4% |
India | 10.9% |
Market research of USA fish bone minerals market: The USA fish bone minerals market is expanding, in synchronization with ingredients of minerals through the consumption of Ca-rich, sustainability food nutrients. As consumers seek to embrace healthier lifestyles, interest is building up in functional ingredients that enhances improved bone health, joint function, and enhanced repurposed well-being. Fish bone-derived phosphorus and calcium are widely used in functional food, food additives and pet diets, as a natural and high bioavailability source of foremost residues.
The eco-friendly method of procuring ingredients is also favorably influencing the consumption of marine mineral extracts as it presents a natural, environmentally friendly alternative to traditional mineral supplements. Fish Bone-Derived Minerals Producers in the USA Investing in Advanced Processing Technologies for Purity and Bioavailability As clean-label and sustainable products receive increasing regulatory backing, the USA market is projected to keep on expanding in the coming several years.
European Union regulations emphasizing sourcing clean-label, traceable and sustainable ingredients are driving demand in the German market for fish bone minerals. Consumers in Germany are increasingly demonstrating demand for bioavailable calcium and phosphorus from fish bones for fortified dairy product, functional beverage, and nutraceutical applications. This willingness to accept natural, marine-derived minerals over synthetics mirrors the overall European trend towards sustainability and healthy consumer choices.
Nevertheless, with increased sensitivity to bone health and environmentally sustainable sourcing of mineral products, German producers have raised investments in sea mineral extraction technology and organic certification procedures.
Industrial demand for fish bone minerals is also on the rise in targeted nutrition applications such as sports nutrition, geriatric care products, and even plant-based nutrition, where different types of calcium are needed. In addition, Germany's strong regulatory framework supports excellent product quality and safety, which further drives consumer confidence in marine-based nutritional solutions.
The Chinese fish bone minerals market is booming due to the increasing demand for functional food ingredients, traditional medicine, and calcium-rich feed additives supplements. Due to the growth in popularity of health and wellness trends across China, fish bone-derived minerals are becoming leading ingredients in a wide range of fortified foods, from dairy substitutes to protein powders and infant formulas.
As a countermeasure, the Chinese government has become progressively more active in fostering marine biotechnology innovations and encouraged domestic enterprises to cultivate fish bone mineral extraction and processing capacities. This has led to innovative high-purity, bioavailable calcium and phosphorus products that can satisfy the increasing demands of the nation for functional and natural nutrition.
Further, China's expanding aging population and increasing health-concerned consumers have begun demanding bone-strengthening, calcium-enriched dieting products as well. With ever more Chinese consumers shifting their attentions to preventative healthcare, nutritional supplement makers already have begun emphasizing their supplements as scientifically proven, natural daily therapies for preserving bone density and skeletal health overall.
This is compelling domestic and foreign competitors to invest in research and development to develop their mineral supplements from marine sources that are compliant with the tastes and dietary practices of the Chinese market
Segment | Value Share (2025) |
---|---|
Calcium & Phosphorus Supplements (By Application) | 61.3% |
Calcium and phosphorus supplement type dominates the fish bone minerals market with a whopping 61.3% market share in 2025. These minerals are vital for bone health, osteoporosis prevention, and functional nutrition, and hence are highly sought-after across nutraceuticals, fortified dairy foods, and mineral-enriched beverages.
As a result, there is an increasing number of cases of bone diseases and growing consumer awareness of preventive healthcare, which has contributed to the proliferation of the demand for high-quality and bioavailable sources of calcium and phosphorus.
We have seen a rise in naturally derived and high-absorption mineral supplements, and the manufacturers are paying increased attention to marine-derived and enzymatically processed products. Advanced processing techniques are employed to enhance fishbone-derived minerals absorption and bioavailability, to make them more effective.
Additionally, the growing trends of vegan and plant-based dietary lifestyles have led to the production of fortified, algae-based, and fish bone-based calcium blends, which are aimed at health-conscious consumers. The trajectory of supplement products is also being further cemented with the rapid uptake of functional foods as well as meal substitutes containing marine minerals, contributing significantly to the overarching dominance of this segment in the dynamic global nutrition space.
Segment | Value Share (2025) |
---|---|
Functional Food & Pet Nutrition (By Application) | 38.7% |
As functional food ingredients and advanced pet nutrition continue to be in demand, the functional food and pet nutrition industry is projected to assume a 38.7% market share by 2025. Fish bones can be widely used in pet food fortification, organic fertilizers, and functional snack foods, which are able to supply a rich and sustainable way than the ordinary synthetic supplements.
The rising awareness regarding pet health has also bolstered the demand for bioavailable phosphorus and calcium in therapeutic pet nutrition formulations, particularly for bone integrity and joint welfare. With rising awareness and concern about the sustainability of future food systems, more businesses are focusing on using marine waste-derived supplements that offer the purest blood-calcium and phosphorus for food-grade applications.
This trend is in line with the concept of the circular economy, which aims to minimize waste while maximizing nutritional substance for multiple uses of foods and supplements.
Fish bone mineral complexes that are bioavailable, are gaining more popularity in the fields of sports nutrition and cognitive health supplements, baby food with fortifications. Thanks to processing technology advances, these sea-sourced minerals have become staple ingredients in functional beverages, protein powder, and cognitive-boosting blends for an eager cadre of health-hungry customers.
In the fish bone minerals market, manufacturers compete with one another based on advancements in mineral extraction technology, sustainable sourcing, and their ability to meet the increasing application of fish bone minerals for human and animal nutrition. Marine calcium bioavailability research, enzymatic processing and traceable ingredient certification are some of the areas in which companies are pouring investment.
The industry is expected to be dominated by a few leading manufacturers, including Marigot Ltd., Bio-Marine Ingredients Ireland, Caltron Clays, Waitaki Biosciences, and Marine Bio, among others—bringing expertise in functional marine minerals, formulations for bone strengthening, and green production methods. A growing number of companies are expanding their distribution networks in North America and Europe to meet increasing demand for marine-derived calcium alternatives.
Key strategies include partnerships with nutraceutical brands, bridging the gap to enable precision extraction, and the development of bioavailable fish bone mineral blends. Manufacturers are also prioritizing zero-waste marine ingredient utilization and regenerative processing solutions.
For instance
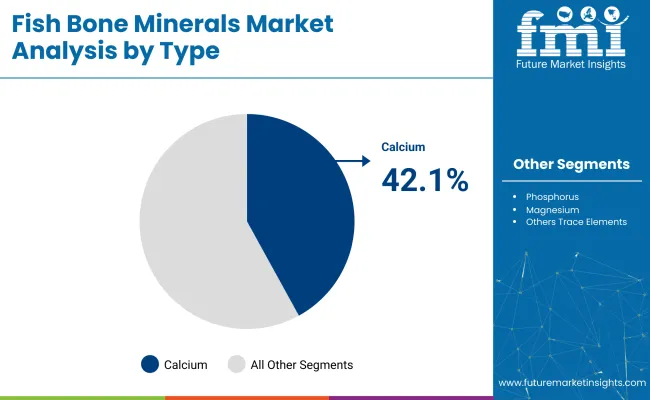
The market includes various mineral types, such as Calcium, Phosphorus, Magnesium, and other essential nutrients, catering to different health and dietary needs.
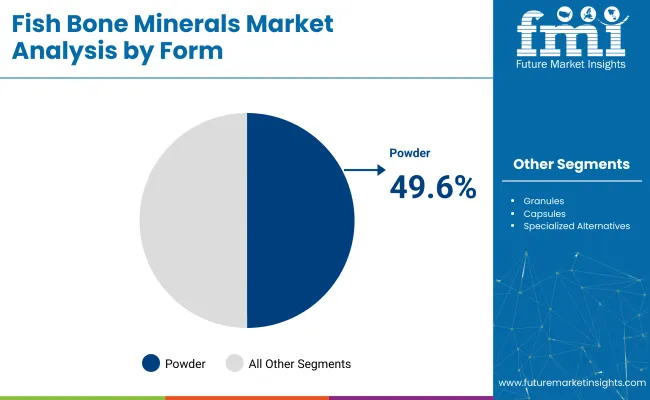
These minerals are available in multiple forms, including Powder, Granules, and Capsules, along with other specialized formats for diverse applications.
They are widely used across industries such as Food & Beverages, Pharmaceuticals, Nutraceuticals, and Animal Feed, with additional applications in other sectors.
These minerals are derived from various sources, including Salmon, Trout, Tuna, Cod, and other marine species, ensuring a sustainable supply.
The market is segmented as North America, Latin America, Western Europe, Eastern Europe, East Asia, South Asia & Pacific, Central Asia, Russia and Belarus, Balkan & Baltic Countries, Middle East and Africa.
Table 1: Global Market Value (US$ million) Forecast by Region, 2018 to 2033
Table 2: Global Market Volume (MT) Forecast by Region, 2018 to 2033
Table 3: Global Market Value (US$ million) Forecast by Type, 2018 to 2033
Table 4: Global Market Volume (MT) Forecast by Type, 2018 to 2033
Table 5: Global Market Value (US$ million) Forecast by Source, 2018 to 2033
Table 6: Global Market Volume (MT) Forecast by Source, 2018 to 2033
Table 7: Global Market Value (US$ million) Forecast by Form, 2018 to 2033
Table 8: Global Market Volume (MT) Forecast by Form, 2018 to 2033
Table 9: Global Market Value (US$ million) Forecast by Application, 2018 to 2033
Table 10: Global Market Volume (MT) Forecast by Application, 2018 to 2033
Table 11: North America Market Value (US$ million) Forecast by Country, 2018 to 2033
Table 12: North America Market Volume (MT) Forecast by Country, 2018 to 2033
Table 13: North America Market Value (US$ million) Forecast by Type, 2018 to 2033
Table 14: North America Market Volume (MT) Forecast by Type, 2018 to 2033
Table 15: North America Market Value (US$ million) Forecast by Source, 2018 to 2033
Table 16: North America Market Volume (MT) Forecast by Source, 2018 to 2033
Table 17: North America Market Value (US$ million) Forecast by Form, 2018 to 2033
Table 18: North America Market Volume (MT) Forecast by Form, 2018 to 2033
Table 19: North America Market Value (US$ million) Forecast by Application, 2018 to 2033
Table 20: North America Market Volume (MT) Forecast by Application, 2018 to 2033
Table 21: Latin America Market Value (US$ million) Forecast by Country, 2018 to 2033
Table 22: Latin America Market Volume (MT) Forecast by Country, 2018 to 2033
Table 23: Latin America Market Value (US$ million) Forecast by Type, 2018 to 2033
Table 24: Latin America Market Volume (MT) Forecast by Type, 2018 to 2033
Table 25: Latin America Market Value (US$ million) Forecast by Source, 2018 to 2033
Table 26: Latin America Market Volume (MT) Forecast by Source, 2018 to 2033
Table 27: Latin America Market Value (US$ million) Forecast by Form, 2018 to 2033
Table 28: Latin America Market Volume (MT) Forecast by Form, 2018 to 2033
Table 29: Latin America Market Value (US$ million) Forecast by Application, 2018 to 2033
Table 30: Latin America Market Volume (MT) Forecast by Application, 2018 to 2033
Table 31: Europe Market Value (US$ million) Forecast by Country, 2018 to 2033
Table 32: Europe Market Volume (MT) Forecast by Country, 2018 to 2033
Table 33: Europe Market Value (US$ million) Forecast by Type, 2018 to 2033
Table 34: Europe Market Volume (MT) Forecast by Type, 2018 to 2033
Table 35: Europe Market Value (US$ million) Forecast by Source, 2018 to 2033
Table 36: Europe Market Volume (MT) Forecast by Source, 2018 to 2033
Table 37: Europe Market Value (US$ million) Forecast by Form, 2018 to 2033
Table 38: Europe Market Volume (MT) Forecast by Form, 2018 to 2033
Table 39: Europe Market Value (US$ million) Forecast by Application, 2018 to 2033
Table 40: Europe Market Volume (MT) Forecast by Application, 2018 to 2033
Table 41: East Asia Market Value (US$ million) Forecast by Country, 2018 to 2033
Table 42: East Asia Market Volume (MT) Forecast by Country, 2018 to 2033
Table 43: East Asia Market Value (US$ million) Forecast by Type, 2018 to 2033
Table 44: East Asia Market Volume (MT) Forecast by Type, 2018 to 2033
Table 45: East Asia Market Value (US$ million) Forecast by Source, 2018 to 2033
Table 46: East Asia Market Volume (MT) Forecast by Source, 2018 to 2033
Table 47: East Asia Market Value (US$ million) Forecast by Form, 2018 to 2033
Table 48: East Asia Market Volume (MT) Forecast by Form, 2018 to 2033
Table 49: East Asia Market Value (US$ million) Forecast by Application, 2018 to 2033
Table 50: East Asia Market Volume (MT) Forecast by Application, 2018 to 2033
Table 51: East Asia Market Value (US$ million) Forecast by Country, 2018 to 2033
Table 52: East Asia Market Volume (MT) Forecast by Country, 2018 to 2033
Table 53: East Asia Market Value (US$ million) Forecast by Type, 2018 to 2033
Table 54: East Asia Market Volume (MT) Forecast by Type, 2018 to 2033
Table 55: East Asia Market Value (US$ million) Forecast by Source, 2018 to 2033
Table 56: East Asia Market Volume (MT) Forecast by Source, 2018 to 2033
Table 57: East Asia Market Value (US$ million) Forecast by Form, 2018 to 2033
Table 58: East Asia Market Volume (MT) Forecast by Form, 2018 to 2033
Table 59: East Asia Market Value (US$ million) Forecast by Application, 2018 to 2033
Table 60: East Asia Market Volume (MT) Forecast by Application, 2018 to 2033
Table 61: Oceania Market Value (US$ million) Forecast by Country, 2018 to 2033
Table 62: Oceania Market Volume (MT) Forecast by Country, 2018 to 2033
Table 63: Oceania Market Value (US$ million) Forecast by Type, 2018 to 2033
Table 64: Oceania Market Volume (MT) Forecast by Type, 2018 to 2033
Table 65: Oceania Market Value (US$ million) Forecast by Source, 2018 to 2033
Table 66: Oceania Market Volume (MT) Forecast by Source, 2018 to 2033
Table 67: Oceania Market Value (US$ million) Forecast by Form, 2018 to 2033
Table 68: Oceania Market Volume (MT) Forecast by Form, 2018 to 2033
Table 69: Oceania Market Value (US$ million) Forecast by Application, 2018 to 2033
Table 70: Oceania Market Volume (MT) Forecast by Application, 2018 to 2033
Table 71: MEA Market Value (US$ million) Forecast by Country, 2018 to 2033
Table 72: MEA Market Volume (MT) Forecast by Country, 2018 to 2033
Table 73: MEA Market Value (US$ million) Forecast by Type, 2018 to 2033
Table 74: MEA Market Volume (MT) Forecast by Type, 2018 to 2033
Table 75: MEA Market Value (US$ million) Forecast by Source, 2018 to 2033
Table 76: MEA Market Volume (MT) Forecast by Source, 2018 to 2033
Table 77: MEA Market Value (US$ million) Forecast by Form, 2018 to 2033
Table 78: MEA Market Volume (MT) Forecast by Form, 2018 to 2033
Table 79: MEA Market Value (US$ million) Forecast by Application, 2018 to 2033
Table 80: MEA Market Volume (MT) Forecast by Application, 2018 to 2033
Figure 1: Global Market Value (US$ million) by Type, 2023 to 2033
Figure 2: Global Market Value (US$ million) by Source, 2023 to 2033
Figure 3: Global Market Value (US$ million) by Form, 2023 to 2033
Figure 4: Global Market Value (US$ million) by Application, 2023 to 2033
Figure 5: Global Market Value (US$ million) by Region, 2023 to 2033
Figure 6: Global Market Value (US$ million) Analysis by Region, 2018 to 2033
Figure 7: Global Market Volume (MT) Analysis by Region, 2018 to 2033
Figure 8: Global Market Value Share (%) and BPS Analysis by Region, 2023 to 2033
Figure 9: Global Market Y-o-Y Growth (%) Projections by Region, 2023 to 2033
Figure 10: Global Market Value (US$ million) Analysis by Type, 2018 to 2033
Figure 11: Global Market Volume (MT) Analysis by Type, 2018 to 2033
Figure 12: Global Market Value Share (%) and BPS Analysis by Type, 2023 to 2033
Figure 13: Global Market Y-o-Y Growth (%) Projections by Type, 2023 to 2033
Figure 14: Global Market Value (US$ million) Analysis by Source, 2018 to 2033
Figure 15: Global Market Volume (MT) Analysis by Source, 2018 to 2033
Figure 16: Global Market Value Share (%) and BPS Analysis by Source, 2023 to 2033
Figure 18: Global Market Y-o-Y Growth (%) Projections by Source, 2023 to 2033
Figure 18: Global Market Value (US$ million) Analysis by Form, 2018 to 2033
Figure 19: Global Market Volume (MT) Analysis by Form, 2018 to 2033
Figure 20: Global Market Value Share (%) and BPS Analysis by Form, 2023 to 2033
Figure 22: Global Market Y-o-Y Growth (%) Projections by Form, 2023 to 2033
Figure 23: Global Market Value (US$ million) Analysis by Application, 2018 to 2033
Figure 23: Global Market Volume (MT) Analysis by Application, 2018 to 2033
Figure 24: Global Market Value Share (%) and BPS Analysis by Application, 2023 to 2033
Figure 25: Global Market Y-o-Y Growth (%) Projections by Application, 2023 to 2033
Figure 26: Global Market Attractiveness by Type, 2023 to 2033
Figure 27: Global Market Attractiveness by Source, 2023 to 2033
Figure 28: Global Market Attractiveness by Form, 2023 to 2033
Figure 29: Global Market Attractiveness by Application, 2023 to 2033
Figure 30: Global Market Attractiveness by Region, 2023 to 2033
Figure 31: North America Market Value (US$ million) by Type, 2023 to 2033
Figure 33: North America Market Value (US$ million) by Source, 2023 to 2033
Figure 33: North America Market Value (US$ million) by Form, 2023 to 2033
Figure 34: North America Market Value (US$ million) by Application, 2023 to 2033
Figure 35: North America Market Value (US$ million) by Country, 2023 to 2033
Figure 36: North America Market Value (US$ million) Analysis by Country, 2018 to 2033
Figure 37: North America Market Volume (MT) Analysis by Country, 2018 to 2033
Figure 38: North America Market Value Share (%) and BPS Analysis by Country, 2023 to 2033
Figure 39: North America Market Y-o-Y Growth (%) Projections by Country, 2023 to 2033
Figure 40: North America Market Value (US$ million) Analysis by Type, 2018 to 2033
Figure 41: North America Market Volume (MT) Analysis by Type, 2018 to 2033
Figure 42: North America Market Value Share (%) and BPS Analysis by Type, 2023 to 2033
Figure 43: North America Market Y-o-Y Growth (%) Projections by Type, 2023 to 2033
Figure 44: North America Market Value (US$ million) Analysis by Source, 2018 to 2033
Figure 45: North America Market Volume (MT) Analysis by Source, 2018 to 2033
Figure 46: North America Market Value Share (%) and BPS Analysis by Source, 2023 to 2033
Figure 47: North America Market Y-o-Y Growth (%) Projections by Source, 2023 to 2033
Figure 48: North America Market Value (US$ million) Analysis by Form, 2018 to 2033
Figure 49: North America Market Volume (MT) Analysis by Form, 2018 to 2033
Figure 50: North America Market Value Share (%) and BPS Analysis by Form, 2023 to 2033
Figure 51: North America Market Y-o-Y Growth (%) Projections by Form, 2023 to 2033
Figure 52: North America Market Value (US$ million) Analysis by Application, 2018 to 2033
Figure 53: North America Market Volume (MT) Analysis by Application, 2018 to 2033
Figure 54: North America Market Value Share (%) and BPS Analysis by Application, 2023 to 2033
Figure 55: North America Market Y-o-Y Growth (%) Projections by Application, 2023 to 2033
Figure 56: North America Market Attractiveness by Type, 2023 to 2033
Figure 57: North America Market Attractiveness by Source, 2023 to 2033
Figure 58: North America Market Attractiveness by Form, 2023 to 2033
Figure 59: North America Market Attractiveness by Application, 2023 to 2033
Figure 60: North America Market Attractiveness by Country, 2023 to 2033
Figure 61: Latin America Market Value (US$ million) by Type, 2023 to 2033
Figure 62: Latin America Market Value (US$ million) by Source, 2023 to 2033
Figure 63: Latin America Market Value (US$ million) by Form, 2023 to 2033
Figure 64: Latin America Market Value (US$ million) by Application, 2023 to 2033
Figure 65: Latin America Market Value (US$ million) by Country, 2023 to 2033
Figure 66: Latin America Market Value (US$ million) Analysis by Country, 2018 to 2033
Figure 67: Latin America Market Volume (MT) Analysis by Country, 2018 to 2033
Figure 68: Latin America Market Value Share (%) and BPS Analysis by Country, 2023 to 2033
Figure 69: Latin America Market Y-o-Y Growth (%) Projections by Country, 2023 to 2033
Figure 70: Latin America Market Value (US$ million) Analysis by Type, 2018 to 2033
Figure 71: Latin America Market Volume (MT) Analysis by Type, 2018 to 2033
Figure 72: Latin America Market Value Share (%) and BPS Analysis by Type, 2023 to 2033
Figure 73: Latin America Market Y-o-Y Growth (%) Projections by Type, 2023 to 2033
Figure 74: Latin America Market Value (US$ million) Analysis by Source, 2018 to 2033
Figure 75: Latin America Market Volume (MT) Analysis by Source, 2018 to 2033
Figure 76: Latin America Market Value Share (%) and BPS Analysis by Source, 2023 to 2033
Figure 77: Latin America Market Y-o-Y Growth (%) Projections by Source, 2023 to 2033
Figure 78: Latin America Market Value (US$ million) Analysis by Form, 2018 to 2033
Figure 79: Latin America Market Volume (MT) Analysis by Form, 2018 to 2033
Figure 80: Latin America Market Value Share (%) and BPS Analysis by Form, 2023 to 2033
Figure 81: Latin America Market Y-o-Y Growth (%) Projections by Form, 2023 to 2033
Figure 82: Latin America Market Value (US$ million) Analysis by Application, 2018 to 2033
Figure 83: Latin America Market Volume (MT) Analysis by Application, 2018 to 2033
Figure 84: Latin America Market Value Share (%) and BPS Analysis by Application, 2023 to 2033
Figure 85: Latin America Market Y-o-Y Growth (%) Projections by Application, 2023 to 2033
Figure 86: Latin America Market Attractiveness by Type, 2023 to 2033
Figure 87: Latin America Market Attractiveness by Source, 2023 to 2033
Figure 88: Latin America Market Attractiveness by Form, 2023 to 2033
Figure 89: Latin America Market Attractiveness by Application, 2023 to 2033
Figure 90: Latin America Market Attractiveness by Country, 2023 to 2033
Figure 91: Europe Market Value (US$ million) by Type, 2023 to 2033
Figure 92: Europe Market Value (US$ million) by Source, 2023 to 2033
Figure 93: Europe Market Value (US$ million) by Form, 2023 to 2033
Figure 94: Europe Market Value (US$ million) by Application, 2023 to 2033
Figure 95: Europe Market Value (US$ million) by Country, 2023 to 2033
Figure 96: Europe Market Value (US$ million) Analysis by Country, 2018 to 2033
Figure 97: Europe Market Volume (MT) Analysis by Country, 2018 to 2033
Figure 98: Europe Market Value Share (%) and BPS Analysis by Country, 2023 to 2033
Figure 99: Europe Market Y-o-Y Growth (%) Projections by Country, 2023 to 2033
Figure 100: Europe Market Value (US$ million) Analysis by Type, 2018 to 2033
Figure 101: Europe Market Volume (MT) Analysis by Type, 2018 to 2033
Figure 102: Europe Market Value Share (%) and BPS Analysis by Type, 2023 to 2033
Figure 103: Europe Market Y-o-Y Growth (%) Projections by Type, 2023 to 2033
Figure 104: Europe Market Value (US$ million) Analysis by Source, 2018 to 2033
Figure 105: Europe Market Volume (MT) Analysis by Source, 2018 to 2033
Figure 106: Europe Market Value Share (%) and BPS Analysis by Source, 2023 to 2033
Figure 107: Europe Market Y-o-Y Growth (%) Projections by Source, 2023 to 2033
Figure 108: Europe Market Value (US$ million) Analysis by Form, 2018 to 2033
Figure 109: Europe Market Volume (MT) Analysis by Form, 2018 to 2033
Figure 110: Europe Market Value Share (%) and BPS Analysis by Form, 2023 to 2033
Figure 111: Europe Market Y-o-Y Growth (%) Projections by Form, 2023 to 2033
Figure 112: Europe Market Value (US$ million) Analysis by Application, 2018 to 2033
Figure 113: Europe Market Volume (MT) Analysis by Application, 2018 to 2033
Figure 114: Europe Market Value Share (%) and BPS Analysis by Application, 2023 to 2033
Figure 115: Europe Market Y-o-Y Growth (%) Projections by Application, 2023 to 2033
Figure 116: Europe Market Attractiveness by Type, 2023 to 2033
Figure 118: Europe Market Attractiveness by Source, 2023 to 2033
Figure 118: Europe Market Attractiveness by Form, 2023 to 2033
Figure 119: Europe Market Attractiveness by Application, 2023 to 2033
Figure 120: Europe Market Attractiveness by Country, 2023 to 2033
Figure 122: East Asia Market Value (US$ million) by Type, 2023 to 2033
Figure 123: East Asia Market Value (US$ million) by Source, 2023 to 2033
Figure 123: East Asia Market Value (US$ million) by Form, 2023 to 2033
Figure 124: East Asia Market Value (US$ million) by Application, 2023 to 2033
Figure 125: East Asia Market Value (US$ million) by Country, 2023 to 2033
Figure 126: East Asia Market Value (US$ million) Analysis by Country, 2018 to 2033
Figure 127: East Asia Market Volume (MT) Analysis by Country, 2018 to 2033
Figure 128: East Asia Market Value Share (%) and BPS Analysis by Country, 2023 to 2033
Figure 129: East Asia Market Y-o-Y Growth (%) Projections by Country, 2023 to 2033
Figure 130: East Asia Market Value (US$ million) Analysis by Type, 2018 to 2033
Figure 131: East Asia Market Volume (MT) Analysis by Type, 2018 to 2033
Figure 133: East Asia Market Value Share (%) and BPS Analysis by Type, 2023 to 2033
Figure 133: East Asia Market Y-o-Y Growth (%) Projections by Type, 2023 to 2033
Figure 134: East Asia Market Value (US$ million) Analysis by Source, 2018 to 2033
Figure 135: East Asia Market Volume (MT) Analysis by Source, 2018 to 2033
Figure 136: East Asia Market Value Share (%) and BPS Analysis by Source, 2023 to 2033
Figure 137: East Asia Market Y-o-Y Growth (%) Projections by Source, 2023 to 2033
Figure 138: East Asia Market Value (US$ million) Analysis by Form, 2018 to 2033
Figure 139: East Asia Market Volume (MT) Analysis by Form, 2018 to 2033
Figure 140: East Asia Market Value Share (%) and BPS Analysis by Form, 2023 to 2033
Figure 141: East Asia Market Y-o-Y Growth (%) Projections by Form, 2023 to 2033
Figure 142: East Asia Market Value (US$ million) Analysis by Application, 2018 to 2033
Figure 143: East Asia Market Volume (MT) Analysis by Application, 2018 to 2033
Figure 144: East Asia Market Value Share (%) and BPS Analysis by Application, 2023 to 2033
Figure 145: East Asia Market Y-o-Y Growth (%) Projections by Application, 2023 to 2033
Figure 146: East Asia Market Attractiveness by Type, 2023 to 2033
Figure 147: East Asia Market Attractiveness by Source, 2023 to 2033
Figure 148: East Asia Market Attractiveness by Form, 2023 to 2033
Figure 149: East Asia Market Attractiveness by Application, 2023 to 2033
Figure 150: East Asia Market Attractiveness by Country, 2023 to 2033
Figure 151: South Asia Market Value (US$ million) by Type, 2023 to 2033
Figure 152: South Asia Market Value (US$ million) by Source, 2023 to 2033
Figure 153: South Asia Market Value (US$ million) by Form, 2023 to 2033
Figure 154: South Asia Market Value (US$ million) by Application, 2023 to 2033
Figure 155: South Asia Market Value (US$ million) by Country, 2023 to 2033
Figure 156: South Asia Market Value (US$ million) Analysis by Country, 2018 to 2033
Figure 157: South Asia Market Volume (MT) Analysis by Country, 2018 to 2033
Figure 158: South Asia Market Value Share (%) and BPS Analysis by Country, 2023 to 2033
Figure 159: South Asia Market Y-o-Y Growth (%) Projections by Country, 2023 to 2033
Figure 160: South Asia Market Value (US$ million) Analysis by Type, 2018 to 2033
Figure 161: South Asia Market Volume (MT) Analysis by Type, 2018 to 2033
Figure 162: South Asia Market Value Share (%) and BPS Analysis by Type, 2023 to 2033
Figure 163: South Asia Market Y-o-Y Growth (%) Projections by Type, 2023 to 2033
Figure 164: South Asia Market Value (US$ million) Analysis by Source, 2018 to 2033
Figure 165: South Asia Market Volume (MT) Analysis by Source, 2018 to 2033
Figure 166: South Asia Market Value Share (%) and BPS Analysis by Source, 2023 to 2033
Figure 167: South Asia Market Y-o-Y Growth (%) Projections by Source, 2023 to 2033
Figure 168: South Asia Market Value (US$ million) Analysis by Form, 2018 to 2033
Figure 169: South Asia Market Volume (MT) Analysis by Form, 2018 to 2033
Figure 180: South Asia Market Value Share (%) and BPS Analysis by Form, 2023 to 2033
Figure 181: South Asia Market Y-o-Y Growth (%) Projections by Form, 2023 to 2033
Figure 182: South Asia Market Value (US$ million) Analysis by Application, 2018 to 2033
Figure 183: South Asia Market Volume (MT) Analysis by Application, 2018 to 2033
Figure 184: South Asia Market Value Share (%) and BPS Analysis by Application, 2023 to 2033
Figure 185: South Asia Market Y-o-Y Growth (%) Projections by Application, 2023 to 2033
Figure 186: South Asia Market Attractiveness by Type, 2023 to 2033
Figure 187: South Asia Market Attractiveness by Source, 2023 to 2033
Figure 188: South Asia Market Attractiveness by Form, 2023 to 2033
Figure 189: South Asia Market Attractiveness by Application, 2023 to 2033
Figure 180: South Asia Market Attractiveness by Country, 2023 to 2033
Figure 181: Oceania Market Value (US$ million) by Type, 2023 to 2033
Figure 182: Oceania Market Value (US$ million) by Source, 2023 to 2033
Figure 183: Oceania Market Value (US$ million) by Form, 2023 to 2033
Figure 184: Oceania Market Value (US$ million) by Application, 2023 to 2033
Figure 185: Oceania Market Value (US$ million) by Country, 2023 to 2033
Figure 186: Oceania Market Value (US$ million) Analysis by Country, 2018 to 2033
Figure 187: Oceania Market Volume (MT) Analysis by Country, 2018 to 2033
Figure 188: Oceania Market Value Share (%) and BPS Analysis by Country, 2023 to 2033
Figure 189: Oceania Market Y-o-Y Growth (%) Projections by Country, 2023 to 2033
Figure 190: Oceania Market Value (US$ million) Analysis by Type, 2018 to 2033
Figure 191: Oceania Market Volume (MT) Analysis by Type, 2018 to 2033
Figure 192: Oceania Market Value Share (%) and BPS Analysis by Type, 2023 to 2033
Figure 193: Oceania Market Y-o-Y Growth (%) Projections by Type, 2023 to 2033
Figure 194: Oceania Market Value (US$ million) Analysis by Source, 2018 to 2033
Figure 195: Oceania Market Volume (MT) Analysis by Source, 2018 to 2033
Figure 196: Oceania Market Value Share (%) and BPS Analysis by Source, 2023 to 2033
Figure 197: Oceania Market Y-o-Y Growth (%) Projections by Source, 2023 to 2033
Figure 198: Oceania Market Value (US$ million) Analysis by Form, 2018 to 2033
Figure 199: Oceania Market Volume (MT) Analysis by Form, 2018 to 2033
Figure 200: Oceania Market Value Share (%) and BPS Analysis by Form, 2023 to 2033
Figure 201: Oceania Market Y-o-Y Growth (%) Projections by Form, 2023 to 2033
Figure 202: Oceania Market Value (US$ million) Analysis by Application, 2018 to 2033
Figure 203: Oceania Market Volume (MT) Analysis by Application, 2018 to 2033
Figure 204: Oceania Market Value Share (%) and BPS Analysis by Application, 2023 to 2033
Figure 205: Oceania Market Y-o-Y Growth (%) Projections by Application, 2023 to 2033
Figure 206: Oceania Market Attractiveness by Type, 2023 to 2033
Figure 207: Oceania Market Attractiveness by Source, 2023 to 2033
Figure 208: Oceania Market Attractiveness by Form, 2023 to 2033
Figure 209: Oceania Market Attractiveness by Application, 2023 to 2033
Figure 220: Oceania Market Attractiveness by Country, 2023 to 2033
Figure 221: MEA Market Value (US$ million) by Type, 2023 to 2033
Figure 222: MEA Market Value (US$ million) by Source, 2023 to 2033
Figure 223: MEA Market Value (US$ million) by Form, 2023 to 2033
Figure 224: MEA Market Value (US$ million) by Application, 2023 to 2033
Figure 225: MEA Market Value (US$ million) by Country, 2023 to 2033
Figure 226: MEA Market Value (US$ million) Analysis by Country, 2018 to 2033
Figure 227: MEA Market Volume (MT) Analysis by Country, 2018 to 2033
Figure 228: MEA Market Value Share (%) and BPS Analysis by Country, 2023 to 2033
Figure 229: MEA Market Y-o-Y Growth (%) Projections by Country, 2023 to 2033
Figure 230: MEA Market Value (US$ million) Analysis by Type, 2018 to 2033
Figure 231: MEA Market Volume (MT) Analysis by Type, 2018 to 2033
Figure 233: MEA Market Value Share (%) and BPS Analysis by Type, 2023 to 2033
Figure 233: MEA Market Y-o-Y Growth (%) Projections by Type, 2023 to 2033
Figure 234: MEA Market Value (US$ million) Analysis by Source, 2018 to 2033
Figure 235: MEA Market Volume (MT) Analysis by Source, 2018 to 2033
Figure 236: MEA Market Value Share (%) and BPS Analysis by Source, 2023 to 2033
Figure 237: MEA Market Y-o-Y Growth (%) Projections by Source, 2023 to 2033
Figure 238: MEA Market Value (US$ million) Analysis by Form, 2018 to 2033
Figure 239: MEA Market Volume (MT) Analysis by Form, 2018 to 2033
Figure 230: MEA Market Value Share (%) and BPS Analysis by Form, 2023 to 2033
Figure 231: MEA Market Y-o-Y Growth (%) Projections by Form, 2023 to 2033
Figure 233: MEA Market Value (US$ million) Analysis by Application, 2018 to 2033
Figure 233: MEA Market Volume (MT) Analysis by Application, 2018 to 2033
Figure 234: MEA Market Value Share (%) and BPS Analysis by Application, 2023 to 2033
Figure 235: MEA Market Y-o-Y Growth (%) Projections by Application, 2023 to 2033
Figure 236: MEA Market Attractiveness by Type, 2023 to 2033
Figure 237: MEA Market Attractiveness by Source, 2023 to 2033
Figure 238: MEA Market Attractiveness by Form, 2023 to 2033
Figure 239: MEA Market Attractiveness by Application, 2023 to 2033
Figure 240: MEA Market Attractiveness by Country, 2023 to 2033
The global fish bone minerals industry is projected to reach USD 178.9 million in 2025.
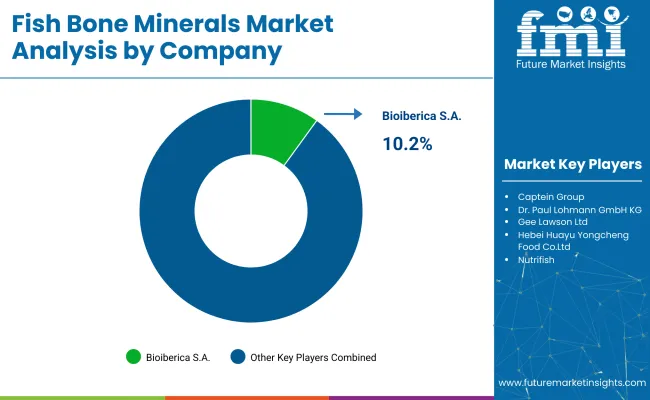
Key players include Alaska Protein Recovery LLC; Bioiberica, S.A.; Captein Group; Dr. Paul Lohmann GmbH KG; Gee Lawson Ltd.; Hebei Huayu Yongcheng Food Co., Ltd.; Nutrifish.
Asia-Pacific is expected to dominate due to high demand for marine-based calcium and functional food applications.
The industry is forecasted to grow at a CAGR of 11.1% from 2025 to 2035.
Key drivers include rising demand for sustainable and bioavailable calcium alternatives, increasing use in nutraceuticals and pet nutrition, and advancements in marine mineral extraction technologies.
Explore Similar Insights
Thank you!
You will receive an email from our Business Development Manager. Please be sure to check your SPAM/JUNK folder too.