Fish Deboning Machine Market Outlook (2023 to 2033)

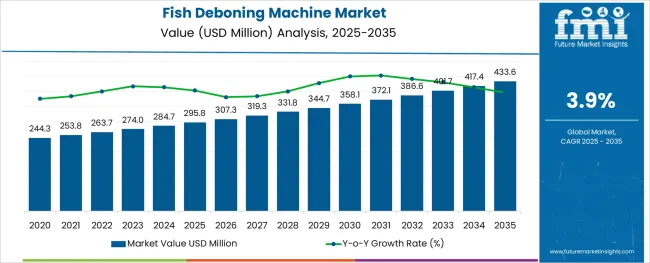
The global fish deboning machine demand is subjected to growth at a CAGR of 3.9%. The market revenue is likely to be valued at US$ 274 Million in 2023, and exhibit a revenue growth of US$ 415 Million by 2033. The growth in the market is attributed to the following:

  • The demand for fish deboning machines is high as they are suitable for marine fish, as well as freshwater fish.
  • This machine divides big fish into segments, whereas the meat can be directly collected from small fish.
  • This machine is efficient enough to increase the economic value of low-value fish. Moreover, it is convenient and durable.
  • It improves the utilization rate of raw materials and saves labor costs, by effectively separating fish bones, fish skins, and fish ribs.
  • The adoption of fish deboning machines is exponentially growing since they have a compact structure, high efficiency, and practicality.

Global Trends & Scope Revolutionizing the Fish Deboning Machine Market

The need for deboning different fish requires different processes…

Manufacturers of fish deboning machines promote the device to be used for the household, as well as restaurants, school canteens, staff canteens, and food processing plants. This machine can process any kind of fish, such as freshwater fish and saltwater fish. Moreover, this machine can squeeze the fish meat into the meat collecting barrel while leaving the fish skin and fish bones outside, utilizing the mutual squeezing action of the rolling meat collecting and the transmission rubber belt.

The demand for fish deboning machines is expected to augment as deboning different fish requires different processes. Moreover, the traditional concept of deboning fish has been dissolved, and automatic fish deboning machines are now being extensively used to extract the surimi from the fish by squeezing, which separates the fish flesh, fish skins, and fish bones. In addition, the surimi, shrimp meat, crab meat, etc., processed by the fish deboning machine, can be used to make fish balls, shrimp balls, crab buns, fish dumplings, etc.

This is estimated to expand the global fish deboning machine market size. The fish deboning machines are not too bulky; they have a compact structure and are mainly composed of a motor, a scraper, a tensioning device, a transmission device, a conveyor belt, a fish bones outlet, a surimi outlet, a rotating drum, and a fresh fish fillets inlet. Furthermore, the screen hole diameter can be customized according to the different processing needs of users.

Attributes Details
Fish Deboning Machine Market Size (2023) US$ 274 Million
Fish Deboning Machine Market Size (2033) US$ 415 Million
Fish Deboning Machine Market CAGR 3.9%

Don't pay for what you don't need

Customize your report by selecting specific countries or regions and save 30%!

Market Players Aim to Offer Cutting-Edge Technology to Save Labour

Key players claim that the fish deboning machines can work at temperatures as low as -30 °C and are designed to be waterproof. They take pride in having built a solid reputation for excellent product quality, reliability, and affordability.

Their goal is superior customer service with competitive prices. Their aim is to offer cutting-edge technology to save labor and maximize resources. In addition, they provide advanced high-quality fish deboning machines and solutions to fit all budgets and sectors. These machines provide a high-quality product ready for preparation at a rate of up to 50 Lakh fish per minute.

It is crucial for manufacturers to make sure that these machines are reworked concerning hygiene and that the main parts can be opened or lifted for the better. A quick tightening device for dismantling the transport belt ensures easier cleaning and maintenance. Additionally, one side of the machine grinds fish bone and blood clots, and the other side grinds fish skin. The whole process is extremely fast and beginner-friendly. All these factors are anticipated to generate market opportunities and expand the global fish deboning machine market size.

Processed food and packaged convenience food products have been increasing in demand over the years. These products require minced meat to mould and hence rely on the proper processing of fish meat which includes efficient deboning. This is likely to spark innovations in the fish deboning machines market trends.

15% of the global supply of animal proteins is derived from seafood, as stated according to data published by the Food & Agriculture Organization (FAO). This is likely to encourage producers to scale up their production with the help of efficient equipment and hence is estimated to boost the market growth.

A Contrast with the Historical Market Scenario

The statistics accumulated by Future Market Insights, reveal the global forum of fish deboning machines which has witnessed an unprecedented surge over the past few years. The manufacturers in the market are in conjunction with the increasing demand for fish deboning machines. There has been a gradual rise from a CAGR of 2.5% registered during the period of 2018 to 2022 and is likely to expand at a steady 3.9% in the forecast period.

The significant growth in the market can be attributed to the high consumption of fish, across the globe. The process of deboning can be a tedious, time-consuming process if done manually using various mechanisms such as a manual method of meat bone separation, where the tool is manually operated by gripping and pulling bones from a fish fillet. Owing to the high demand for fish and seafood, the processing is required to be faster. This increased the deployment of fish deboning machines, as deboned fish has various applications in the commercial sector.

Over the years, fish deboning machines have been growing in demand as huge quantities of comminuted raw meat from fish are utilized in the manufacture of food products such as fish burgers, fish sticks, canned fish, fish sausage, and fish dumplings. The objective of this invention was to develop a hygienic, provision for cleaning-in-place (CIP) that gives cost-effective need and reliability for both large and small scale industries to produce fish meat in turn used for their value-added products. This is estimated to propel the adoption of the fish deboning machine market in the forecast period.

Nandini Roy Choudhury

Principal Consultant

Talk to Analyst

Find your sweet spots for generating winning opportunities in this market.

Comparative Analysis of Adjacent Markets

Fish Deboning Machine Market:

Attributes Fish Deboning Machine Market
CAGR (2023 to 2033) 3.9%
Market Value (2033) US$ 415 Million
Growth Factor The use of multifunctional equipment ensures high quality with efficiency
Opportunity Several leading players are investing in research and development (Research and Development) activities to introduce innovative designs with enhanced capacities.
Restraints Rise in concerns regarding the safety and quality of seafood.

Frozen Meat Grinder Market:

Attributes Frozen Meat Grinder Market
CAGR (2023 to 2033) 5.4%
Market Value (2033) US$ 1,892.5 Million
Growth Factor Even the toughest blocks of deep-frozen meat can be pre-grounded.
Opportunity Considerable contributions to local, national, and international trade, along with consumers in emerging countries gaining more purchasing power.
Restraints Consumption of diets high in red and processed meats leads to various health risks.

Fish Processing Market:

Attributes Fish Processing Market
CAGR (2023 to 2033) 5.7%
Market Value (2033) US$ 430,144.46 Million
Growth Factor Aquaculture has emerged as a popular substitute as a protein-rich food source that offers a wide range of benefits for addressing increasing health issues.
Opportunity Elderly customers are eager to take precautions against certain diseases by consuming Omega-3 fatty acids in fish oil.
Restraints Negative impacts are connected to the intake of fisheries products as a result of the high degree of water pollution.

Category-wise Insights

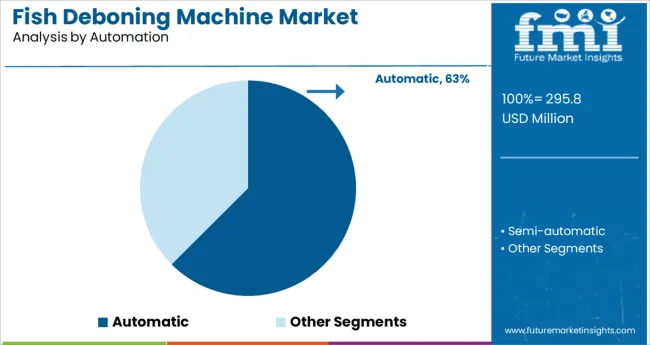
  • Automatic - By Operating Type

By operating type, the market is segmented into automatic and semi-automatic. It has been observed by the analysts at Future Market Insights that the automatic segment is estimated to hold a major market share, recording a CAGR of 4.9% through the forecast period.

The pivotal elements determining the momentum of this segment are:

  • This type of deboning machine makes the process faster and more efficient. Hence, it significantly reduces workload/human labor.
  • The processing is automatic in these machines, which saves time and effort. Moreover, highly automated players are adopting robotics and hands-free processing.
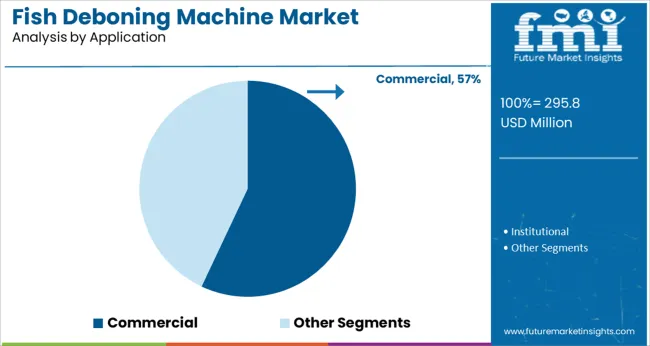
  • Commercial - By Application Type

By application type, the market is segmented into commercial and institutional. It has been researched by the analysts at Future Market Insights that the commercial segment is likely to hold a major market share, recording a CAGR of 4.2% through the forecast period.

The vital attributes determining the momentum of this segment are:

  • The growing popularity of packaged and convenience foods across the world, as well as improved distribution channels.
  • Hotels and restaurants require deboned fish since it facilitates cooking, which is essential owing to the influx of orders every day.

Preventing Fish Products from Deterioration and Organic Products & Other Drivers

There is a constant growth in demand for fish deboning machines because of the increasing focus on preventing fish products from deteriorating. Furthermore, the extracted protein from fish has various properties such as gelling activity, oil absorption, foaming capacity, and water-holding capacity.

Fish meat and proteins are used as ingredients in various food products including soups, infant formulas, and bakery substitutes. In addition, leading producers and exporters of fish products rely heavily on advanced fish deboning machines which facilitates the growth of the market share.

Fish meat provides two kinds of omega-3 fatty acids which are eicosapentaenoic acid (EPA) and docosahexaenoic acid (DHA). Consumers recognize the vital roles these fatty acids play in controlling hypertension, improving brain function, and reducing inflammation. This is estimated to increase demand for fish deboning machines.

High Capital Investment & Other Hindrances and Future Scopes

Despite the several advantages of fish deboning machines, the high capital investment in these machines can be extremely over the budget for small and mid-range consumers. Additionally, several countries have limited knowledge regarding technological development and advancement in the processing food industry due to a lack of availability of information. These factors are expected to hinder market growth.

On the contrary, seafood producers are encouraged to increase their production with efficient manufacturing processes to maintain production costs owing to the rise in demand for fish. Furthermore, emerging countries have witnessed a growing adoption of fish deboning machines which is a supportive factor for seafood producers. This is anticipated to generate market opportunities in the forecast period.
Get the data you need at a Fraction of the cost

Personalize your report by choosing insights you need
and save 40%!

Region-Wise Insights

German Manufacturers are Incorporating Patented Technology into Fish Deboning Machines

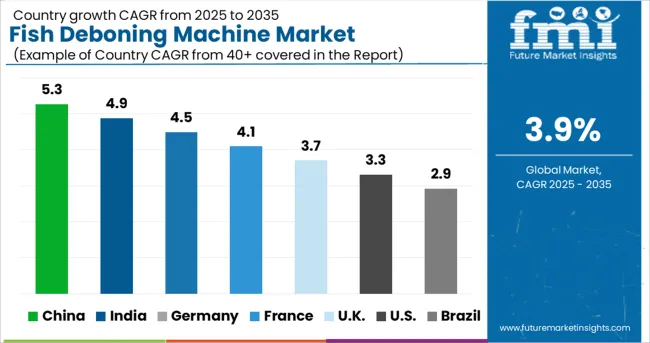
The presence of major market players in fish deboning machines in Germany makes it a lucrative market with a revenue of 2.9%. Most of the market players are headquartered in rural areas where they work with various niches and have managed to assert themselves over decades. In addition, sales of new machines and spare parts offer installation support for new processing lines and provide service and maintenance on their customers’ fleets.

Owing to the patented technology incorporated into the production of fish deboning machines, German customers have taken advantage of the high-quality meat recovered from these machines. Moreover, the machine further helps small-scale processors extract the meat and help businesses produce structured meat products out of fish. These factors are expected to drive the demand for fish deboning machines.

The players are able to provide a full range of technically advanced fish deboning machines to their customers. Furthermore, research and development (Research and Development) are being extensively carried out by experienced graduate engineers, electronic engineers, technicians, and mechanists who are working in laboratories, design, and research departments to find innovative solutions for manifold tasks. These factors are expected to support the fish deboning machine market growth.

In China, Certain Market Players Are Equipped With Independent Intellectual Property Rights

China is expected to hold a significant share with a revenue of 4.4% in the fish deboning machine market. This is attributed to the country being known for its wide range of food processing machines and one-stop intimate services. Moreover, these processing machines are versatile, i.e., they can be applied to both family and commercial use.

End users in China have a high demand for fish deboning machines that adopt the way of mechanical speed and drive regulation with an attractive appearance, long service life, and easy of operation. Furthermore, certain key players are equipped with independent intellectual property rights for their deboning equipment and production techniques, leading to the expansion of the fish deboning machine market size.

Manufacturers in China ensure that these machines are user-friendly with easy disassembling and easy to clean. In addition, China is one of the top fish and seafood-consuming countries. Hence, manufacturers also offer the ability to debone all types of fish. This is expected to contribute to global market growth.

Market players promote the fish deboning machine as a three-piece fish slicer. The replacement of labor is very efficient, and the meat yield is comparable to that of skilled workers. Moreover, it can be used because the mechanical equipment itself is cheap. These factors are expected to drive the sales of fish deboning machines.

Several States in India Have a High Consumption Rate of Fish

India is a significant fish deboning machine market growing at a profit of 5.3%. The market players in the country have years of expertise and experience. Additionally, the key companies have acquired specialization in offering the latest technology in fish deboning machines, with the support of their skilled and competent workforce.

Market players in India who are committed to fulfilling their clients’ demands are counted among the most reliable importers, suppliers, and distributors across the globe. Moreover, they offer a wide product portfolio with products that have been procured from well-established vendors who assure optimum quality products and timely deliveries. This is likely to increase the sales of fish deboning machines, in this region.

Several states in India such as West Bengal, Orissa, Tamil Nadu, Goa, Kerala, and Maharashtra, consume large quantities of fish and fish by-products. Hence, by adopting disruptive modern technologies, key players aim to provide the best fish deboning automation equipment that reduces human labor while increasing processing output with low wastage, amongst small end users like restaurants to large end users like fish farms and fish processing plants.

Japan, the Birthplace of ‘Sushi’ - A Lucrative Market for Fish Deboning Machines

With a market share of 3.7%, Japan is a notable fish deboning machine market. This is owing to the extremely high consumption of fish and other seafood in this country. Japan is surrounded by water bodies, and 90% of the diet of the major population consists of seafood.

Manufacturers in Japan are determined to adopt disruptive technological innovations such as robots and automation, which are expected to change how business is done. This is because Japan is the birthplace of sushi, which requires deboned, raw fish meat. These factors are estimated to increase the adoption of fish deboning machines in this region, in the forecast period.

Key players in Japan aim to partner with their clientele in which they are able to assist them in acquiring the maximum return on investment by automating their fish deboning processes. Moreover, their primary vision is to provide high-quality fish deboning machines that decrease human labor while improving production output with a minimal amount of wastage. These aspects are likely to boost the global fish deboning machine market growth
Unveiling the Start-Up Economy Supporting the Fish Deboning Machine Market

Start-up companies are incorporating advanced technologies or creating devices that support the global fish deboning machine market size:

  • Timberfish Technologies - It is a biotech company involved in the operation of a closed system using waste mitigation of aquaculture waste using insects to produce fish feeds. It uses plant material for the generation of microbial biomass and uses fish waste as feed for microbial organisms to grow. Insects are used for processing purposes and it produces by-products for use as fish feed. It claims that the system requires very less water intake.
  • Serviced Fresh Fish - It is a provider of tech-based solutions for safe and transparent seafood facilities using Near Infrared Spectroscopy, Near InfraRed Hyperspectral Imaging, Artificial Intelligence, and Machine Learning. They have developed a scientific testing facility for customers to detect seafood adulteration using the technologies like Near Infrared Spectroscopy, Near InfraRed Hyperspectral Imaging, Artificial Intelligence, and Machine Learning. They also use Blockchain technology to provide transparency in the supply chain for every product. It provides consumers with the details of the farmer who cultivated the products, costs associated with farming, the manufacturer who processed the product, costs associated with processing and packing, the manufacturer’s profit margin, transportation costs, etc.
  • Hyderabad Fish - It procures deboned and processed fish from seafood processing units and directly delivers it to consumers. The company has its own fleet for delivery. The company controls distribution through its online ordering platform. As of January 2015, it is delivering in select areas of Hyderabad city of India.

Top 5 Key Companies Transforming the Fish Deboning Machine Market Space

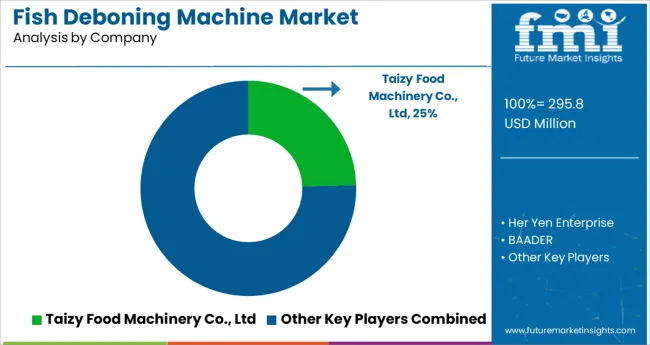
Owing to the presence of several players, the fish deboning machine market share is fragmented. Both developed and emerging markets are increasing the demand for these fish processing units. Hence, the demand for fish deboning machines has surged the number of distributors and suppliers.

  • Taizy Food Machinery Co. Ltd. - It is the leading food processing machinery manufacturer and supplier in China, which is adhering to the principle of Quality First, Customer First and aims to provide good business opportunities to its customers.
  • Her Yen Enterprise - It is a highly experienced expert in the design and manufacture of various kinds of food processing equipment.
  • BAADER - It is a worldwide manufacturer of innovative machinery for the food processing industry.
  • LIMA S.A.S. - It is specialized in the design, manufacturing, and sales of MEAT-BONE SEPARATORS, DEBONERS, and DESINEWERS, corresponding to the highest EU-USA Quality Standards, with the vision of becoming the world leader in this field.
  • Cabinplant A/S - It is a project-oriented supplier of turn-key solutions for global processors of fish and seafood, fruit and vegetables, meat and poultry, and convenience foods.

The latest developments in the fish deboning machine market are

  • In December 2019, three Memorandums of understanding (MoU) were signed between the Indian and Maldives governments for establishing Neighbourhood Fish Processing Plants in Addu City. The development of these new fish processing plants is the first in a series of High Impact Community Development (HICDP) projects that India and Maldives have agreed to jointly develop.
  • In July 2019, Indian Finance Minister Nirmala Sitharaman announced the introduction of a new scheme to promote processing in the fishery sector and allocated an estimated Rs 3,737 crore for the Ministry of Fisheries, Animal Husbandry, and Dairying. The new scheme is aimed to tackle numerous shortfalls in the value chain such as infrastructure, modernization, traceability, production, productivity, post-harvest management, and quality control.

Key Segments Profiled in the Fish Deboning Machine Market Survey

By Operating Type:

  • Automatic
  • Semi-automatic

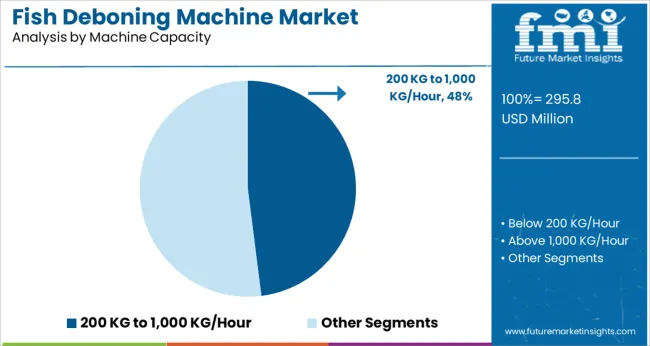
By Machine Capacity:

  • Below 200 Kg/Hr
  • 200 Kg to 1,000 Kg/Hr
  • Above 1,000 Kg/Hr

By Application:

  • Commercial
  • Institutional

By Region:

  • North America
  • Latin America
  • Asia Pacific
  • Middle East and Africa (MEA)
  • Europe

Frequently Asked Questions

What is the Demand Analysis for Fish Deboning Machine Market?

Demand for fish deboning machines is likely to grow at a CAGR of 3.9%, through 2033.

What is a Lucrative Opportunity of the Fish Deboning Machine Market?

Seafood producers increased their production with efficient manufacturing process to maintain production cost.

What is the Adoption Potential of Fish Deboning Machine?

The adoption potential of fish deboning machines is likely to reach a valuation of US$ 283 Million in 2023.

Table of Content
1. Executive Summary | Fish Deboning Machine Market

    1.1. Global Market Outlook

    1.2. Demand-side Trends

    1.3. Supply-side Trends

    1.4. Technology Roadmap Analysis

    1.5. Analysis and Recommendations

2. Market Overview

    2.1. Market Coverage / Taxonomy

    2.2. Market Definition / Scope / Limitations

3. Market Background

    3.1. Market Dynamics

        3.1.1. Drivers

        3.1.2. Restraints

        3.1.3. Opportunity

        3.1.4. Trends

    3.2. Impact of Covid-19

        3.2.1. Demand in Optimistic Scenario

        3.2.2. Demand in Likely Scenario

        3.2.3. Demand in Conservative Scenario

    3.3. Macro Factors and Forecast Factors

    3.4. Value Chain Analysis

        3.4.1. Profit Margin Analysis

        3.4.2. Raw Automation Suppliers

        3.4.3. Manufacturers, Wholesalers, and Distributors

        3.4.4. End Users/ Customers

    3.5. Regional Parent Market Outlook

    3.6. Production and Consumption Statistics

    3.7. Global Average Pricing Analysis Benchmark

4. Global Market Analysis 2018 to 2022 and Forecast, 2023 to 2033

    4.1. Historical Market Size Value (US$ Million) & Volume (Units) Analysis, 2018 to 2022

    4.2. Current and Future Market Size Value (US$ Million) & Volume (Units) Projections, 2023 to 2033

        4.2.1. Y-o-Y Growth Trend Analysis

        4.2.2. Absolute $ Opportunity Analysis

5. Global Market Analysis 2016 to 2022 and Forecast 2023 to 2033, By Automation

    5.1. Introduction / Key Findings

    5.2. Historical Market Size Value (US$ Million) & Volume (Units) Analysis By Automation, 2018 to 2022

    5.3. Current and Future Market Size Value (US$ Million) & Volume (Units) Analysis and Forecast By Automation, 2023 to 2033

        5.3.1. Semi-automatic

        5.3.2. Automatic

    5.4. Y-o-Y Growth Trend Analysis By Automation, 2018 to 2022

    5.5. Absolute $ Opportunity Analysis By Automation, 2023 to 2033

6. Global Market Analysis 2016 to 2022 and Forecast 2023 to 2033, By Machine Capacity

    6.1. Introduction / Key Findings

    6.2. Historical Market Size Value (US$ Million) & Volume (Units) Analysis By Machine Capacity, 2018 to 2022

    6.3. Current and Future Market Size Value (US$ Million) & Volume (Units) Analysis and Forecast By Machine Capacity, 2023 to 2033

        6.3.1. Below 200 KG/Hour

        6.3.2. 200 KG to 1,000 KG/ Hour

        6.3.3. Above 1,000 KG/ Hour

    6.4. Y-o-Y Growth Trend Analysis By Machine Capacity, 2018 to 2022

    6.5. Absolute $ Opportunity Analysis By Machine Capacity, 2023 to 2033

7. Global Market Analysis 2016 to 2022 and Forecast 2023 to 2033, By Application

    7.1. Introduction / Key Findings

    7.2. Historical Market Size Value (US$ Million) & Volume (Units) Analysis By Application, 2018 to 2022

    7.3. Current and Future Market Size Value (US$ Million) & Volume (Units) Analysis and Forecast By Application, 2023 to 2033

        7.3.1. Institutional

        7.3.2. Commercial

    7.4. Y-o-Y Growth Trend Analysis By Application, 2018 to 2022

    7.5. Absolute $ Opportunity Analysis By Application, 2023 to 2033

8. Global Market Analysis 2016 to 2022 and Forecast 2023 to 2033, by Region

    8.1. Introduction / Key Findings

    8.2. Historical Market Size Value (US$ Million) & Volume (Units) Analysis By Region, 2018 to 2022

    8.3. Current and Future Market Size Value (US$ Million) & Volume (Units) Analysis and Forecast By Region, 2023 to 2033

        8.3.1. North America

        8.3.2. Latin America

        8.3.3. Europe

        8.3.4. East Asia

        8.3.5. South Asia

        8.3.6. Oceania

        8.3.7. Middle East and Africa (MEA)

    8.4. Market Attractiveness Analysis, by Region

9. North America Market Analysis 2016 to 2022 and Forecast 2023 to 2033, By Country

    9.1. Historical Market Size Value (US$ Million) & Volume (Units) Trend Analysis By Market Taxonomy, 2018 to 2022

    9.2. Market Size Value (US$ Million) & Volume (Units) Forecast By Market Taxonomy, 2023 to 2033

        9.2.1. By Country

            9.2.1.1. United States of America

            9.2.1.2. Canada

        9.2.2. By Automation

        9.2.3. By Machine Capacity

        9.2.4. By Application

    9.3. Market Attractiveness Analysis

        9.3.1. By Country

        9.3.2. By Automation

        9.3.3. By Machine Capacity

        9.3.4. By Application

    9.4. Key Takeaways

10. Latin America Market Analysis 2016 to 2022 and Forecast 2023 to 2033, By Country

    10.1. Historical Market Size Value (US$ Million) & Volume (Units) Trend Analysis By Market Taxonomy, 2018 to 2022

    10.2. Market Size Value (US$ Million) & Volume (Units) Forecast By Market Taxonomy, 2023 to 2033

        10.2.1. By Country

            10.2.1.1. Brazil

            10.2.1.2. Mexico

            10.2.1.3. Argentina

            10.2.1.4. Chile

            10.2.1.5. Peru

            10.2.1.6. Rest of Latin America

        10.2.2. By Automation

        10.2.3. By Machine Capacity

        10.2.4. By Application

    10.3. Market Attractiveness Analysis

        10.3.1. By Country

        10.3.2. By Automation

        10.3.3. By Machine Capacity

        10.3.4. By Application

    10.4. Key Takeaways

11. Europe Market Analysis 2016 to 2022 and Forecast 2023 to 2033, By Country

    11.1. Historical Market Size Value (US$ Million) & Volume (Units) Trend Analysis By Market Taxonomy, 2018 to 2022

    11.2. Market Size Value (US$ Million) & Volume (Units) Forecast By Market Taxonomy, 2023 to 2033

        11.2.1. By Country

            11.2.1.1. Germany

            11.2.1.2. Italy

            11.2.1.3. France

            11.2.1.4. United Kingdom

            11.2.1.5. Spain

            11.2.1.6. BENELUX

            11.2.1.7. Nordic

            11.2.1.8. Russia

            11.2.1.9. Poland

            11.2.1.10. Rest of Europe

        11.2.2. By Automation

        11.2.3. By Machine Capacity

        11.2.4. By Application

    11.3. Market Attractiveness Analysis

        11.3.1. By Country

        11.3.2. By Automation

        11.3.3. By Machine Capacity

        11.3.4. By Application

    11.4. Key Takeaways

12. East Asia Market Analysis 2016 to 2022 and Forecast 2023 to 2033, By Country

    12.1. Historical Market Size Value (US$ Million) & Volume (Units) Trend Analysis By Market Taxonomy, 2018 to 2022

    12.2. Market Size Value (US$ Million) & Volume (Units) Forecast By Market Taxonomy, 2023 to 2033

        12.2.1. By Country

            12.2.1.1. China

            12.2.1.2. Japan

            12.2.1.3. South Korea

        12.2.2. By Automation

        12.2.3. By Machine Capacity

        12.2.4. By Application

    12.3. Market Attractiveness Analysis

        12.3.1. By Country

        12.3.2. By Automation

        12.3.3. By Machine Capacity

        12.3.4. By Application

    12.4. Key Takeaways

13. South Asia Market Analysis 2016 to 2022 and Forecast 2023 to 2033, By Country

    13.1. Historical Market Size Value (US$ Million) & Volume (Units) Trend Analysis By Market Taxonomy, 2018 to 2022

    13.2. Market Size Value (US$ Million) & Volume (Units) Forecast By Market Taxonomy, 2023 to 2033

        13.2.1. By Country

            13.2.1.1. India

            13.2.1.2. Thailand

            13.2.1.3. Malaysia

            13.2.1.4. Indonesia

            13.2.1.5. Rest of South Asia

        13.2.2. By Automation

        13.2.3. By Machine Capacity

        13.2.4. By Application

    13.3. Market Attractiveness Analysis

        13.3.1. By Country

        13.3.2. By Automation

        13.3.3. By Machine Capacity

        13.3.4. By Application

    13.4. Key Takeaways

14. Oceania Market Analysis 2016 to 2022 and Forecast 2023 to 2033, By Country

    14.1. Historical Market Size Value (US$ Million) & Volume (Units) Trend Analysis By Market Taxonomy, 2018 to 2022

    14.2. Market Size Value (US$ Million) & Volume (Units) Forecast By Market Taxonomy, 2023 to 2033

        14.2.1. By Country

            14.2.1.1. Australia

            14.2.1.2. New Zealand

        14.2.2. By Automation

        14.2.3. By Machine Capacity

        14.2.4. By Application

    14.3. Market Attractiveness Analysis

        14.3.1. By Country

        14.3.2. By Automation

        14.3.3. By Machine Capacity

        14.3.4. By Application

    14.4. Key Takeaways

15. Middle East & Africa Market Analysis 2016 to 2022 and Forecast 2023 to 2033, By Country

    15.1. Historical Market Size Value (US$ Million) & Volume (Units) Trend Analysis By Market Taxonomy, 2018 to 2022

    15.2. Market Size Value (US$ Million) & Volume (Units) Forecast By Market Taxonomy, 2023 to 2033

        15.2.1. By Country

            15.2.1.1. GCC Countries

            15.2.1.2. Turkey

            15.2.1.3. Northern Africa

            15.2.1.4. South Africa

            15.2.1.5. Rest of MEA

        15.2.2. By Automation

        15.2.3. By Machine Capacity

        15.2.4. By Application

    15.3. Market Attractiveness Analysis

        15.3.1. By Country

        15.3.2. By Automation

        15.3.3. By Machine Capacity

        15.3.4. By Application

    15.4. Key Takeaways

16. Country-wise Market Analysis 

    16.1. United States (USA)

        16.1.1. Market Share Analysis, 2023

        16.1.2. By Automation

        16.1.3. By Machine Capacity

        16.1.4. By Application

    16.2. Canada

        16.2.1. Market Share Analysis, 2023

        16.2.2. By Automation

        16.2.3. By Machine Capacity

        16.2.4. By Application

    16.3. Brazil

        16.3.1. Market Share Analysis, 2023

        16.3.2. By Automation

        16.3.3. By Machine Capacity

        16.3.4. By Application

    16.4. Mexico

        16.4.1. Market Share Analysis, 2023

        16.4.2. By Automation

        16.4.3. By Machine Capacity

        16.4.4. By Application

    16.5. Germany

        16.5.1. Market Share Analysis, 2023

        16.5.2. By Automation

        16.5.3. By Machine Capacity

        16.5.4. By Application

    16.6. Italy

        16.6.1. Market Share Analysis, 2023

        16.6.2. By Automation

        16.6.3. By Machine Capacity

        16.6.4. By Application

    16.7. France

        16.7.1. Market Share Analysis, 2023

        16.7.2. By Automation

        16.7.3. By Machine Capacity

        16.7.4. By Application

    16.8. Spain

        16.8.1. Market Share Analysis, 2023

        16.8.2. By Automation

        16.8.3. By Machine Capacity

        16.8.4. By Application

    16.9. United Kingdom

        16.9.1. Market Share Analysis, 2023

        16.9.2. By Automation

        16.9.3. By Machine Capacity

        16.9.4. By Application

    16.10. Russia

        16.10.1. Market Share Analysis, 2023

        16.10.2. By Automation

        16.10.3. By Machine Capacity

        16.10.4. By Application

    16.11. China

        16.11.1. Market Share Analysis, 2023

        16.11.2. By Automation

        16.11.3. By Machine Capacity

        16.11.4. By Application

    16.12. Japan

        16.12.1. Market Share Analysis, 2023

        16.12.2. By Automation

        16.12.3. By Machine Capacity

        16.12.4. By Application

    16.13. India

        16.13.1. Market Share Analysis, 2023

        16.13.2. By Automation

        16.13.3. By Machine Capacity

        16.13.4. By Application

    16.14. GCC Countries

        16.14.1. Market Share Analysis, 2023

        16.14.2. By Automation

        16.14.3. By Machine Capacity

        16.14.4. By Application

    16.15. Australia

        16.15.1. Market Share Analysis, 2023

        16.15.2. By Automation

        16.15.3. By Machine Capacity

        16.15.4. By Application

17. Market Structure Analysis

    17.1. Competition Dashboard

    17.2. Competition Benchmarking

    17.3. Market Share Analysis of Top Players

        17.3.1. By Region

        17.3.2. By Product Portfolio

18. Competition Analysis

    18.1. Competition Deep Dive

        18.1.1. Taizy Food Machinery Co., Ltd

            18.1.1.1. Overview

            18.1.1.2. Product Portfolio

            18.1.1.3. Profitability by Market Segments (Product/Channel/Region)

            18.1.1.4. Sales Footprint

            18.1.1.5. Strategy Overview

                18.1.1.5.1. Marketing Strategy

                18.1.1.5.2. Product Strategy

                18.1.1.5.3. Channel Strategy

        18.1.2. Her Yen Enterprise

            18.1.2.1. Overview

            18.1.2.2. Product Portfolio

            18.1.2.3. Profitability by Market Segments (Product/Channel/Region)

            18.1.2.4. Sales Footprint

            18.1.2.5. Strategy Overview

                18.1.2.5.1. Marketing Strategy

                18.1.2.5.2. Product Strategy

                18.1.2.5.3. Channel Strategy

        18.1.3. BAADER

            18.1.3.1. Overview

            18.1.3.2. Product Portfolio

            18.1.3.3. Profitability by Market Segments (Product/Channel/Region)

            18.1.3.4. Sales Footprint

            18.1.3.5. Strategy Overview

                18.1.3.5.1. Marketing Strategy

                18.1.3.5.2. Product Strategy

                18.1.3.5.3. Channel Strategy

        18.1.4. LIMA S.A.S.

            18.1.4.1. Overview

            18.1.4.2. Product Portfolio

            18.1.4.3. Profitability by Market Segments (Product/Channel/Region)

            18.1.4.4. Sales Footprint

            18.1.4.5. Strategy Overview

                18.1.4.5.1. Marketing Strategy

                18.1.4.5.2. Product Strategy

                18.1.4.5.3. Channel Strategy

        18.1.5. Cabinplant A/S

            18.1.5.1. Overview

            18.1.5.2. Product Portfolio

            18.1.5.3. Profitability by Market Segments (Product/Channel/Region)

            18.1.5.4. Sales Footprint

            18.1.5.5. Strategy Overview

                18.1.5.5.1. Marketing Strategy

                18.1.5.5.2. Product Strategy

                18.1.5.5.3. Channel Strategy

        18.1.6. Giantwell

            18.1.6.1. Overview

            18.1.6.2. Product Portfolio

            18.1.6.3. Profitability by Market Segments (Product/Channel/Region)

            18.1.6.4. Sales Footprint

            18.1.6.5. Strategy Overview

                18.1.6.5.1. Marketing Strategy

                18.1.6.5.2. Product Strategy

                18.1.6.5.3. Channel Strategy

        18.1.7. Nikko Co., Ltd.

            18.1.7.1. Overview

            18.1.7.2. Product Portfolio

            18.1.7.3. Profitability by Market Segments (Product/Channel/Region)

            18.1.7.4. Sales Footprint

            18.1.7.5. Strategy Overview

                18.1.7.5.1. Marketing Strategy

                18.1.7.5.2. Product Strategy

                18.1.7.5.3. Channel Strategy

        18.1.8. RYCO

            18.1.8.1. Overview

            18.1.8.2. Product Portfolio

            18.1.8.3. Profitability by Market Segments (Product/Channel/Region)

            18.1.8.4. Sales Footprint

            18.1.8.5. Strategy Overview

                18.1.8.5.1. Marketing Strategy

                18.1.8.5.2. Product Strategy

                18.1.8.5.3. Channel Strategy

        18.1.9. AGK Kronawitter GmbH .

            18.1.9.1. Overview

            18.1.9.2. Product Portfolio

            18.1.9.3. Profitability by Market Segments (Product/Channel/Region)

            18.1.9.4. Sales Footprint

            18.1.9.5. Strategy Overview

                18.1.9.5.1. Marketing Strategy

                18.1.9.5.2. Product Strategy

                18.1.9.5.3. Channel Strategy

        18.1.10. Pisces Fish Machinery Inc

            18.1.10.1. Overview

            18.1.10.2. Product Portfolio

            18.1.10.3. Profitability by Market Segments (Product/Channel/Region)

            18.1.10.4. Sales Footprint

            18.1.10.5. Strategy Overview

                18.1.10.5.1. Marketing Strategy

                18.1.10.5.2. Product Strategy

                18.1.10.5.3. Channel Strategy

        18.1.11. Uni-Food Technic

            18.1.11.1. Overview

            18.1.11.2. Product Portfolio

            18.1.11.3. Profitability by Market Segments (Product/Channel/Region)

            18.1.11.4. Sales Footprint

            18.1.11.5. Strategy Overview

                18.1.11.5.1. Marketing Strategy

                18.1.11.5.2. Product Strategy

                18.1.11.5.3. Channel Strategy

        18.1.12. WENMING

            18.1.12.1. Overview

            18.1.12.2. Product Portfolio

            18.1.12.3. Profitability by Market Segments (Product/Channel/Region)

            18.1.12.4. Sales Footprint

            18.1.12.5. Strategy Overview

                18.1.12.5.1. Marketing Strategy

                18.1.12.5.2. Product Strategy

                18.1.12.5.3. Channel Strategy

        18.1.13. Gems Machines

            18.1.13.1. Overview

            18.1.13.2. Product Portfolio

            18.1.13.3. Profitability by Market Segments (Product/Channel/Region)

            18.1.13.4. Sales Footprint

            18.1.13.5. Strategy Overview

                18.1.13.5.1. Marketing Strategy

                18.1.13.5.2. Product Strategy

                18.1.13.5.3. Channel Strategy

        18.1.14. Zhengzhou Tamok Machinery Co., Ltd

            18.1.14.1. Overview

            18.1.14.2. Product Portfolio

            18.1.14.3. Profitability by Market Segments (Product/Channel/Region)

            18.1.14.4. Sales Footprint

            18.1.14.5. Strategy Overview

                18.1.14.5.1. Marketing Strategy

                18.1.14.5.2. Product Strategy

                18.1.14.5.3. Channel Strategy

        18.1.15. Amisy Food machine

            18.1.15.1. Overview

            18.1.15.2. Product Portfolio

            18.1.15.3. Profitability by Market Segments (Product/Channel/Region)

            18.1.15.4. Sales Footprint

            18.1.15.5. Strategy Overview

                18.1.15.5.1. Marketing Strategy

                18.1.15.5.2. Product Strategy

                18.1.15.5.3. Channel Strategy

19. Assumptions and Acronyms Used

20. Research Methodology

Explore Process Automation Insights

View Reports
Future Market Insights

Fish Deboning Machine Market