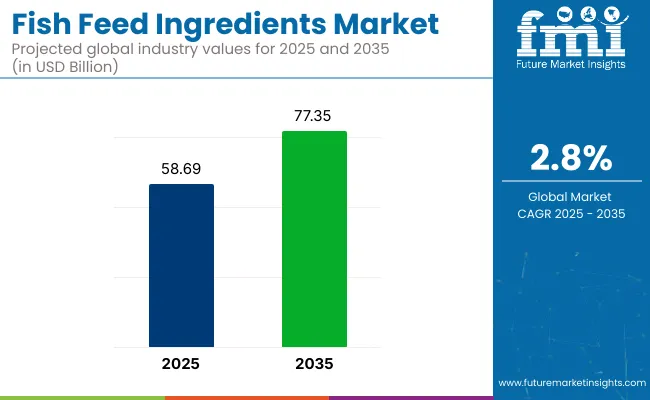
The fish-feed ingredients market is likely to be valued at USD 58.69 billion in 2025 and are projected to reach USD 77.35 billion by 2035, driven by a CAGR of 2.8%. Fish-meal supply was boosted by a 26% rebound in 2024 and a further 29% rise in early 2025 as multiple regions expanded production.

| Attribute | Value |
|---|---|
| Industry Value (2025) | USD 58.69 billion |
| Industry Value (2035) | USD 77.35 billion |
| CAGR (2025 to 2035) | 2.8% |
Quota volatility continues to shape global pricing, with Peruvian fluctuations having a wide impact. To stabilize margins, feed producers have been advised to diversify sourcing across regions, lock in soy-meal contracts at favorable rates, and secure lift capacity through time-charters as Pacific freight lanes face tightening availability.
On June 25, 2025, ADM opened a 1,600-square-meter R&D center at the Biopôle life science campus in Lausanne, Switzerland. This facility will advance microbiome research for pets, livestock, and aquaculture. ADM aims to develop tailored biotics and fermentation-derived ingredients to enhance animal health and well-being.
The center’s cutting-edge tools will help optimize digestive and immune functions, improving animal protein production. With a global biotics market valued at USD 5.2 billion in 2024, ADM’s investment supports science-backed solutions for more efficient and profitable animal nutrition.
Fish feed ingredients market share has been distributed across its broader parent industries as follows. Within the aquafeed market, fish feed ingredients account for approximately 28-30%, given their essential role in species-specific formulations for finfish and crustaceans. In the animal feed market, their share stands at around 10-12%, driven by niche aquatic applications.
Across the marine ingredients market, the share reaches 30-33%, supported by fish meal and fish oil consumption. Within the animal nutrition additives market, fish feed ingredients contribute about 16-18%, largely through the inclusion of essential micronutrients and bioactive compounds. In the livestock nutrition market, their share is approximately 13-15%, reflecting the growing overlap between aquatic and terrestrial feed innovations.
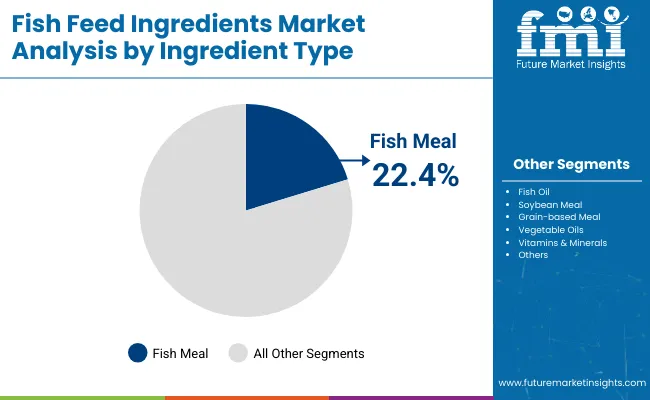
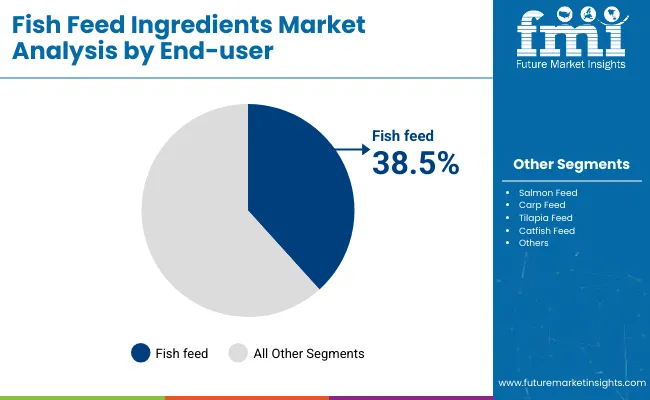
The industry, segmented by ingredient type, end-user, and region, is set for significant growth. Key ingredients, such as fishmeal, account for 22.4%. End-user applications, including fish feed, dominate with a 38.5% share.
The industry is further segmented by region, covering North America, Latin America, Western Europe, Eastern Europe, East Asia, South Asia & Pacific, Central Asia, Russia and Belarus, Balkan & Baltic Countries, and Middle East & Africa.

Fishmeal holds a 22.4% share in 2025 and is the primary ingredient driving themarket. Its rich nutritional profile, particularly high protein and omega-3 fatty acids, makes it indispensable for fish feed in aquaculture. Leading companies such as CP Foods, Marine Harvest, and Nutreco have been instrumental in expanding the demand for fishmeal.
This ingredient’s high-quality standards and role in supporting green feed practices are key drivers of its industry growth. As the global demand for nutritious, eco-friendly feed in aquaculture continues to rise, fishmeal will maintain its dominant position.

Fish feed is the largest end-user segment, holding 38.5% share in 2025. The rising demand for farmed fish, including species like salmon, tilapia, and carp, is propelling the need for high-quality fish feed. Major players such as Cargill, Alltech, and Skretting supply specialized feeds to meet the global need for farmed seafood.
As aquaculture practices expand across the world, the demand for fish feed continues to increase. Additionally, mollusk and crustacean feeds, including oyster and shrimp, are gaining traction, further boosting the growth of the fish feed segment.
The market is shifting toward high-qualityprotein sources like fishmeal, plant-based proteins, and insect-based ingredients. The use of plant-based ingredients is growing due to cost-effectiveness and sustainability. Regulatory changes are driving the adoption of green sourcing practices, with certification schemes ensuring environmental compliance.
Efficient Sourcing and Supply Chain Optimization
In 2025, fish feed ingredient suppliers worked on optimizing their supply chains by reducing sourcing times for key ingredients like fishmeal and plant-based proteins. These improvements were made possible through better transportation and storage systems.
Fish feed producers in Europe and South America responded to the growing demand by increasing their storage capacity. Digital tracking systems helped decrease supplier rejection rates, leading to better product consistency and more efficient synchronization of supply with regional demand.
Pressure from Rising Ingredient Costs and Supply Chain Disruptions
The fish feed industry is facing margin pressures due to rising raw material costs and logistical challenges. In 2025, the cost of fishmeal and freight prices increased, which impacted overall production costs and squeezed profit margins.
Price adjustments often lag behind cost increases, adding further pressure on margins. Some producers are renegotiating contracts with suppliers, while others are opting for bulk shipments to reduce transportation costs, although this may lead to quality trade-offs.

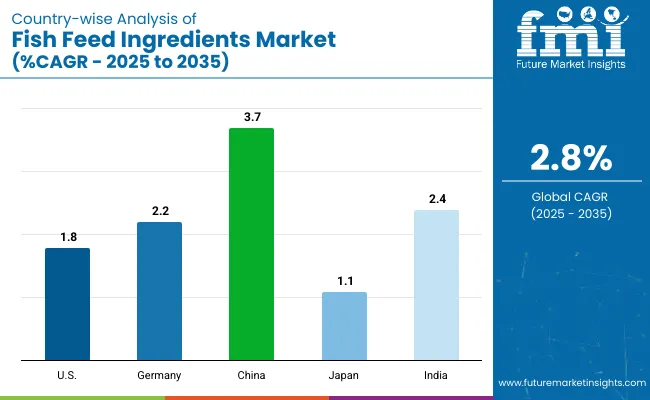
The report covers detailed analysis of 40+ countries and the top five countries have been shared as a reference.
| Countries | CAGR (2025 to 2035) |
|---|---|
| USA | 1.8% |
| Germany | 2.2% |
| China | 3.7% |
| Japan | 1.1% |
| India | 2.4% |
Global fish feed ingredients demand is projected to grow at a 2.8% CAGR from 2025 to 2035. China, a BRICS nation, leads with a robust 3.7%, driven by expanding aquaculture and increasing fish production in coastal regions. India, also a BRICS member, follows closely with a 2.4% growth, supported by its growing aquaculture sector in the ASEAN region.
The United States, part of the OECD, trails the global growth rate at 1.8%, constrained by market saturation and limited demand expansion. Japan, also in the OECD, experiences slower growth at 1.1%, largely due to its mature aquaculture industry. Germany, another OECD nation, shows a moderate 2.2% CAGR, benefiting from stable demand within the European market. Other ASEAN countries are also seeing growth but are not profiled here.
Adoption of fish feed ingredients in the United States is set to grow at a 1.8% CAGR through 2035, reflecting a more conservative growth rate. The industry benefits from technological advancements in fish feed and high-quality ingredient requirements. USA growth is centered on premium, specialized feed for species such as salmon and tilapia.
With strict environmental regulations and a focus on fish health, the USA industry is increasingly adopting innovative feed formulations. As part of the OECD, the USA benefits from integrated supply chains and steady demand for advanced feed technology, though it faces slower growth compared to BRICS countries.
The requirement of fish feed ingredients in Germany is forecast to expand at 2.2% CAGR, slightly below the global average. As part of the OECD, Germany focuses on high-value aquaculture feed solutions, leveraging innovation and stringent regulatory frameworks. The industry is driven by feed solutions that meet high-quality standards for fish farming.
With minimal reliance on imports, Germany is well-positioned to meet EU standards. Its focus on precision and regulatory compliance sets it apart from BRICS countries, where demand is more volume-driven, and ASEAN markets, where adoption of advanced feed solutions is slower.
China is expected to grow at a 3.7% CAGR through 2035, benefiting from large-scale demand in its expansive aquaculture sector. As a manufacturing powerhouse within the BRICS group, China plays a pivotal role in sourcing raw materials and meeting the growing demand for farmed fish.
The expansion of inland and coastal aquaculture farms, particularly in provinces like Guangdong and Zhejiang, supports long-term demand for fish feed. China's strategic position also allows for significant export capacity, giving it a competitive advantage over ASEAN countries while maintaining internal resilience against supply chain disruptions.
Sales of fish feed ingredients in Japan are growing at 1.1% CAGR, slightly trailing the global average. Demand is led by niche sectors, including feed for specialty species and high-quality marine fish. Japan’s mature economy, part of the OECD, prioritizes product safety, reliability, and high-performance feed, focusing on premium, specialized feeds.
The aquaculture sector in Japan remains small but highly specialized, and growth in fish feed demand is driven by innovation in species-specific formulations. Compared to BRICS countries, Japan’s approach is more focused on quality and precision rather than volume-based growth.
Demand for fish feed ingredients in India is expanding at a 2.4% CAGR, slightly above the global rate. As a BRICS nation, India benefits from its growing aquaculture industry, particularly in coastal regions. The government's initiatives to support fish farming and infrastructure development are key drivers of this growth.
Regional consumption, especially in states like Andhra Pradesh and West Bengal, is elevating its position in the market. The focus on improving feed quality and cost-effective production further strengthens its position, distinguishing it from ASEAN countries with lighter aquaculture activities.
Leading Company -Cargill, Inc.Industry Share - ~15%
The fish feed ingredients industry has been structured through a tiered competitive landscape comprising dominant manufacturers, key suppliers, and emerging innovators. Dominant players such as Cargill, Skretting (Nutreco), BioMar, Alltech, and Ridley have maintained leadership through precision formulation, high-protein optimization, and operational expansion across APAC and LATAM regions. Key suppliers including Nutreco, ADM, and Ridley Corporation have strong regional presence via integrated processing systems and raw material sourcing.
Emerging firms such as Calysta and Kemin Industries have gained momentum by developing alternative protein ingredients, such as single-cell proteins and specialty additives. Industry expansion continues to be driven by growing global seafood consumption and a transition toward functional, plant-based, and microbial feed component.
Recent Industry News
| Report Attributes | Details |
|---|---|
| Industry Size (2025) | USD 58.69 billion |
| Projected Industry Size (2035) | USD 77.35 billion |
| CAGR (2025 to 2035) | 2.8% |
| Base Year for Estimation | 2024 |
| Historical Period | 2020 to 2024 |
| Projections Period | 2025 to 2035 |
| Quantitative Units | USD billion for value and million metric tons for volume |
| Ingredient Types Analyzed (Segment 1) | Fish Meal, Fish Oil, Soybean Meal, Grain-Based Meal, Vegetable Oils, Vitamins & Minerals, Poultry Meal, Blood Meal, Hydrolyzed Feather Meal |
| End Users Analyzed (Segment 2) | Fish Feed, Salmon Feed, Carp Feed, Tilapia Feed, Catfish Feed, Oyster Feed, Mussel Feed, Crab Feed, Shrimp Feed |
| Regions Covered | North America, Latin America, Western Europe, Eastern Europe, East Asia, South Asia & Pacific, Central Asia, Russia & Belarus, Balkan & Baltic Countries, Middle East & Africa |
| Countries Covered | United States, Canada, Brazil, Mexico, Germany, United Kingdom, France, Italy, Spain, Russia, China, India, Japan, Vietnam, Thailand, Indonesia, South Korea, Australia, Saudi Arabia, South Africa |
| Key Players | Cargill, ADM Animal Nutrition, Skretting, Alltech Coppens, BioMar, Ridley Aqua Feed, Nutreco, Avanti Feeds Limited, Ridley Corporation Limited, Other Emerging Players |
| Additional Attributes | Dollar sales, share by ingredient type and species, demand growth in aquaculture and functional nutrition, innovation in alternative proteins, regional fish farming intensification patterns |
The segmentation includes fish meal, fish oil, soybean meal, grain-based meal, vegetable oils, vitamins & minerals, poultry meal, blood meal, and hydrolyzed feather meal.
End users are categorized into fish feed, salmon feed, carp feed, tilapia feed, catfish feed, oyster feed, mussel feed, crab feed, and shrimp feed.. They also cater to Mollusks such as Oyster Feed and Mussel Feed, as well as Crustaceans like Crab Feed and Shrimp Feed.
The industry is analyzed across North America, Latin America, Western Europe, Eastern Europe, East Asia, South Asia & Pacific, Central Asia, Russia & Belarus, Balkan & Baltic Countries, and Middle East & Africa.
The industry is projected to reach USD 58.69 billion in 2025.
The industry is expected to grow at a CAGR of 2.8% from 2025 to 2035.
Fishmeal is expected to hold 22.4% share by ingredient type, while fish feed will account for 38.5% by end use in 2025.
East Asia, particularly China, is projected to register a CAGR of 3.7% from 2025 to 2035.
The industry is projected to reach USD 77.35 billion by 2035.


Our Research Products

The "Full Research Suite" delivers actionable market intel, deep dives on markets or technologies, so clients act faster, cut risk, and unlock growth.

The Leaderboard benchmarks and ranks top vendors, classifying them as Established Leaders, Leading Challengers, or Disruptors & Challengers.

Locates where complements amplify value and substitutes erode it, forecasting net impact by horizon

We deliver granular, decision-grade intel: market sizing, 5-year forecasts, pricing, adoption, usage, revenue, and operational KPIs—plus competitor tracking, regulation, and value chains—across 60 countries broadly.

Spot the shifts before they hit your P&L. We track inflection points, adoption curves, pricing moves, and ecosystem plays to show where demand is heading, why it is changing, and what to do next across high-growth markets and disruptive tech

Real-time reads of user behavior. We track shifting priorities, perceptions of today’s and next-gen services, and provider experience, then pace how fast tech moves from trial to adoption, blending buyer, consumer, and channel inputs with social signals (#WhySwitch, #UX).

Partner with our analyst team to build a custom report designed around your business priorities. From analysing market trends to assessing competitors or crafting bespoke datasets, we tailor insights to your needs.
Supplier Intelligence
Discovery & Profiling
Capacity & Footprint
Performance & Risk
Compliance & Governance
Commercial Readiness
Who Supplies Whom
Scorecards & Shortlists
Playbooks & Docs
Category Intelligence
Definition & Scope
Demand & Use Cases
Cost Drivers
Market Structure
Supply Chain Map
Trade & Policy
Operating Norms
Deliverables
Buyer Intelligence
Account Basics
Spend & Scope
Procurement Model
Vendor Requirements
Terms & Policies
Entry Strategy
Pain Points & Triggers
Outputs
Pricing Analysis
Benchmarks
Trends
Should-Cost
Indexation
Landed Cost
Commercial Terms
Deliverables
Brand Analysis
Positioning & Value Prop
Share & Presence
Customer Evidence
Go-to-Market
Digital & Reputation
Compliance & Trust
KPIs & Gaps
Outputs
Full Research Suite comprises of:
Market outlook & trends analysis
Interviews & case studies
Strategic recommendations
Vendor profiles & capabilities analysis
5-year forecasts
8 regions and 60+ country-level data splits
Market segment data splits
12 months of continuous data updates
DELIVERED AS:
PDF EXCEL ONLINE
Fish Feed Pellet Making Machine Market Size and Share Forecast Outlook 2025 to 2035
Fish Feed Market Outlook - Growth, Demand & Forecast 2025 to 2035
Zero-Fishmeal Feed Market Analysis - Size and Share Forecast Outlook 2025 to 2035
Animal Feed Ingredients Market Analysis - Size, Share, & Forecast Outlook 2025 to 2035
USA Animal Feed Ingredients Market Report – Trends & Innovations 2025-2035
Plant-Based Feed Ingredients Market Size and Share Forecast Outlook 2025 to 2035
Analysis and Growth Projections for Plant-Based Fish Feed Business
Fish Protein Hydrolysate For Animal Feed And Pet Food Applications Market Size and Share Forecast Outlook 2025 to 2035
Nutritional Ingredients in Animal Feed Market Trends - Growth & Industry Forecast 2025 to 2035
Feed Mixer for Livestock Market Size and Share Forecast Outlook 2025 to 2035
Feed Preparation Machine Market Size and Share Forecast Outlook 2025 to 2035
Feed Additive Nosiheptide Premix Market Size and Share Forecast Outlook 2025 to 2035
Feeder Container Market Size and Share Forecast Outlook 2025 to 2035
Feed Machine Market Forecast Outlook 2025 to 2035
Feed Pigment Market Forecast and Outlook 2025 to 2035
Feed Mixer Market Forecast and Outlook 2025 to 2035
Fish Pond Circulating Water Pump Filter Market Size and Share Forecast Outlook 2025 to 2035
Fish Hydrolysate Market Size and Share Forecast Outlook 2025 to 2035
Fish Protein Isolates Market Size and Share Forecast Outlook 2025 to 2035
Feed Grade Spray-dried Animal Plasma (SDAP) Market Size and Share Forecast Outlook 2025 to 2035

Thank you!
You will receive an email from our Business Development Manager. Please be sure to check your SPAM/JUNK folder too.
Chat With
MaRIA