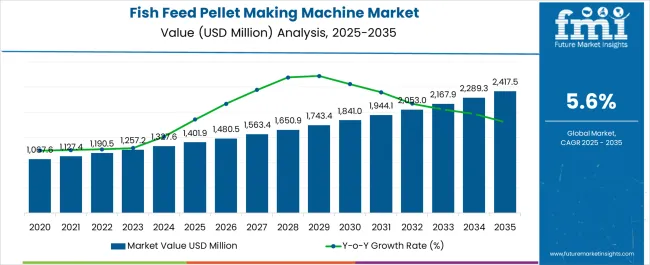
The fish feed pellet making machine market is estimated to be valued at USD 1401.9 million in 2025 and is projected to reach USD 2417.5 million by 2035, registering a compound annual growth rate (CAGR) of 5.6% over the forecast period. The market demonstrates substantial expansion driven by aquaculture industry growth, fish farming intensification, and nutritional optimization demands that require specialized equipment capable of producing consistent pellet sizes, densities, and nutritional content tailored to diverse fish species and growth stages.
Commercial aquaculture operations implement automated pellet production systems that accommodate various raw materials including fish meal, soy protein, grains, and specialized additives while maintaining pellet integrity and water stability throughout feeding operations. The technology's evolution toward floating and sinking pellet versatility creates demand for machines that adjust processing parameters to achieve specific pellet characteristics optimized for different fish feeding behaviors and aquatic environments.
Large-scale aquaculture facilities represent the dominant consumption segment where high-capacity pellet making machines enable cost-effective feed production while maintaining nutritional consistency across massive fish populations requiring precise feeding regimens.
Fish farm operators specify equipment systems that process bulk ingredients while incorporating vitamins, minerals, and growth promoters through uniform mixing and controlled extrusion processes. Quality control protocols emphasize pellet durability testing, water stability evaluation, and nutritional homogeneity verification that ensure consistent fish growth rates and feed conversion efficiency throughout production cycles.
Commercial feed manufacturing markets demonstrate increasing adoption of specialized pellet machines designed for different fish species including salmon, tilapia, catfish, and shrimp that require distinct pellet formulations, sizes, and floating characteristics based on feeding habits and digestive requirements.
Feed mills utilize flexible production systems that accommodate recipe changes and ingredient substitutions while maintaining pellet quality standards necessary for optimal fish health and growth performance. Nutritional customization capabilities enable production of medicated feeds, organic formulations, and specialty diets addressing specific aquaculture applications and market segments.
Competitive dynamics involve strategic partnerships between pellet machine manufacturers and aquaculture nutrition companies who collaborate on equipment optimization and feed formulation development that maximizes fish growth performance while reducing production costs. Technical service capabilities increasingly differentiate suppliers as aquaculture operators require comprehensive support including installation assistance, operator training, and ongoing process optimization that ensure consistent pellet quality and production efficiency.
Training programs address proper machine operation and maintenance procedures as pellet making equipment requires specialized knowledge regarding ingredient handling, processing parameter optimization, and quality control techniques that ensure consistent feed production and equipment longevity throughout demanding aquaculture production environments requiring reliable feed supply and nutritional consistency.
| Metric | Value |
|---|---|
| Fish Feed Pellet Making Machine Market Estimated Value in (2025 E) | USD 1401.9 million |
| Fish Feed Pellet Making Machine Market Forecast Value in (2035 F) | USD 2417.5 million |
| Forecast CAGR (2025 to 2035) | 5.6% |
The fish feed pellet making machine market is experiencing notable expansion as demand for high quality aquafeed continues to rise in line with the rapid growth of global aquaculture. The push for optimized feed conversion ratios, improved nutritional content, and sustainable fish farming practices is driving adoption of advanced pelletizing machinery.
Manufacturers are investing in energy efficient systems that deliver uniform pellet size and enhanced durability, ensuring better digestibility and water stability. Technological developments such as automation, precision controls, and material flexibility are further improving production efficiency.
Increasing emphasis on reducing feed wastage and enhancing farm profitability is creating strong market momentum. With aquaculture emerging as a key contributor to food security, the outlook remains positive for pellet making machines that can deliver scalability, consistency, and cost effectiveness across both large and small farming operations.
The market is segmented by Type, Application, and Sales Channel and region. By Type, the market is divided into Ring Die Pellet Mill and Flat Die Pellet Mill. In terms of Application, the market is classified into Small-Scale Aquaculture, Large-Scale Aquaculture, and Others. Based on Sales Channel, the market is segmented into Online and Offline. Regionally, the market is classified into North America, Latin America, Western Europe, Eastern Europe, Balkan & Baltic Countries, Russia & Belarus, Central Asia, East Asia, South Asia & Pacific, and the Middle East & Africa.
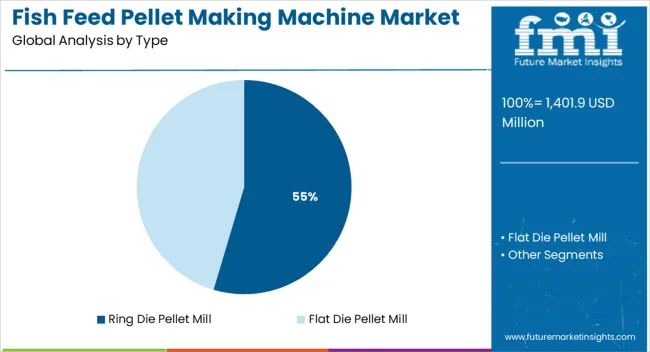
The ring die pellet mill type segment is projected to contribute 54.60% of total revenue by 2025 within the type category, making it the most dominant segment. Its leadership is attributed to high throughput capacity, efficiency in producing uniform pellets, and durability under continuous operation.
The ability to handle diverse raw materials and ensure consistent pellet quality has positioned ring die systems as the preferred choice for commercial fish feed production.
Their operational efficiency and scalability align with the requirements of modern aquaculture enterprises, strengthening their dominance in the type category.
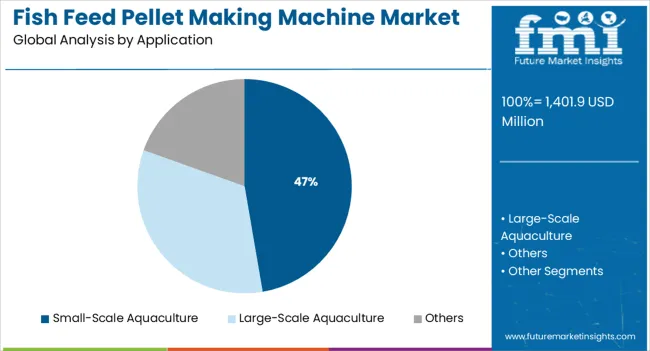
The small scale aquaculture application segment is expected to account for 47.30% of market revenue by 2025, establishing it as the leading application area. Growth is being driven by rising participation of smallholder farmers in fish farming, increasing accessibility of affordable machinery, and supportive government initiatives for rural aquaculture development.
The machines’ adaptability to varying feed formulations and relatively low maintenance requirements make them attractive for small scale users.
Enhanced focus on local fish production and self sufficiency has further bolstered demand, reinforcing the prominence of this application segment.
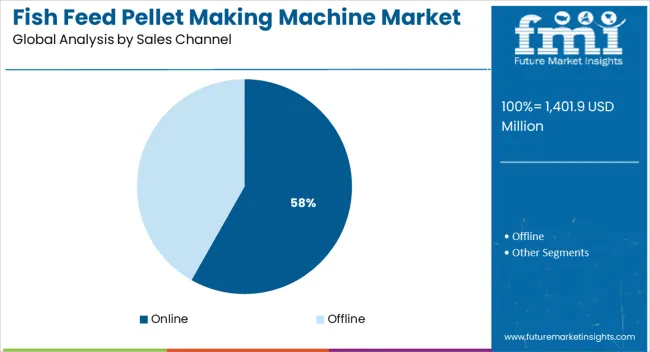
The online sales channel is projected to represent 58.20% of market revenue by 2025, marking it as the leading distribution mode. The dominance of this channel is supported by the convenience of direct purchasing, wider product visibility, and the availability of competitive pricing through digital platforms.
Farmers increasingly prefer online channels for accessing equipment specifications, product comparisons, and user reviews, which aids decision making. The growth of e commerce infrastructure in emerging economies has further facilitated direct-to-farm deliveries, improving accessibility for small and mid scale aquaculture operators.
This has positioned the online channel as the most influential sales pathway within the fish feed pellet making machine market.
The global market for fish feed pellet making machines exhibited a modest CAGR of nearly 4.3% during the historical period from 2020 to 2025. The market is projected to reach USD 1,190.5 million by the end of 2025 from a valuation of USD 1,006.0 million in 2020.
Growing demand for fish and other seafood is one of the key drivers of the fish feed pellet making machine market. Ever-rising population and their changing dietary habits are resulting in an increased demand for fish and other seafood products. This, in turn, is fueling growth in the global market.
Apart from that, increasing awareness about numerous health benefits associated with the consumption of fish is contributing to growth in this market.
Fish is a rich source of omega-3 fatty acids, which are known to have several health benefits such as reducing the risk of heart diseases & stroke, improving cognitive function, and reducing inflammation. Owing to the above-mentioned factors, the market for fish feed pellet making machines is projected to surge at a robust pace in the next ten years.
Government Support to Expand Fish Farming Worldwide Will Drive Sales
Ongoing expansion of fish production companies and presence of a robust distribution network of these companies are projected to drive sales in the global fish feed pellet making machine market. Surging trade of seafood owing to rising fish consumption in various parts of the globe is another crucial factor that would push sales.
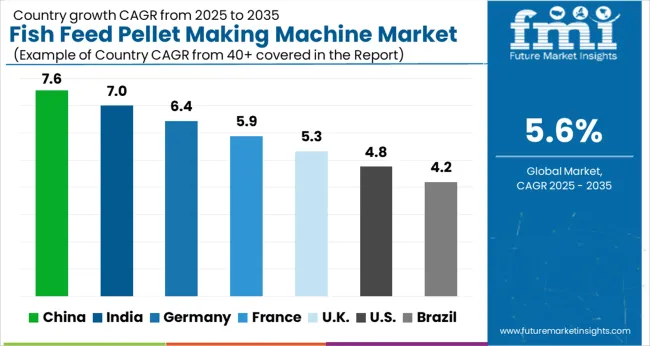
Furthermore, government agencies are set to take numerous initiatives to encourage fishermen to generate more income with high fish farming. In September 2024, for instance, the government of India launched the Pradhan Mantri Matsya Sampada Yojana (PMMSY). It aims to double the income of fishers, as well as fish farmers in the country.
Growing Demand for Aquaculture in the USA to Spur Sales of Floating Fish Feed Pellet Machines
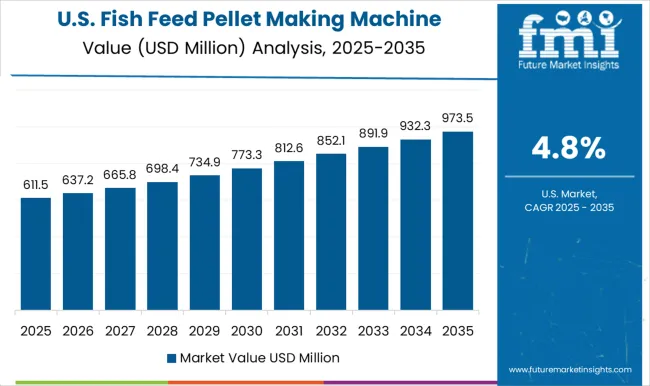
The market for fish feed pellet making machines is developing rapidly in the North America. This growth is attributed to increasing demand for aquaculture across the USA The fish feed pellet making machine industry receives nearly 35.8% of its total income from the USA, finds FMI.
High demand for aquaculture products and surging livestock population in the country are estimated to drive the global market. In addition, growing awareness about quality food items would propel sales in the USA.
High Demand for Seafood in Germany to Fuel the Need for Fish Food Making Machines
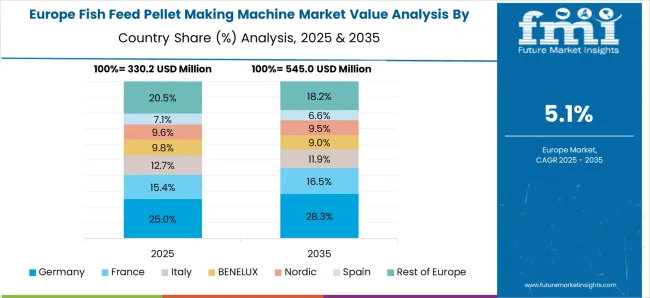
In recent years, demand for fish feed pellet making machines has increased in the Europe. This is mainly due to the growing popularity of aquaculture and the need for more efficient & cost-effective ways to produce fish feed across Germany.
Other key drivers include increasing demand for fish & seafood, expansion of the aquaculture industry, and need for highly efficient fish feed production processes. Aquaculture is set to be a rapidly growing industry in Germany. As per FMI’s report, the country is expected to account for a market share of 25.3%, whereas the United Kingdom would showcase a CAGR of 6.6% over the projection period.
Practice of Contract Farming in India and China to Drive Demand for Fish Food Pellet Machines
The market for fish feed pellet making machines is expanding rapidly in Asia Pacific. Rising practice of contract farming across India and China where farmers are provided with fish seeds and aquafeed required for the growth of aquaculture is likely to bolster sales during the evaluation period.
FMI predicts that India and China are set to witness steady growth at CAGRs of 6.3% and 6.1%, respectively, during the forecast period. Japan, on the other hand, is likely to generate a moderate share of about 4.1% in Asia Pacific.
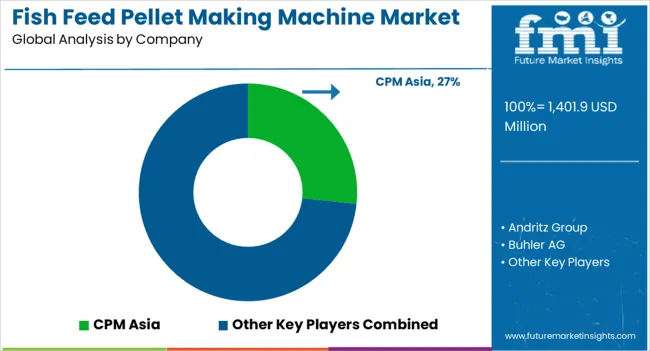
The fish feed pellet making machine market is led by global feed technology and processing equipment manufacturers focused on high-efficiency extrusion, uniform pellet quality, and automation. CPM Asia holds a leading position with advanced feed pellet mills engineered for consistent output, energy efficiency, and adaptability across aquaculture species. Its machines are widely adopted by large-scale feed producers for both floating and sinking fish feed production.
Andritz Group and Bühler AG dominate the industrial segment with complete fish feed production lines that integrate grinding, mixing, extrusion, and drying systems. Andritz specializes in modular feed processing systems offering precise control of pellet size and moisture, while Bühler combines precision engineering and process automation for premium aquafeed production.
Zhengchang Group is a major player in Asia, manufacturing cost-effective feed pellet machines and turnkey aquafeed plants designed for high-volume production. Its machines are recognized for robust performance and low maintenance in commercial aquaculture operations. LIMA Machinery focuses on mid-scale and entry-level pellet making equipment, offering compact, user-friendly systems suited for small and medium fish farms. Darin Machinery provides extrusion-based pellet machines designed for innovation in shape and texture, catering to both aquaculture and ornamental fish feed markets.
| Attribute | Details |
|---|---|
| Estimated Market Size (2025) | USD 1401.9 million |
| Projected Market Valuation (2035) | USD 2417.5 million |
| Value-based CAGR (2025 to 2035) | 5.6% |
| Forecast Period | 2025 to 2035 |
| Historical Data Available for | 2020 to 2025 |
| Market Analysis | Value (USD million) |
| Key Regions Covered | North America; Europe; Asia Pacific; Latin America; The Middle East and Africa |
| Key Countries Covered | USA, Canada, Mexico, Germany, United Kingdom, France, Russia, Brazil, Argentina, Japan, Australia, China, India |
| Key Segments Covered | Type, Application, Sales Channel, Region |
| Key Companies Profiled |
CPM Asia, Andritz Group, Bühler AG, Zhengchang Group, LIMA Machinery, and Darin Machinery. |
| Report Coverage | DROT Analysis, Market Forecast, Company Share Analysis, Market Dynamics and Challenges, Competitive Landscape, and Strategic Growth Initiatives |
The global fish feed pellet making machine market is estimated to be valued at USD 1,401.9 million in 2025.
The market size for the fish feed pellet making machine market is projected to reach USD 2,417.5 million by 2035.
The fish feed pellet making machine market is expected to grow at a 5.6% CAGR between 2025 and 2035.
The key product types in fish feed pellet making machine market are ring die pellet mill and flat die pellet mill.
In terms of application, small-scale aquaculture segment to command 47.3% share in the fish feed pellet making machine market in 2025.


Full Research Suite comprises of:
Market outlook & trends analysis
Interviews & case studies
Strategic recommendations
Vendor profiles & capabilities analysis
5-year forecasts
8 regions and 60+ country-level data splits
Market segment data splits
12 months of continuous data updates
DELIVERED AS:
PDF EXCEL ONLINE
Fish Pond Circulating Water Pump Filter Market Size and Share Forecast Outlook 2025 to 2035
Fish Hydrolysate Market Size and Share Forecast Outlook 2025 to 2035
Fish Protein Isolates Market Size and Share Forecast Outlook 2025 to 2035
Fish Meal Alternative Market Size and Share Forecast Outlook 2025 to 2035
Fish Oil Alternatives Market Size and Share Forecast Outlook 2025 to 2035
Fish Protein Concentrate Market Size and Share Forecast Outlook 2025 to 2035
Fish Fermentation Market Size and Share Forecast Outlook 2025 to 2035
Fishing Reels Market Analysis - Size, Share, and Forecast Outlook 2025 to 2035
Fish Processing Equipment Market Size and Share Forecast Outlook 2025 to 2035
Fish Protein Hydrolysate Market Size and Share Forecast Outlook 2025 to 2035
Fishmeal and Fish Oil Market Analysis - Size, Share, and Forecast Outlook 2025 to 2035
Fish Collagen Market Analysis - Size, Share, and Forecast Outlook 2025 to 2035
Fish Bone Minerals Market Analysis - Size, Share, and Forecast Outlook 2025 to 2035
Fish Peptones Market Size, Growth, and Forecast for 2025 to 2035
Fish Nutrition Market Size, Growth, and Forecast for 2025 to 2035
Fish Oil Market Analysis - Size, Share, and Forecast Outlook 2025 to 2035
Fish Sauce Market Growth - Culinary Trends & Industry Demand 2025 to 2035
Fish Meal Market Analysis – Size, Share, and Forecast Outlook 2025 to 2035
Breaking Down Fish Oil Market Share & Consumer Trends
Analysis and Growth Projections for Fish Gelatin Market

Thank you!
You will receive an email from our Business Development Manager. Please be sure to check your SPAM/JUNK folder too.
Chat With
MaRIA