The global biomass pellets market is forecasted to reach USD 23.5 billion by 2035, recording an absolute increase of USD 11.3 billion over the forecast period. The market is valued at USD 12.3 billion in 2025 and is set to rise at a CAGR of 6.7% during the assessment period. The overall market size is expected to grow by nearly 1.9 times during the same period, supported by rising demand for renewable energy sources worldwide, driving demand for efficient heating and power generation solutions and increasing investments in green energy and decarbonization projects globally. The challenges in raw material sourcing and fluctuating prices of wood-based feedstocks may pose challenges to market expansion.
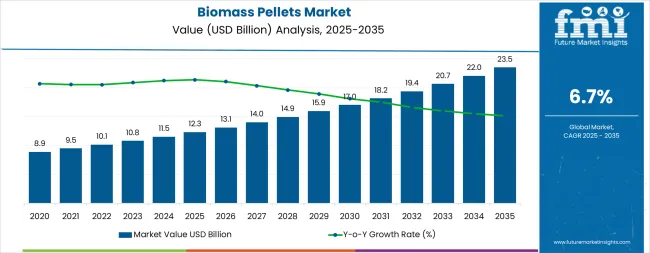
Between 2025 and 2030, the market is projected to expand from USD 12.3 billion to USD 17.4 billion, resulting in a value increase of USD 5.1 billion, which represents 45.1% of the total forecast growth for the decade. This phase of development will be shaped by rising demand for renewable heating solutions and green energy alternatives, regulatory support through carbon trading programs and renewable energy mandates, as well as expanding adoption of biomass co-firing and pellet stoves across residential and industrial applications. Companies are establishing competitive positions through investment in advanced pelletization technologies, sustainable forestry practices, and strategic market expansion across residential, industrial, and utility-scale energy applications.
From 2030 to 2035, the market is forecast to grow from USD 17.4 billion to USD 23.5 billion, adding another USD 6.2 billion, which constitutes 54.9% of the overall ten-year expansion. This period is expected to be characterized by the expansion of alternative feedstock utilization, including agricultural residues and waste-derived biomass, strategic collaborations between producers and end-user industries across power generation and heating sectors, and an enhanced focus on supply chain efficiency and environmental sustainability. The growing focus on carbon neutrality targets and renewable thermal energy will drive demand for advanced, high-performance biomass pellet solutions across diverse residential, commercial, and industrial applications.
| Metric | Value |
|---|---|
| Market Value (2025) | USD 12.3 billion |
| Market Forecast Value (2035) | USD 23.5 billion |
| Forecast CAGR (2025-2035) | 6.7% |
The biomass pellets market is primarily driven by rising demand for renewable energy sources, particularly for heating and power generation. This growth is further fueled by the evolving regulatory environment and an increased focus on sustainability. Regulatory frameworks in regions such as the European Union and East Asia have played a pivotal role by incentivizing the adoption of biomass co-firing and pellet stoves. Carbon trading programs, with their emission caps, have further contributed to market growth by encouraging the use of cleaner energy alternatives.
Players in the market are also focusing on enhancing supply chain efficiency and exploring alternative feedstocks to meet growing demand. Innovations in pellet production technologies and the increasing adoption of biomass-based energy solutions are supporting market expansion. The growth is somewhat restrained by challenges in raw material sourcing and fluctuating prices of wood-based feedstocks, particularly during periods of supply chain disruption affecting key forestry resources.
The market is segmented by product type, end use industry, and region. By product type, the market is divided into wood pellets, agricultural pellets, industrial pellets, and others. Based on end use industry, the market is categorized into energy, residential, commercial, industrial, and agriculture sectors. Regionally, the market is divided into North America, Latin America, Western Europe, South Asia, East Asia, Eastern Europe, and Middle East & Africa.
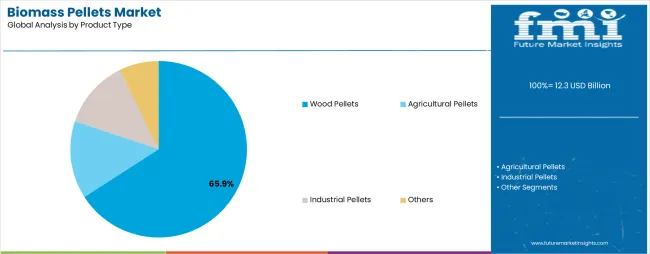
The wood pellets segment represents the dominant force in the market, capturing approximately 65.9% of total market share in 2025. This established product category encompasses compressed wood fiber formulations featuring high energy density, uniform quality standards, and optimized combustion characteristics that enable superior heating performance and reliable operational efficiency. The wood pellets segment's market leadership stems from its exceptional compatibility with residential heating systems, utility-scale co-firing applications, and established supply chain infrastructure across major consuming regions.
The agricultural pellets segment maintains a substantial market share, serving manufacturers and energy users who require alternative feedstock solutions derived from crop residues and agricultural waste streams. These formulations offer reliable performance for decentralized energy applications while providing cost-effective renewable fuel options in agrarian economies with abundant residue availability.
Key technological advantages driving the wood pellets segment include:
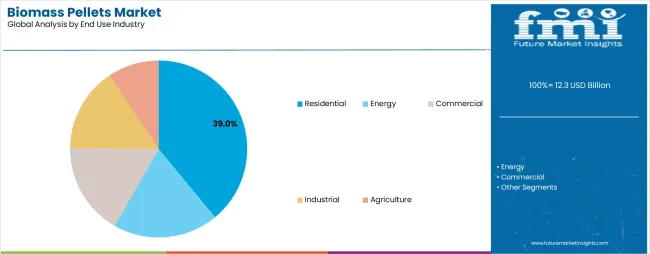
Residential applications dominate the market with approximately 39.0% market share in 2025, reflecting the critical role of pellet heating systems in providing cost-effective, low-emission heating solutions for households across cold-climate regions. The residential segment's market leadership is reinforced by government subsidy programs, replacement of oil-based heating systems, and growing consumer preference for renewable heating alternatives that support energy security and environmental sustainability objectives.
The industrial segment represents the second-largest application category, capturing substantial market share through combined heat and power installations, process heating requirements, and manufacturing sector decarbonization initiatives. This segment benefits from growing demand for renewable thermal energy that meets emission reduction targets while providing reliable, cost-competitive heat for production operations.
The energy segment accounts for significant market share, serving utility-scale power generation and biomass co-firing facilities that require large-volume pellet supplies under long-term contracts. The commercial segment captures market share through institutional heating applications, while agriculture represents a growing portion of the market.
Key market dynamics supporting application growth include:
The market is driven by three concrete demand factors tied to sustainability and energy security outcomes. First, global renewable energy targets and carbon neutrality commitments create increasing demand for biomass-based heating and power generation solutions, with governments worldwide implementing comprehensive incentive programs to accelerate adoption of clean energy alternatives across residential and industrial sectors. Regulatory frameworks including carbon trading programs, renewable energy mandates, and emission reduction targets are driving market development through policy certainty and financial incentives. Second, rising fossil fuel costs and energy supply security concerns drive adoption of locally sourced renewable fuels, particularly in regions with abundant forestry or agricultural residues, reducing dependence on imported oil and gas while supporting domestic economic development. Third, technological advancements in pelletization technologies and combustion systems enable more efficient and cost-effective biomass energy solutions that meet stringent emission standards while improving operational economics and user convenience.
Market restraints include raw material sourcing challenges and feedstock price volatility that can impact production costs and profitability margins, particularly during periods of supply chain disruption or competing demand from other wood product industries. Seasonal availability variations in agricultural residues pose another significant challenge, as consistent year-round supply requires sophisticated logistics infrastructure and storage capabilities, potentially causing supply disruptions and price fluctuations. Infrastructure limitations in developing regions create additional complexity for market expansion, demanding ongoing investment in production facilities, transportation networks, and quality control systems that meet international eco-friendly standards.
Key trends indicate accelerated adoption in East Asian markets, particularly China, Japan, and South Korea, where government renewable energy policies and industrial decarbonization mandates drive comprehensive biomass energy system development. Supply chain consolidation trends toward vertically integrated producers with secure feedstock sources, pelletization facilities, and export capabilities enable more reliable supply to utility-scale customers requiring consistent large-volume deliveries. The market thesis could face disruption if alternative renewable heating technologies such as electric heat pumps or hydrogen-based systems achieve significant cost reductions and policy support that minimize reliance on solid biofuels for heating applications.
| Country | CAGR (2025-2035) |
|---|---|
| China | 6.7% |
| India | 6.8% |
| Germany | 5.8% |
| Brazil | 6.9% |
| United States | 6.1% |
| Canada | 6.5% |
| Japan | 6.6% |
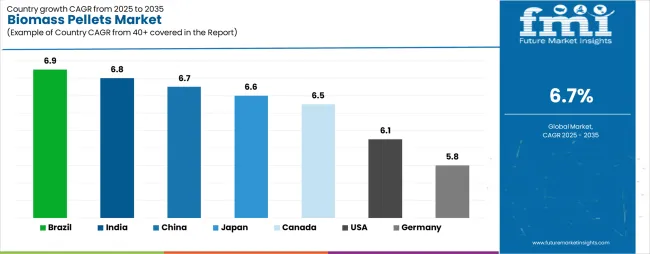
The market is expected to grow steadily from 2025 to 2035, with a balanced regional expansion reflecting energy diversification and renewable transition trends. Brazil leads with a 6.9% CAGR, supported by increasing investments in biomass-based energy projects and ecofriendly fuel initiatives. India follows at 6.8%, benefiting from government-backed renewable energy programs and rising adoption of biomass for rural and industrial heating applications. China records a 6.7% CAGR, driven by policy measures promoting low-carbon fuel alternatives and emission reduction targets. Japan and Canada grow at 6.6% and 6.5% respectively, reflecting consistent bioenergy utilization in power generation. The United States maintains a 6.1% CAGR due to the growing use of biomass in co-firing applications and heating systems. Germany expands at 5.8%, influenced by strong environmental regulations and continuous biomass integration in its renewable energy mix across residential and industrial segments.
The report covers an in-depth analysis of 40+ countries, top-performing countries are highlighted below.
China demonstrates the strongest growth potential in the market with a CAGR of 6.7% through 2035. The country's leadership position stems from unmatched agricultural and forestry residue volumes, government-backed rural district heating programs, and industrial decarbonization initiatives. Growth is concentrated in major agricultural and industrial regions, including Hebei, Shandong, Jiangsu, and central provinces, where industrial facilities and rural communities are implementing biomass heating systems for coal replacement and emission reduction. Distribution channels through state-owned enterprises and provincial governments expand deployment across industrial facilities and rural heating applications. The country's 14th Five-Year Plan provides policy support for bioenergy development, including biomass pellet production capacity expansion.
Key market factors:
In Bihar, West Bengal, Odisha, and other agricultural regions, the adoption of biomass pellet systems is accelerating across industrial facilities and power plants, driven by agricultural residue availability and government co-firing mandates. The market demonstrates strong growth momentum with a CAGR of 6.8% through 2035, linked to comprehensive rural energy programs and increasing focus on agricultural waste utilization solutions. Indian manufacturers are implementing decentralized pellet production facilities and agricultural residue collection systems to enhance feedstock availability while meeting growing demand for industrial heating and power generation applications. The country's MNRE programs create constant demand for biomass co-firing in thermal power plants, while World Bank-backed rural energy initiatives drive adoption of decentralized pellet production.
Germany's advanced renewable heating infrastructure demonstrates sophisticated implementation of biomass pellet systems, with documented case studies showing significant efficiency improvements in residential applications through optimized pellet heating solutions. The country's manufacturing infrastructure in major industrial centers, including North Rhine-Westphalia, Bavaria, Baden-Württemberg, and Lower Saxony, showcases integration of pellet heating technologies with existing residential building systems, leveraging expertise in renewable energy transition and energy efficiency standards. German consumers prioritize quality certifications and environmental compliance, creating demand for high-performance pellet products that support green initiatives and renewable heating mandates. The market maintains steady growth through focus on residential boiler conversions and subsidy programs, with a CAGR of 5.8% through 2035.
Key development areas:
Brazil's market expansion is driven by diverse feedstock availability, including eucalyptus residues in São Paulo, sugarcane bagasse in Minas Gerais, and sawdust across southern states, supporting cost-effective pellet production in agro-industrial hubs. The country demonstrates promising growth potential with a CAGR of 6.9% through 2035, supported by PNE 2050 bioenergy strategy and regional industrial development initiatives. Brazilian producers face implementation challenges related to international certification requirements and export infrastructure development, requiring technology transfer approaches and sustainability certification support. Growing international demand from EU and Asian markets and domestic institutional adoption create compelling business cases for biomass pellet production capacity expansion, particularly in regions with abundant agricultural and forestry residues.
Market characteristics:
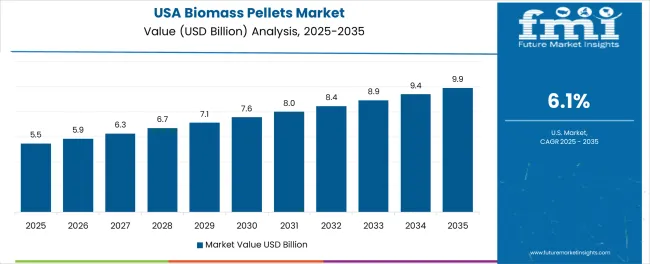
The USA market leads in advanced pellet production based on integration with residential heating systems and utility-scale co-firing applications for enhanced energy security. The country shows solid potential with a CAGR of 6.1% through 2035, driven by state-level clean energy incentive programs and federal bioenergy funding initiatives across major production regions, including the Northeast, Pacific Northwest, Midwest, and Southeast. American manufacturers are adopting advanced pelletization technologies for quality optimization and green certification, particularly in states with renewable heating support programs and industrial decarbonization mandates requiring renewable thermal energy. Technology deployment channels through established distribution networks and direct utility relationships expand coverage across residential heating and power generation facilities.
Leading market segments:
In British Columbia, Alberta, Quebec, and Northern Territories, pellet production facilities are implementing biomass processing systems to enhance export competitiveness and domestic heating adoption, with documented case studies showing eco-friendly forestry management practices supporting long-term feedstock availability. The market shows strong growth potential with a CAGR of 6.5% through 2035, linked to robust export infrastructure development, provincial renewable heat mandates, and off-grid area diesel replacement programs. Canadian producers are adopting comprehensive green certification and supply chain traceability systems to enhance international market access while maintaining environmental standards demanded by European and Asian importers. The country’s Sustainable Biomass Program creates constant demand for certification compliance solutions that integrate with existing forestry management systems.
Market development factors:
Japan's market demonstrates sophisticated implementation focused on utility-scale power generation and quality excellence optimization, with documented integration of imported pellet supplies achieving reliable base-load electricity generation under Feed-in Tariff policies. The country maintains strong growth momentum with a CAGR of 6.6% through 2035, driven by independent power producers' focus on sustainability compliance and continuous supply reliability that align with METI regulatory requirements applied to renewable energy operations. Major import facilities, including ports in Tokyo, Osaka, Fukuoka, and Kyushu, showcase advanced quality verification systems where imported pellets integrate seamlessly with existing power generation infrastructure and comprehensive sustainability documentation programs.
Key market characteristics:
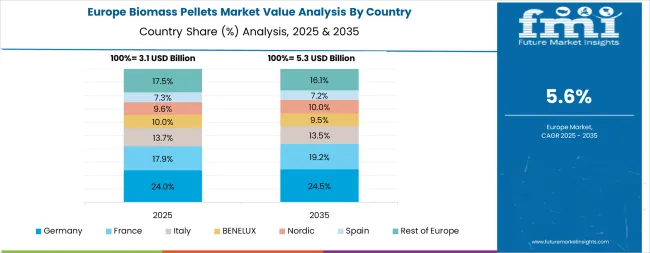
The biomass pellets market in Western Europe is projected to grow from USD 4.1 billion in 2025 to USD 7.4 billion by 2035, registering a CAGR of 6.0% over the forecast period. Germany is expected to maintain its leadership position with a 31.2% market share in 2025, declining slightly to 30.5% by 2035, supported by its extensive residential pellet heating infrastructure and widespread boiler installations across major regions.
The United Kingdom follows with a 23.2% share in 2025, projected to reach 23.0% by 2035, driven by comprehensive utility-scale biomass power generation through Drax Power Station and growing residential heating adoption. France holds a 21.2% share in 2025, expected to maintain 21.6% by 2035 through ongoing Multiannual Energy Plan implementation and MaPrimeRénov' subsidy programs. Italy commands a 12.7% share, while Spain accounts for 7.3% in 2025. The Rest of Western Europe region is anticipated to gain momentum, expanding its collective share from 4.4% to 5.0% by 2035, attributed to increasing biomass pellet adoption in Nordic countries and emerging renewable heating programs across Austria, Netherlands, and other smaller European nations.
The Japanese market demonstrates a mature and import-dependent landscape, characterized by sophisticated integration of utility-scale biomass power generation with strict sustainability certification requirements overseen by METI. Japan's focus on renewable energy diversification and supply security drives demand for high-quality pellet imports that meet stringent traceability and environmental standards aligned with Feed-in Tariff policy requirements. The market benefits from strong partnerships between international suppliers from Canada, United States, and Southeast Asia, and domestic power producers including major independent power producers operating dedicated and co-firing facilities under long-term offtake contracts. Industrial centers in Tokyo, Osaka, and Fukuoka showcase advanced quality control implementations where imported pellets undergo comprehensive testing and verification programs to ensure compliance with Japanese sustainability regulations and performance standards.
The South Korean market is characterized by strong reliance on imported supplies, with international producers from North America and Southeast Asia maintaining significant positions through long-term contracts with utilities including KEPCO and independent power producers. The market is demonstrating growing focus on sustainability certification and supply chain transparency, as Korean regulators increasingly demand comprehensive traceability documentation aligned with the Renewable Energy 3020 target framework. Domestic production capacity remains limited but is gradually expanding in coastal regions including Incheon and Busan, offering specialized services including Korean market customization and technical support programs for institutional heating applications. The competitive landscape shows increasing collaboration between international pellet suppliers and Korean energy companies, creating hybrid procurement models that combine global supply networks with local quality assurance and regulatory compliance systems.
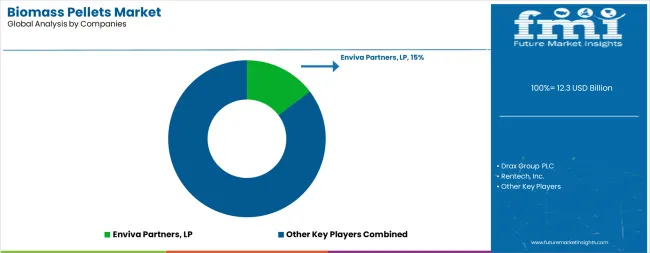
The market features approximately 20-25 meaningful players with moderate to high concentration, where the top five companies control roughly 40-48% of global market share through established production facilities, vertically integrated supply chains, and long-term offtake contracts with major utilities. Competition centers on supply reliability, sustainability certification, and feedstock security rather than price competition alone.
Market leaders include Enviva Inc., Drax Group plc, and Pinnacle Renewable Energy, which maintain competitive advantages through vertically integrated operations spanning forestry management, pelletization facilities, and export logistics infrastructure, creating high switching costs for utility customers requiring consistent large-volume supply. These companies leverage sustainability certifications including ENplus, SBP, and FSC credentials alongside comprehensive supply chain traceability to defend market positions while expanding into new geographic markets.
Challengers encompass Fram Renewable Fuels and Graanul Invest, which compete through specialized regional production capabilities and strong relationships with European and Asian utilities. Technology specialists focus on specific feedstock types or vertical applications, offering differentiated capabilities in agricultural residue pelletization, quality optimization, and customized blending solutions.
Regional players and emerging producers create competitive pressure through cost-effective production and local market knowledge, particularly in high-growth markets including China, India, and Brazil, where proximity to feedstock sources and end customers provides advantages in logistics costs and supply chain flexibility. Market dynamics favor companies that combine sustainable forestry practices, advanced pelletization technologies, and comprehensive export infrastructure addressing the complete supply chain from feedstock sourcing through final delivery to utility-scale and residential customers.
Biomass pellets represent renewable solid fuel solutions that enable energy users to achieve 70-85% carbon emission reductions compared to fossil fuel heating, delivering superior energy security and cost-competitive renewable heating with 3.5-4.5 MWh/ton energy content in demanding applications. With the market projected to grow from USD 12.3 billion in 2025 to USD 23.5 billion by 2035 at a 6.7% CAGR, these renewable fuel systems offer compelling advantages - locally sourced feedstock availability, compatibility with existing heating infrastructure, and environmental sustainability - making them essential for residential heating applications (39.0% market share), industrial process heat (26.0% share), and utility-scale power generation seeking alternatives to fossil fuels that compromise energy security through import dependency and carbon emissions. Scaling market adoption and green production requires coordinated action across renewable energy policy, forestry management standards, pellet producers, end-user industries, and sustainable finance capital.
How Governments Could Spur Local Production and Adoption?
How Industry Bodies Could Support Market Development?
How OEMs and Technology Players Could Strengthen the Ecosystem?
How Suppliers Could Navigate the Shift?
How Investors and Financial Enablers Could Unlock Value?
| Item | Value |
|---|---|
| Quantitative Units | USD 12.3 billion |
| Product Type | Wood Pellets, Agricultural Pellets, Industrial Pellets, and Others |
| End Use Industry | Energy, Residential, Commercial, Industrial, and Agriculture |
| Regions Covered | North America, Latin America, Western Europe, South Asia, East Asia, Eastern Europe, and Middle East & Africa |
| Country Covered | United States, Canada, Germany, United Kingdom, France, Japan, South Korea, China, India, Brazil, and 40+ countries |
| Key Companies Profiled | Enviva Partners, LP; Drax Group PLC; Rentech, Inc.; Pinnacle Renewable Energy Inc.; Green Circle Bio Energy, LLC; Zilkha Biomass Energy; The Westervelt Company; Biopower Ltd; Babcock & Wilcox Enterprises; Sumitomo Corporation |
| Additional Attributes | Dollar sales by product type and end use industry categories, regional adoption trends across North America, Western Europe, and East Asia, competitive landscape with biomass producers and technology integrators, production facility requirements and specifications, integration with renewable energy initiatives and heating systems, innovations in pelletization technology and feedstock processing, and development of eco-friendly forestry practices with certification and traceability capabilities. |
The global biomass pellets market is estimated to be valued at USD 12.3 billion in 2025.
The market size for the biomass pellets market is projected to reach USD 23.5 billion by 2035.
The biomass pellets market is expected to grow at a 6.7% CAGR between 2025 and 2035.
The key product types in biomass pellets market are wood pellets, agricultural pellets, industrial pellets and others.
In terms of end use industry, residential segment to command 39.0% share in the biomass pellets market in 2025.


Full Research Suite comprises of:
Market outlook & trends analysis
Interviews & case studies
Strategic recommendations
Vendor profiles & capabilities analysis
5-year forecasts
8 regions and 60+ country-level data splits
Market segment data splits
12 months of continuous data updates
DELIVERED AS:
PDF EXCEL ONLINE
Europe Biomass Pellets Market Analysis & Forecast for 2025 to 2035
Demand for Biomass Pellets in EU Size and Share Forecast Outlook 2025 to 2035
Biomass Hot Air Generator Furnace Market Size and Share Forecast Outlook 2025 to 2035
Biomass Gasification Market Size and Share Forecast Outlook 2025 to 2035
Biomass Boiler Market Size and Share Forecast Outlook 2025 to 2035
Woody Biomass Boiler Market Size and Share Forecast Outlook 2025 to 2035
Lignocellulosic Biomass Market Analysis - Size, Share, and Forecast Outlook for 2025 to 2035
Wood Pellets Market Size and Share Forecast Outlook 2025 to 2035
Snack Pellets Market Analysis - Size, Share, and Forecast Outlook 2025 to 2035
Iron Ore Pellets Market Growth - Trends & Forecast 2025 to 2035
USA Snack Pellets Market Analysis – Demand, Growth & Forecast 2025-2035
Black & Wood Pellets Industry Analysis in Europe Analysis - Size, Share, & Forecast Outlook 2025 to 2035
Demand for Black & Wood Pellets in Europe Size and Share Forecast Outlook 2025 to 2035

Thank you!
You will receive an email from our Business Development Manager. Please be sure to check your SPAM/JUNK folder too.
Chat With
MaRIA