The global snack pellets market is projected to grow from USD 1.5 billion in 2025 to USD 2.3 billion by 2035, registering a CAGR of 4.3%.
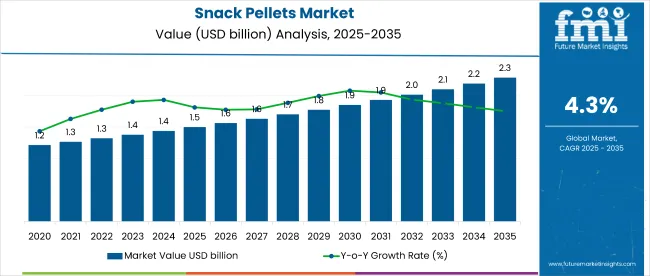
| Metric | Value |
|---|---|
| Industry Size (2025E) | USD 1.5 billion |
| Industry Value (2035F) | USD 2.3 billion |
| CAGR (2025 to 2035) | 4.3% |
Market growth is driven by rising demand for convenient, ready-to-eat snacks and the increasing focus on healthier options such as multigrain and vegetable-based pellets. Innovations in flavoring, shapes, and textures are expanding consumer choices, while advancements in extrusion and processing technologies are enabling manufacturers to enhance product quality and diversify portfolios, thereby strengthening market presence globally.
Within the snack food market, snack pellets command an estimated 12% share due to their use as semi-finished products for ready-to-fry snacks. In the extruded food products market, they hold 15%, reflecting their versatility in manufacturing. Their contribution to the processed food market is around 3% as they form a small yet growing category of processed snack bases. However, within the expansive global food & beverage market, snack pellets hold a minimal share below 0.5%, given the broader scale of beverages, staples, and other food categories dominating overall market value.
Government regulations impacting the market focus on food safety, quality standards, and labeling norms. The Food Safety and Standards Act, 2006 in India and global standards like the FDA’s FSMA in the USA ensure compliance with hygiene standards, permissible additives, and transparent labeling. These regulatory frameworks drive manufacturers to adopt advanced processing technologies, maintain high-quality standards, and innovate with healthier, fortified, and allergen-free snack pellet options, ensuring consumer safety and enhancing brand trust in competitive markets.
Japan is projected to be the fastest-growing market, expected to expand at a CAGR of 5.1% from 2025 to 2035. Twin-screw extruder will lead the technique segment with a 58% share, while hot air expansion will dominate the processing segment with a 55% share. The USA and UK markets are also expected to grow steadily at CAGRs of 4.8% and 4.6%, respectively.
The market is segmented by ingredient, form, technique, processing, distribution channel, and region. By ingredient, the market is divided into potato, corn, rice, tapioca, mixed grains, and others (mixed grains blends, chickpea flour, lentil flour, vegetable-based flours). In terms of form, the market is segmented into 3D/double layer, pasta shape, chips, micro-pellets, and others (star shape, rings and curls, hexagonal, pellets for co-extruded snacks). Based on technique, the market is bifurcated into single-screw extruder and twin-screw extruder.
By processing, the market is divided into hot air expansion and hot oil frying. In terms of distribution channel, the market is categorized into food processing companies, food service and catering companies, and retail sales (hypermarkets/supermarkets, convenience stores, specialty retail stores, wholesale stores, grocery retailers, and online retailer stores). Regionally, the market is segmented into North America, Latin America, Western Europe, Eastern Europe, East Asia, South Asia & Pacific, and the Middle East & Africa.
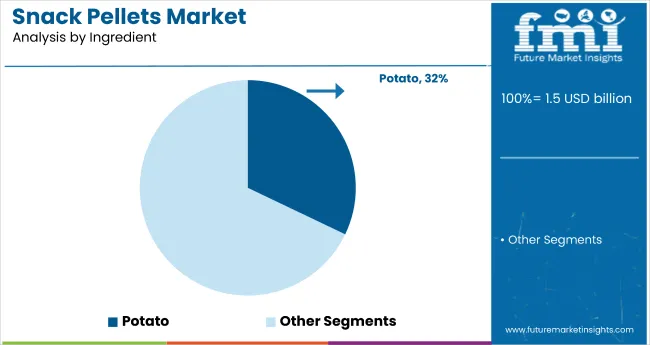
Potato is projected to capture a 32.1% market share by 2025, driven by its familiar taste, superior crunch, and versatility, making it popular across global snack pellet applications.
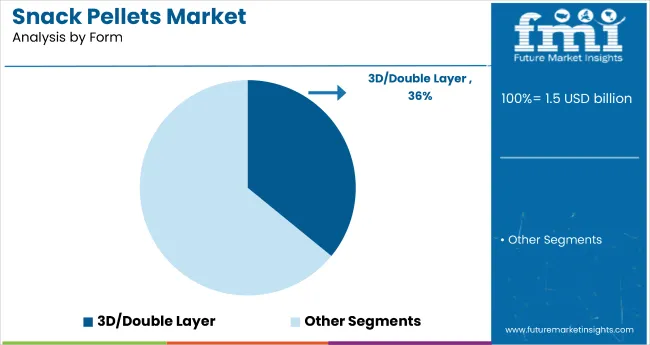
3D/double-layer formats are projected to account for 35.9% of the market share in 2025, driven by their unique shapes and multi-layer textures that appeal to children and young consumers globally.
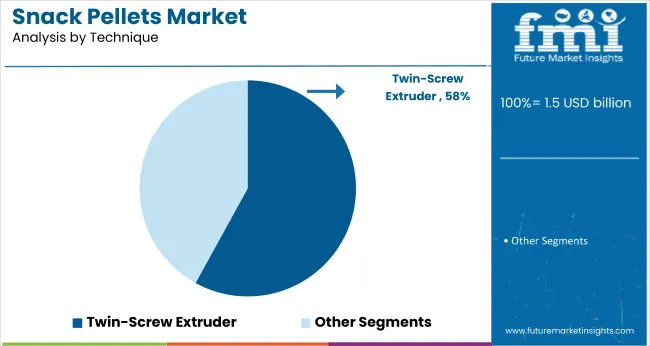
Twin-screw extruders are expected to dominate with a 58% market share by 2025, owing to better control over texture, density, and product customization, ensuring consistent premium output.
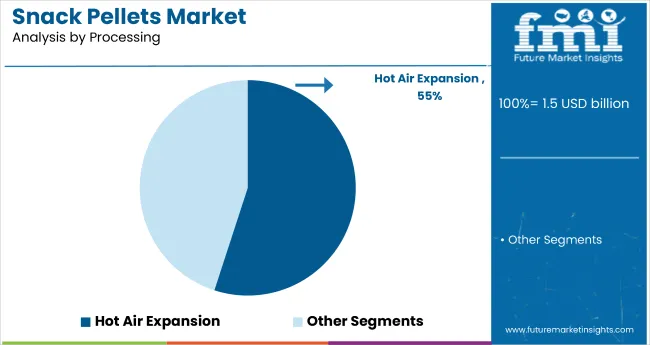
Hot air expansion is projected to lead with a 55% market share by 2025, offering healthier low-fat snacks with uniform puffing, aligned with clean-label trends and quality consistency requirements.
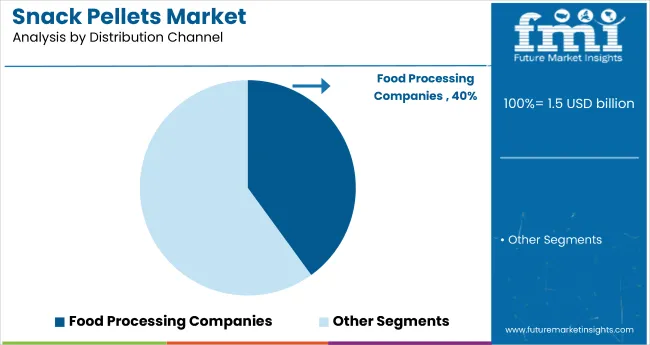
Food processing companies are projected to dominate the distribution channel segment, with a 40% share of the global market by 2025.
The global snack pellets market is experiencing stable growth, fueled by the rising consumer demand for ready-to-fry and customizable snack options across retail and food service sectors. Snack pellets serve as semi-finished products that offer convenience, longer shelf life, and flexibility in final preparation methods, making them increasingly attractive to manufacturers and consumers alike.
Recent Trends in the Snack Pellets Market
Challenges in the Snack Pellets Market
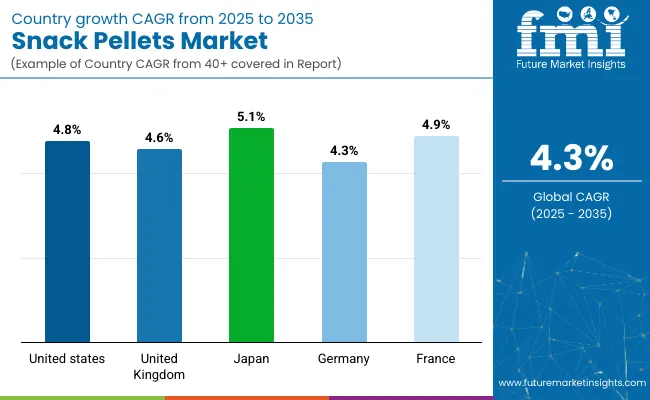
Japan momentum in the market is driven by health-conscious consumer trends, demand for gluten-free snack bases, and automation in extruded snack production lines. Germany and France sustain stable demand supported by EU clean-label mandates, innovation in functional snacking, and investments in food-tech modernization. In contrast, developed economies such as the USA (4.8% CAGR), UK (4.6%), and Japan (5.1%) are expected to expand at a steady 0.90-1.00x of the global growth rate.
Japan leads in advanced food manufacturing ecosystems where extrusion and hot air expansion are integral to clean-label, plant-based, and reduced-fat snacking. Germany and France capitalize on high demand for organic and functional snack formats, with EU directives accelerating dietary diversification and ingredient innovation. The USA market focuses on scalable snack pellet processing and private label expansion, while the UK emphasizes low-fat, clean-label pellets across food service and retail. As the market adds over USD 800 million globally by 2035, both automation-driven and wellness-focused regions will shape long-term demand.
The report covers an in-depth analysis of 40+ countries; five top-performing OECD countries are highlighted below.
The Japan snack pellets revenue is growing at a CAGR of 5.1% from 2025 to 2035. Growth is driven by demand for low-oil and gluten-free snacks compatible with Japanese dietary trends.
The sales of snack pellets in Germany are expected to expand at 4.3% CAGR during the forecast period, slightly below the global average but driven by strong EU food safety and health labeling requirements.
The French snack pellets market is projected to grow at a 4.9% CAGR during the forecast period, aligned with EU-driven clean food trends and sustainable packaging mandates. Demand is led by innovations in organic pellet formats and premium snack formulations suited for artisanal and gourmet positioning.
The USA snack pellets revenue is projected to grow at 4.8% CAGR from 2025 to 2035, translating to 0.94x the global rate. Demand is driven by large-scale food processors investing in ready-to-fry pellet contracts, innovation in 3D layered formats, and customized snack bases for private labels.
The UK snack pellets market is projected to grow at a CAGR of 4.6% from 2025 to 2035, representing the slowest growth among the top OECD nations, at 0.90 times the global pace. Growth is supported by wellness-focused snacking trends and regulatory preference for non-fried snack alternatives in school meals and retail.
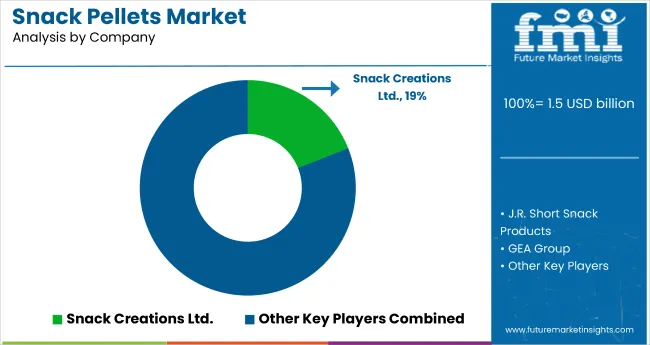
The market is moderately fragmented, with notable players like Snack Creations Ltd., J.R. Short Snack Products, GEA Group, LC America, Inc., and Palmex Evans holding a significant presence across global production and processing segments. These companies offer advanced pellet extrusion technologies, innovative ingredient formulations, and scalable processing solutions tailored for food manufacturers across regions. Snack Creations Ltd. specializes in customized pellet shapes and textures using advanced extrusion lines, while J.R. Short Snack Products is known for its ready-to-fry pellet base portfolio, serving major snack brands globally.
GEA Group delivers end-to-end processing systems with integrated twin-screw extrusion and hot air drying technologies. LC America, Inc. focuses on modular processing lines for flexibility in shape and ingredient configurations. Palmex Evans leads in emerging markets with compact, energy-efficient snack pellet systems. Other prominent players such as Leng-d'Or, Nature's Fresh Pellets, Bach Snacks SAL, Crunchy Food FZE, Quality Pellets, Almounajed Food Industries, and Noble contribute by offering regionalized, specialty, or clean-label snack pellet solutions catering to niche dietary needs and innovative applications.
Recent Snack Pellets Industry News
In August 2023, Golden Wonder introduced Mega Rings in two Flavors-Mega Onion Rings and Mega Spicy Rings-as part of their £1 price-marked pack range. This initiative aims to offer consumers great value while ensuring retailers maintain healthy margins, highlighting the significance of the USD 1 price point.
| Report Attributes | Details |
|---|---|
| Market Size (2025) | USD 1.5 billion |
| Projected Market Size (2035) | USD 2.3 billion |
| CAGR (2025 to 2035) | 4.3% |
| Base Year for Estimation | 2024 |
| Historical Period | 2020 to 2024 |
| Projections Period | 2025 to 2035 |
| Report Parameter | USD billion for value / volume in metric tons |
| Ingredient Base Analyzed | Potato, Corn, Rice, Tapioca, Mixed Grains, and Others (Mixed grains blends, Chickpea flour, Lentil flour, Vegetable-based flours) |
| Form Analyzed | 3D/Double Layer, Pasta Shape, Chips, Micro-pellets, and Others (Star shape, Rings and curls, Hexagonal, Pellets for co-extruded snacks) |
| Technique Analyzed | Single-Screw Extruder and Twin-Screw Extruder |
| Processing Method Analyzed | Hot Air Expansion and Hot Oil Frying |
| Distribution Channel Analyzed | Food Processing Companies, Food Service and Catering Companies, and Retail Sales (Hypermarkets/Supermarkets, Convenience Stores, Specialty Retail Stores, Wholesale Stores, Grocery Retailers, Online Retailer Stores) |
| Region Analyzed | North America, Latin America, Western Europe, Eastern Europe, Balkans & Baltic, Russia & Belarus, Central Asia, East Asia, South Asia & Pacific, Middle East & Africa |
| Countries Covered | United States, United Kingdom, Germany, France, Japan, China, India, Brazil, South Korea, Australia |
| Key Players Influencing the Market | Snack Creations Ltd., J.R. Short Snack Products, GEA Group, LC America, Inc., Palmex Evans, Leng-d'Or, Nature's Fresh Pellets, Bach Snacks SAL, Crunchy Food FZE, Quality Pellets, Almounajed Food Industries, and Noble |
| Additional Attributes | Dollar sales by ingredient type, share by technique and processing, regional demand growth, policy influence, automation trends in extrusion, competitive benchmarking |
As per ingredient, the industry has been categorized into Potato, Corn, Rice, Tapioca, Mixed Grains, and Others.
As per form, the industry has been categorized into 3D/Double Layer, Pasta Shape, Chips, Micro-Pellets, and Others.
This segment is further categorized into Single-screw Extruder and Twin-screw Extruder.
This segment is further categorized into Hot Air Expansion, and Hot Oil Frying.
As per distribution channel, the industry has been categorized into Food Processing Companies, Food Service and Catering Companies, and Retail Sales (Hypermarkets/ Supermarkets, Convenience Stores, Specialty Retail Stores, Wholesale Stores, Grocery Retailers, and Online Retailers Stores).
Industry analysis has been carried out in key countries of North America, Latin America, Europe, East Asia, South Asia, Oceania, and the Middle East & Africa.
The market is valued at USD 1.5 billion in 2025.
The market is forecasted to reach USD 2.3 billion by 2035, reflecting a CAGR of 4.3%.
Twin-screw extruders will lead the technique segment, accounting for 58% of the global market share in 2025.
Hot air expansion will dominate the processing segment with a 55% share in 2025.
Japan is projected to grow at the fastest rate, with a CAGR of 5.1% from 2025 to 2035.


Full Research Suite comprises of:
Market outlook & trends analysis
Interviews & case studies
Strategic recommendations
Vendor profiles & capabilities analysis
5-year forecasts
8 regions and 60+ country-level data splits
Market segment data splits
12 months of continuous data updates
DELIVERED AS:
PDF EXCEL ONLINE
USA Snack Pellets Market Analysis – Demand, Growth & Forecast 2025-2035
Snack Pellet Equipment Market Size and Share Forecast Outlook 2025 to 2035
Snack Packaging Machine Market Size and Share Forecast Outlook 2025 to 2035
Assessing Snack Food Packaging Market Share & Industry Trends
Snack Bars Market – Growth, Demand & Functional Nutrition Trends
Snack Food Packaging Market Analysis by Flexible and Rigid Packaging Through 2035
Snack Bag Market Trends & Industry Growth Forecast 2024-2034
CBD Snacks Market Size and Share Forecast Outlook 2025 to 2035
Kid Snacks Market Analysis by Source, Type, and Distribution Channel Through 2035
Pet Snacks and Treats Market Analysis by Product, Pet Type, Distribution Channel, and Region Through 2035
Meat Snacks Market Size and Share Forecast Outlook 2025 to 2035
Baby Snacks Market Analysis - Size, Share, & Forecast Outlook 2025 to 2035
Dairy Snacks Market Growth - Consumer Preferences & Industry Trends 2025 to 2035
Competitive Breakdown of Fruit Snacks Suppliers
Fruit Snacks Market Analysis by Product Type, Nature, Flavour Type, Distribution Channel Type, and Processing Type Through 2035
Savory Snack Market Size and Share Forecast Outlook 2025 to 2035
Frozen Snacks Market Analysis - Size, Share, and Forecast Outlook for 2025 to 2035
Healthy Snacks Market Size and Share Forecast Outlook 2025 to 2035
Organic Snack Food Market Size and Share Forecast Outlook 2025 to 2035
Protein Snacks Market Growth - Demand, Trends & Industry Forecast 2025 to 2035

Thank you!
You will receive an email from our Business Development Manager. Please be sure to check your SPAM/JUNK folder too.
Chat With
MaRIA