CBD Snacks Market Outlook (2022-2032)

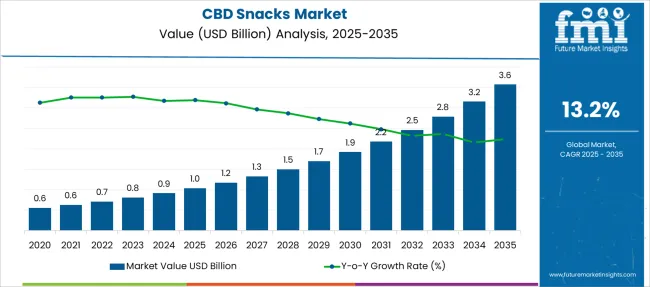
[250 Pages Report] The global CBD Snacks market is expected to reach a market valuation of USD 712.5 Million by the year 2022, accelerating with a CAGR of 13.2% by 2022 to 2032. North America dominated the CBD snack market, accounting for more than 30% of revenue in 2021.

Attribute Details
CBD Snacks Market Size (2022E) USD 712.5 Million
CBD Snacks Market Projected Size (2032F) USD 2.5 Billion
Value CAGR (2022 to 2032) 13.2%
Top 3 Countries Marketing Share 33.2%

CBD Snacks market sales are likely to account for a part of the demand in the global food processing market in 2022.

FMI analysis indicates that the implementation of stringent regulations associated with the product, as well as the high cost of medical cannabis-based oil extract-infused food products, are expected to stymie the growth of the CBD-infused snacks market. Concerns about side effects such as allergies, headaches, and substance abuse are expected to challenge the CBD-infused snacks market during the forecasted period.

Don't pay for what you don't need

Customize your report by selecting specific countries or regions and save 30%!

How The Market Progressed Till June 2022?

Market Statistics Details
H1,2021 (A) 13.1%
H1,2022 Projected (P) 13.2%
H1,2022 Outlook (O) 14.5%
BPS Change : H1,2022 (O) - H1,2022 (P) (+) 132 ↑
BPS Change : H1,2022 (O) - H1,2021 (A) (+) 145.2 ↑

In the first half of 2021, the global market for CBD Snacks Market grew by 13.1 percent. Though not equally distributed throughout all regions, this growth is stronger in developing markets, where it reached 14.5%. Thus, during H1 2022, there will be a 145.2 BPS point difference between predicted and projected growth.

CBD snacks are a recent development in the CBD industry. CBD snacks are made with CBD oil, which is known for its therapeutic properties. People who use CBD oil to treat medical conditions say that it helps them feel better. CBD snacks are a great way to get the benefits of CBD oil without having to take a pill or swallow a liquid.

In recent years, CBD snacks have become increasingly popular. However, there are currently no regulations in place governing their production and sale. This has led to a wide variety of CBD snacks on the market, with some being of poor quality and others containing high levels of THC.

The lack of regulations also means that there is no standard for how much CBD is present in these snacks. As a result, it can be difficult for consumers to know how much CBD they are consuming and whether or not it will be effective.

It is therefore important that the government introduces regulations for CBD snacks. This would ensure that all products meet a minimum standard and that consumers can trust that they are getting the dose of CBD they expect.

How Does CBD Snacks Market Historic and Future Outlook Compare?

Cannabis-infused snacks are food products that contain extracts of marijuana. Candies and baked foods, for example, fall into this category of food products. THC (tetrahydra cannabinol) and CBD (cannabidiol) are used in these edibles because THC is psychoactive. Cannabis is a plant that belongs to the cannabaceae family. It is also known as hemp or hemp fiber. The oil can be used as a therapeutic product as well as a psychoactive drug.

Consumers' increasing preference for natural organic products over pharmaceuticals is one of the major factors driving the growth of the CBD-infused snacks market. The growing demand for cannabidiol (CBD) for the production of snacks and wellness products due to its healing properties is driving the CBD-infused snacks market growth.

The CBD-infused snacks market is being driven by the growing popularity of CBD-infused snacks due to their therapeutic properties, as well as changes in consumer food habits. Furthermore, a growing number of social media influencers promoting the product's benefits, mergers and acquisitions among key players, R&D activities, a change in lifestyle, and an increase in disposable income all have a positive impact on the CBD-infused snacks market.

CBD Snacks Market

How are CBD-infused products driving the market growth?

CBD demand is surging at an incredible rate, with growing applications in a diverse range of interconnected services and industries. CBD, which has been lauded by numerous experts for its extensive health benefits while avoiding the psychoactive effects of THC, is gaining widespread market acceptance around the world.

CBD markets are estimated to grow by 50% per year between 2021 and 22. Adoption rates are gradually increasing and will continue to rise as more people become aware of the issue. Each year, new medicinal and therapeutic uses are discovered as commercial manufacturing continues to produce an expanding variety of food products infused with CBD.
Nandini Roy Choudhury

Principal Consultant

Talk to Analyst

Find your sweet spots for generating winning opportunities in this market.

What is the Impact of COVID-19 on the CBD Snacks Market?

The CBD Snacks market is rapidly approaching pre-pandemic levels, and a healthy growth rate is expected over the forecast period, owing to the economic recovery in the majority of developing countries.

However, unprecedented conditions as a result of the expected third and subsequent waves are creating a bleak outlook. The purpose of this research is to evaluate various scenarios of COVID-19's impact on the future of the CBD Snacks market from 2022 to 2032. As a result of the current COVID-19 pandemic, people are gravitating toward healthier and more nutritious foods.

Country-wise Insights

What is the market outlook in the U.S?

North America dominated the CBD snack market, accounting for more than 30% of revenue in 2021. The United States of America is positively contributing to market revenue. The presence of health-conscious citizens, as well as the increasing consumption of CBD snacks, are driving the growth of this market. Furthermore, the presence of major producers, as well as the approval of the U.S.

What is the market outlook in China?

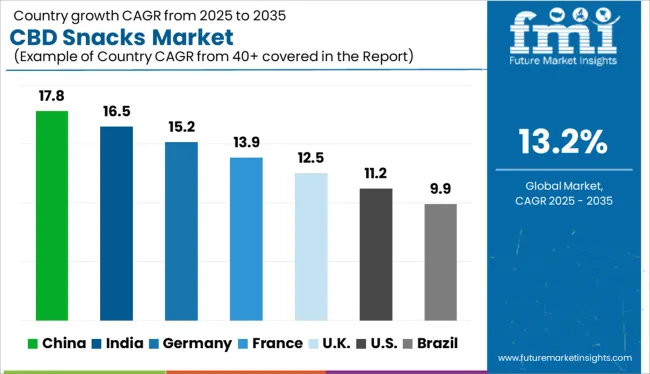
Asia Pacific held the second-largest share in 2021 and is expected to grow at the fastest CAGR between 2022 and 2032. China is making a positive contribution to market revenue. China is one of the world's largest cultivators.

Get the data you need at a Fraction of the cost

Personalize your report by choosing insights you need
and save 40%!

Category-wise Insights                 

What is the market outlook by flavor?

In 2021, the berry segment had a market share of more than 35%. The natural berry flavor is widely used in the industry for preserves, jams, and cakes, and it also acts as an anti-oxidant. Consumer preference, rising nutrition consciousness, and changes in taste are all factors driving the growth of this segment.

What is the market outlook by offline distribution channels?

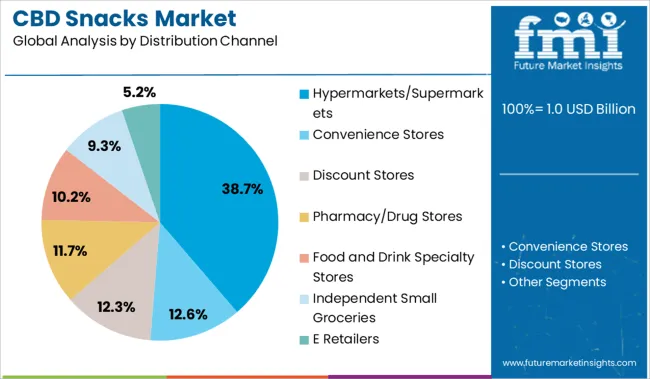
In 2020, the offline distribution channel had a market share of more than 70%. CBD snack manufacturers use traditional retail channels such as word-of-mouth promotion, advertising, and marketing. Offline channels are expected to maintain their lead because they offer buyers the option of physical product verification at the time of purchase.

What is the market outlook by online distribution channels?

From 2022 to 2032, the fastest CAGR is expected to be 17% for the online distribution channel segment. The use of online shopping portals and mobile apps is becoming more popular among the young population, who are the industry's major global consumers.
Competitive Landscape

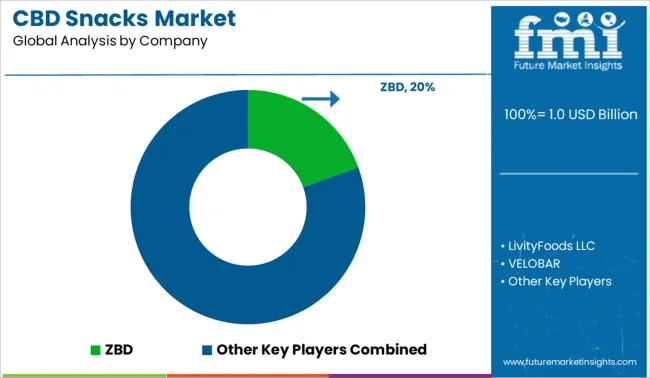
The global CBD snacks market is highly competitive and highly fragmented. This global CBD snacks market landscape is the result of a growing number of emerging players in the market around the world. Partnerships, associations, affiliations, mergers, and collaborations are among the strategies used by new entrants. With the help of these strategies, new players can gain crucial and much-needed market exposure that will assist them in understanding the dynamics of the global CBD snacks market.

Scope of the Report

Attribute Details
Forecast Period 2022 to 2032
Historical Data Available for 2017 to 2022
Market Analysis USD Million for Value and Million. Sq. M. for Volume
Key Regions Covered North America; Latin America; Europe; East Asia; South Asia; and the Middle East & Africa
Key Countries Covered USA, Brazil, Mexico, Germany, UK, China, India, Japan, Australia, and GCC Countries
Key Segments Covered Type, Distribution Channel, Region
Key Companies Profiled ZBD; LivityFoods LLC; VELOBAR; Naturebox; Weller; Evo Hemp; CBD American Shaman; Dixie Brands Inc.; Premium Jane; Pure Kana; Just CBD.
Report Coverage Market Forecast, Company Share Analysis, Competition Intelligence, DROT Analysis, Market Dynamics and Challenges, and Strategic Growth Initiatives
Customization & Pricing Available upon Request

CBD Snacks Market by Category

By Type, CBD Snacks Market is Segmented as:

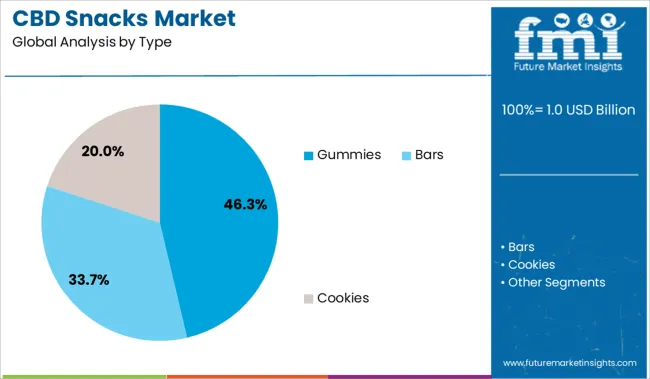
  • Gummies
  • Bars
  • Cookies

By Distribution Channel, CBD Snacks Market is Segmented as:

  • Hypermarkets/Supermarkets
  • Convenience Stores
  • Discount Stores
  • Pharmacy/Drug Stores
  • Food and Drink Specialty Stores
  • Independent Small Groceries
  • E Retailers

By Region, CBD Snacks Market is Segmented as:

  • North America
  • Latin America
  • Europe
  • Middle east and Africa
  • East Asia
  • South Asia
  • Oceania

Frequently Asked Questions

At what rate will the CBD Snacks Market grow?

Throughout the forecast period, the CBD Snacks Market is expected to grow at a CAGR of 13.2%.

What is the expected value of the CBD Snacks Market by 2032?

By 2032, the CBD Snacks Market is expected to be worth USD 2.5 Bn.

What are the key factors driving the CBD Snacks Market?

Demand for convenience food is driving the market.

Which region adds to the highest CBD Snacks Market Valuation?

The Asia Pacific region is one of the most important consumers and has the largest market share.

What are the key strategies adopted by the major players of the CBD Snacks Market?

Major market players use strategies such as introducing new products and improving them, as well as investing in research and development.

Who are the key players in the CBD Snacks Market?

Some of the key players in the CBD Snacks Market include ZBD, LivityFoods LLC, VELOBAR, Naturebox, Weller, Evo Hemp, CBD American Shaman, Dixie Brands Inc., Premium Jane, Pure Kana, and Just CBD.

Table of Content
1. Executive Summary

    1.1. Global Market Outlook

    1.2. Demand-side Trends

    1.3. Supply-side Trends

    1.4. Technology Roadmap Analysis

    1.5. Analysis and Recommendations

2. Market Overview

    2.1. Market Coverage / Taxonomy

    2.2. Market Definition / Scope / Limitations

3. Market Background

    3.1. Market Dynamics

        3.1.1. Drivers

        3.1.2. Restraints

        3.1.3. Opportunity 

        3.1.4. Trends

    3.2. Scenario Forecast

        3.2.1. Demand in Optimistic Scenario

        3.2.2. Demand in Likely Scenario

        3.2.3. Demand in Conservative Scenario

    3.3. Product launches & Recent Developments

    3.4. Product Life Cycle Analysis

    3.5. Value Chain Analysis

        3.5.1. Supply Side Participants and their Roles

            3.5.1.1. Producers

            3.5.1.2. Mid-Level Participants (Traders/ Agents/ Brokers)

            3.5.1.3. Wholesalers and Distributors

        3.5.2. % of Operating Margin Analysis

        3.5.3. List of Raw Material Suppliers

        3.5.4. List of Existing and Potential Buyer’s

    3.6. Global CBD Snacks Market - Pricing Analysis

        3.6.1. Price Point Assessment by Region 

        3.6.2. Price Point Assessment by Product Type

        3.6.3. Price Forecast till 2032

        3.6.4. Factors affecting Pricing

    3.7. Forecast Factors - Relevance & Impact

    3.8. PESTLE and Porter’s Analysis

    3.9. Regulatory Landscape

        3.9.1. Packaging & Labelling Regulations

        3.9.2. Certifications and Certifying Agency Overview

        3.9.3. Import/Export Policies

    3.10. Regional Parent Market Outlook

    3.11. Consumers Survey Analysis

    3.12. Macro-Economic Factors

    3.13. Product Claims & Nutritional Information Scan by Buyers

4. Global CBD Snacks Market Analysis 2017-2021 and Forecast, 2022-2032

    4.1. Historical Market Size Value (US$ Mn) & Volume (MT) Analysis, 2017-2021

    4.2. Current and Future Market Size Value (US$ Mn) & Volume (MT) Projections, 2022-2032

        4.2.1. Y-o-Y Growth Trend Analysis

        4.2.2. Absolute $ Opportunity Analysis

5. Global CBD Snacks Market Analysis 2017-2021 and Forecast 2022-2032, By Type

    5.1. Introduction / Key Findings

    5.2. Historical Market Size Value (US$ Mn) & Volume (MT) Analysis By Type, 2017-2021

    5.3. Current and Future Market Size Value (US$ Mn) & Volume (MT) Analysis and Forecast By Type, 2022-2032

        5.3.1. Gummies

        5.3.2. Bars

        5.3.3. Cookies

    5.4. Y-o-Y Growth Trend Analysis By Type, 2017-2021

    5.5. Absolute $ Opportunity Analysis By Type, 2022-2032

6. Global CBD Snacks Market Analysis 2017-2021 and Forecast 2022-2032, By Distribution Channel

    6.1. Introduction / Key Findings

    6.2. Historical Market Size Value (US$ Mn) & Volume (MT) Analysis By Distribution Channel, 2017-2021

    6.3. Current and Future Market Size Value (US$ Mn) & Volume (MT) Analysis and Forecast By Distribution Channel, 2022-2032

        6.3.1. Hypermarkets/Supermarkets

        6.3.2. Convenience Stores

        6.3.3. Discount Stores

        6.3.4. Pharmacy/Drug Stores

        6.3.5. Food and Drink Specialty Stores

        6.3.6. Independent Small Groceries

        6.3.7. E Retailers

    6.4. Y-o-Y Growth Trend Analysis By Distribution Channel, 2017-2021

    6.5. Absolute $ Opportunity Analysis By Distribution Channel, 2022-2032

7. Global CBD Snacks Market Analysis 2017-2021 and Forecast 2022-2032, By Region

    7.1. Introduction

    7.2. Historical Market Size Value (US$ Mn) & Volume (MT) Analysis By Region, 2017-2021

    7.3. Current Market Size Value (US$ Mn) & Volume (MT) Analysis and Forecast By Region, 2022-2032

        7.3.1. North America

        7.3.2. Latin America

        7.3.3. Europe

        7.3.4. East Asia

        7.3.5. South Asia

        7.3.6. Oceania

        7.3.7. MEA

    7.4. Market Attractiveness Analysis By Region

8. North America CBD Snacks Market Analysis 2017-2021 and Forecast 2022-2032, By Country

    8.1. Historical Market Size Value (US$ Mn) & Volume (MT) Trend Analysis By Market Taxonomy, 2017-2021

    8.2. Market Size Value (US$ Mn) & Volume (MT) Forecast By Market Taxonomy, 2022-2032

        8.2.1. By Country

            8.2.1.1. U.S.

            8.2.1.2. Canada

        8.2.2. By Type

        8.2.3. By Distribution Channel

    8.3. Market Attractiveness Analysis

        8.3.1. By Country

        8.3.2. By Type

        8.3.3. By Distribution Channel

    8.4. Key Takeaways

9. Latin America CBD Snacks Market Analysis 2017-2021 and Forecast 2022-2032, By Country

    9.1. Historical Market Size Value (US$ Mn) & Volume (MT) Trend Analysis By Market Taxonomy, 2017-2021

    9.2. Market Size Value (US$ Mn) & Volume (MT) Forecast By Market Taxonomy, 2022-2032

        9.2.1. By Country

            9.2.1.1. Brazil

            9.2.1.2. Mexico

            9.2.1.3. Argentina

            9.2.1.4. Chile

            9.2.1.5. Peru

            9.2.1.6. Rest of Latin America

        9.2.2. By Type

        9.2.3. By Distribution Channel

    9.3. Market Attractiveness Analysis

        9.3.1. By Country

        9.3.2. By Type

        9.3.3. By Distribution Channel

    9.4. Key Takeaways

10. Europe CBD Snacks Market Analysis 2017-2021 and Forecast 2022-2032, By Country

    10.1. Historical Market Size Value (US$ Mn) & Volume (MT) Trend Analysis By Market Taxonomy, 2017-2021

    10.2. Market Size Value (US$ Mn) & Volume (MT) Forecast By Market Taxonomy, 2022-2032

        10.2.1. By Country

            10.2.1.1. Germany

            10.2.1.2. Italy

            10.2.1.3. France

            10.2.1.4. U.K.

            10.2.1.5. Spain

            10.2.1.6. Russia

            10.2.1.7. BENELUX

            10.2.1.8. Poland

            10.2.1.9. Nordic Countries

            10.2.1.10. Rest of Europe

        10.2.2. By Type

        10.2.3. By Distribution Channel

    10.3. Market Attractiveness Analysis

        10.3.1. By Country

        10.3.2. By Type

        10.3.3. By Distribution Channel

    10.4. Key Takeaways

11. East Asia CBD Snacks Market Analysis 2017-2021 and Forecast 2022-2032, By Country

    11.1. Historical Market Size Value (US$ Mn) & Volume (MT) Trend Analysis By Market Taxonomy, 2017-2021

    11.2. Market Size Value (US$ Mn) & Volume (MT) Forecast By Market Taxonomy, 2022-2032

        11.2.1. By Country

            11.2.1.1. China

            11.2.1.2. Japan

            11.2.1.3. South Korea

        11.2.2. By Type

        11.2.3. By Distribution Channel

    11.3. Market Attractiveness Analysis

        11.3.1. By Country

        11.3.2. By Type

        11.3.3. By Distribution Channel

    11.4. Key Takeaways

12. South Asia CBD Snacks Market Analysis 2017-2021 and Forecast 2022-2032, By Country

    12.1. Historical Market Size Value (US$ Mn) & Volume (MT) Trend Analysis By Market Taxonomy, 2017-2021

    12.2. Market Size Value (US$ Mn) & Volume (MT) Forecast By Market Taxonomy, 2022-2032

        12.2.1. By Country

            12.2.1.1. India

            12.2.1.2. Thailand

            12.2.1.3. Malaysia

            12.2.1.4. Indonesia

            12.2.1.5. Rest of South Asia

        12.2.2. By Type

        12.2.3. By Distribution Channel

    12.3. Market Attractiveness Analysis

        12.3.1. By Country

        12.3.2. By Type

        12.3.3. By Distribution Channel

    12.4. Key Takeaways

13. Oceania CBD Snacks Market Analysis 2017-2021 and Forecast 2022-2032, By Country

    13.1. Historical Market Size Value (US$ Mn) & Volume (MT) Trend Analysis By Market Taxonomy, 2017-2021

    13.2. Market Size Value (US$ Mn) & Volume (MT) Forecast By Market Taxonomy, 2022-2032

        13.2.1. By Country

            13.2.1.1. Australia

            13.2.1.2. New Zealand

        13.2.2. By Type

        13.2.3. By Distribution Channel

    13.3. Market Attractiveness Analysis

        13.3.1. By Country

        13.3.2. By Type

        13.3.3. By Distribution Channel

    13.4. Key Takeaways

14. MEA CBD Snacks Market Analysis 2017-2021 and Forecast 2022-2032, By Country

    14.1. Historical Market Size Value (US$ Mn) & Volume (MT) Trend Analysis By Market Taxonomy, 2017-2021

    14.2. Market Size Value (US$ Mn) & Volume (MT) Forecast By Market Taxonomy, 2022-2032

        14.2.1. By Country

            14.2.1.1. GCC Countries

            14.2.1.2. South Africa

            14.2.1.3. Central Africa

            14.2.1.4. North Africa

        14.2.2. By Type

        14.2.3. By Distribution Channel

    14.3. Market Attractiveness Analysis

        14.3.1. By Country

        14.3.2. By Type

        14.3.3. By Distribution Channel

    14.4. Key Takeaways

15. Key Countries CBD Snacks Market Analysis

    15.1. U.S.

        15.1.1. Pricing Analysis

        15.1.2. Market Share Analysis, 2021

            15.1.2.1. By Type

            15.1.2.2. By Distribution Channel

    15.2. Canada

        15.2.1. Pricing Analysis

        15.2.2. Market Share Analysis, 2021

            15.2.2.1. By Type

            15.2.2.2. By Distribution Channel

    15.3. Brazil

        15.3.1. Pricing Analysis

        15.3.2. Market Share Analysis, 2021

            15.3.2.1. By Type

            15.3.2.2. By Distribution Channel

    15.4. Mexico

        15.4.1. Pricing Analysis

        15.4.2. Market Share Analysis, 2021

            15.4.2.1. By Type

            15.4.2.2. By Distribution Channel

    15.5. Argentina

        15.5.1. Pricing Analysis

        15.5.2. Market Share Analysis, 2021

            15.5.2.1. By Type

            15.5.2.2. By Distribution Channel

    15.6. Chile

        15.6.1. Pricing Analysis

        15.6.2. Market Share Analysis, 2021

            15.6.2.1. By Type

            15.6.2.2. By Distribution Channel

    15.7. Peru

        15.7.1. Pricing Analysis

        15.7.2. Market Share Analysis, 2021

            15.7.2.1. By Type

            15.7.2.2. By Distribution Channel

    15.8. Germany

        15.8.1. Pricing Analysis

        15.8.2. Market Share Analysis, 2021

            15.8.2.1. By Type

            15.8.2.2. By Distribution Channel

    15.9. Italy

        15.9.1. Pricing Analysis

        15.9.2. Market Share Analysis, 2021

            15.9.2.1. By Type

            15.9.2.2. By Distribution Channel

    15.10. France

        15.10.1. Pricing Analysis

        15.10.2. Market Share Analysis, 2021

            15.10.2.1. By Type

            15.10.2.2. By Distribution Channel

    15.11. Spain

        15.11.1. Pricing Analysis

        15.11.2. Market Share Analysis, 2021

            15.11.2.1. By Type

            15.11.2.2. By Distribution Channel

    15.12. U.K.

        15.12.1. Pricing Analysis

        15.12.2. Market Share Analysis, 2021

            15.12.2.1. By Type

            15.12.2.2. By Distribution Channel

    15.13. Russia

        15.13.1. Pricing Analysis

        15.13.2. Market Share Analysis, 2021

            15.13.2.1. By Type

            15.13.2.2. By Distribution Channel

    15.14. Poland

        15.14.1. Pricing Analysis

        15.14.2. Market Share Analysis, 2021

            15.14.2.1. By Type

            15.14.2.2. By Distribution Channel

    15.15. BENELUX

        15.15.1. Pricing Analysis

        15.15.2. Market Share Analysis, 2021

            15.15.2.1. By Type

            15.15.2.2. By Distribution Channel

    15.16. Nordic Countries

        15.16.1. Pricing Analysis

        15.16.2. Market Share Analysis, 2021

            15.16.2.1. By Type

            15.16.2.2. By Distribution Channel

    15.17. China

        15.17.1. Pricing Analysis

        15.17.2. Market Share Analysis, 2021

            15.17.2.1. By Type

            15.17.2.2. By Distribution Channel

    15.18. Japan

        15.18.1. Pricing Analysis

        15.18.2. Market Share Analysis, 2021

            15.18.2.1. By Type

            15.18.2.2. By Distribution Channel

    15.19. South Korea

        15.19.1. Pricing Analysis

        15.19.2. Market Share Analysis, 2021

            15.19.2.1. By Type

            15.19.2.2. By Distribution Channel

    15.20. India

        15.20.1. Pricing Analysis

        15.20.2. Market Share Analysis, 2021

            15.20.2.1. By Type

            15.20.2.2. By Distribution Channel

    15.21. Thailand

        15.21.1. Pricing Analysis

        15.21.2. Market Share Analysis, 2021

            15.21.2.1. By Type

            15.21.2.2. By Distribution Channel

    15.22. Indonesia

        15.22.1. Pricing Analysis

        15.22.2. Market Share Analysis, 2021

            15.22.2.1. By Type

            15.22.2.2. By Distribution Channel

    15.23. Malaysia

        15.23.1. Pricing Analysis

        15.23.2. Market Share Analysis, 2021

            15.23.2.1. By Type

            15.23.2.2. By Distribution Channel

    15.24. Singapore

        15.24.1. Pricing Analysis

        15.24.2. Market Share Analysis, 2021

            15.24.2.1. By Type

            15.24.2.2. By Distribution Channel

    15.25. GCC Countries

        15.25.1. Pricing Analysis

        15.25.2. Market Share Analysis, 2021

            15.25.2.1. By Type

            15.25.2.2. By Distribution Channel

    15.26. South Africa

        15.26.1. Pricing Analysis

        15.26.2. Market Share Analysis, 2021

            15.26.2.1. By Type

            15.26.2.2. By Distribution Channel

    15.27. Central Africa

        15.27.1. Pricing Analysis

        15.27.2. Market Share Analysis, 2021

            15.27.2.1. By Type

            15.27.2.2. By Distribution Channel

    15.28. North Africa

        15.28.1. Pricing Analysis

        15.28.2. Market Share Analysis, 2021

            15.28.2.1. By Type

            15.28.2.2. By Distribution Channel

16. Market Structure Analysis

    16.1. Competition Dashboard

    16.2. Competition Benchmarking

    16.3. Market Share Analysis of Top Players

        16.3.1. By Regional

        16.3.2. By Type

        16.3.3. By Distribution Channel

17. Competition Analysis

    17.1. Competition Deep Dive

        17.1.1. ZBD

            17.1.1.1. Overview

            17.1.1.2. Product Portfolio

            17.1.1.3. Profitability by Market Segments (Product/Age /Sales Channel/Region)

            17.1.1.4. Sales Footprint

            17.1.1.5. Strategy Overview

                17.1.1.5.1. Marketing Strategy

                17.1.1.5.2. Product Strategy

                17.1.1.5.3. Channel Strategy

        17.1.2. LivityFoods LLC

            17.1.2.1. Overview

            17.1.2.2. Product Portfolio

            17.1.2.3. Profitability by Market Segments (Product/Age /Sales Channel/Region)

            17.1.2.4. Sales Footprint

            17.1.2.5. Strategy Overview

                17.1.2.5.1. Marketing Strategy

                17.1.2.5.2. Product Strategy

                17.1.2.5.3. Channel Strategy

        17.1.3. VELOBAR

            17.1.3.1. Overview

            17.1.3.2. Product Portfolio

            17.1.3.3. Profitability by Market Segments (Product/Age /Sales Channel/Region)

            17.1.3.4. Sales Footprint

            17.1.3.5. Strategy Overview

                17.1.3.5.1. Marketing Strategy

                17.1.3.5.2. Product Strategy

                17.1.3.5.3. Channel Strategy

        17.1.4. Naturebox

            17.1.4.1. Overview

            17.1.4.2. Product Portfolio

            17.1.4.3. Profitability by Market Segments (Product/Age /Sales Channel/Region)

            17.1.4.4. Sales Footprint

            17.1.4.5. Strategy Overview

                17.1.4.5.1. Marketing Strategy

                17.1.4.5.2. Product Strategy

                17.1.4.5.3. Channel Strategy

        17.1.5. Weller

            17.1.5.1. Overview

            17.1.5.2. Product Portfolio

            17.1.5.3. Profitability by Market Segments (Product/Age /Sales Channel/Region)

            17.1.5.4. Sales Footprint

            17.1.5.5. Strategy Overview

                17.1.5.5.1. Marketing Strategy

                17.1.5.5.2. Product Strategy

                17.1.5.5.3. Channel Strategy

        17.1.6. Evo Hemp

            17.1.6.1. Overview

            17.1.6.2. Product Portfolio

            17.1.6.3. Profitability by Market Segments (Product/Age /Sales Channel/Region)

            17.1.6.4. Sales Footprint

            17.1.6.5. Strategy Overview

                17.1.6.5.1. Marketing Strategy

                17.1.6.5.2. Product Strategy

                17.1.6.5.3. Channel Strategy

        17.1.7. CBD American Shaman

            17.1.7.1. Overview

            17.1.7.2. Product Portfolio

            17.1.7.3. Profitability by Market Segments (Product/Age /Sales Channel/Region)

            17.1.7.4. Sales Footprint

            17.1.7.5. Strategy Overview

                17.1.7.5.1. Marketing Strategy

                17.1.7.5.2. Product Strategy

                17.1.7.5.3. Channel Strategy

        17.1.8. Dixie Brands Inc.

            17.1.8.1. Overview

            17.1.8.2. Product Portfolio

            17.1.8.3. Profitability by Market Segments (Product/Age /Sales Channel/Region)

            17.1.8.4. Sales Footprint

            17.1.8.5. Strategy Overview

                17.1.8.5.1. Marketing Strategy

                17.1.8.5.2. Product Strategy

                17.1.8.5.3. Channel Strategy

        17.1.9. Premium Jane

            17.1.9.1. Overview

            17.1.9.2. Product Portfolio

            17.1.9.3. Profitability by Market Segments (Product/Age /Sales Channel/Region)

            17.1.9.4. Sales Footprint

            17.1.9.5. Strategy Overview

                17.1.9.5.1. Marketing Strategy

                17.1.9.5.2. Product Strategy

                17.1.9.5.3. Channel Strategy

        17.1.10. Pure Kana

            17.1.10.1. Overview

            17.1.10.2. Product Portfolio

            17.1.10.3. Profitability by Market Segments (Product/Age /Sales Channel/Region)

            17.1.10.4. Sales Footprint

            17.1.10.5. Strategy Overview

                17.1.10.5.1. Marketing Strategy

                17.1.10.5.2. Product Strategy

                17.1.10.5.3. Channel Strategy

        17.1.11. Just CBD.

            17.1.11.1. Overview

            17.1.11.2. Product Portfolio

            17.1.11.3. Profitability by Market Segments (Product/Age /Sales Channel/Region)

            17.1.11.4. Sales Footprint

            17.1.11.5. Strategy Overview

                17.1.11.5.1. Marketing Strategy

                17.1.11.5.2. Product Strategy

                17.1.11.5.3. Channel Strategy

        17.1.12. Others

18. Assumptions & Acronyms Used

19. Research Methodology
Recommendations

Consumer Product

CBD Skin Care Market

July 2020

REP-GB-9206

October 2023

306 pages

Food and Beverage

CBD Gummies Market

December 2021

REP-GB-11697

July 2023

342 pages

Food and Beverage

CBD Oil Market

September 2021

REP-GB-11661

March 2023

342 pages

Packaging

CBD Product Packaging Market

September 2024

REP-GB-13437

Upcoming

Explore Food and Beverage Insights

View Reports