Reports

- Global Locations -

Headquarters

Future Market Insights, Inc.

Christiana Corporate, 200
Continental Drive, Suite 401,
Newark, Delaware - 19713,
United States

T: +1-845-579-5705

Americas

Future Market Insights, Inc.

616 Corporate Way, Suite 2-9018,
Valley Cottage, NY 10989, United States

T: +1-347-918-3531

MEA

Future Market Insights

1602-6 Jumeirah Bay X2 Tower, Plot No: JLT-PH2-X2A,
Jumeirah Lakes Towers, Dubai,
United Arab Emirates

Europe

Future Market Insights

3rd Floor, 207 Regent Street,
W1B 3HH London
United Kingdom

T: + 44 (0) 20 8123 9659
D: +44 (0) 20 3287 4268

Asia Pacific

Future Market Insights

IndiaLand Global Tech Park, Unit UG-1, Behind Grand HighStreet, Phase 1, Hinjawadi, MH, Pune – 411057, India

CBD Skin Care Market Outlook for (2023 to 2033)

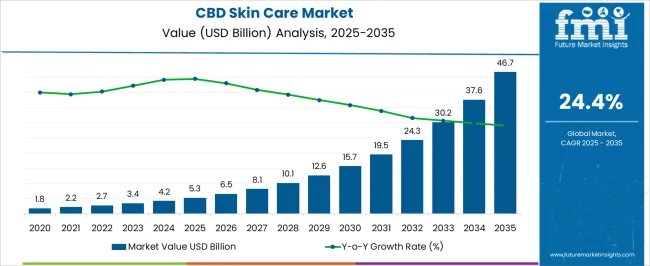
The global CBD skin care market value is estimated to clock a revenue of US$ 32,859.5 million by 2033. CBD skin care providers expect the market to expand at a CAGR of 25.7% through 2033, with a present valuation of US$ 3,327.9 million in 2023.

CBD Skin Care Products Market Trends

  • Growing awareness about the potential therapeutic qualities and soothing effects of CBD is catalyzing the purchase of different CBD-infused skin care products, including creams, balms, masks, etc. For instance, CBD oil is utilized to treat conditions like psoriasis and eczema and to ease skin irritation and sensitivity.
  • An increasing number of enterprises are investing in CBD cosmetic and skin care products to enhance the competitiveness of their products.
  • Surging number of enterprises entering the market due to the high lucrativeness of the market.
  • As more research showing positive outcomes comes to the fore, more consumers are expected to treat CBD products more objectively and be willing to use them.
  • Mounting concerns for health and hygiene are expected to boost sales of clinical hand hygiene products containing CBD.
Attribute Details
CBD Skin Care Market Size, 2022 US$ 2,696 million
CBD Skin Care Market Size, 2023 US$ 3,327.9 million
CBD Skin Care Market Size, 2033 US$ 32,859.5 million
Value-based CAGR (2023 to 2033) 25.7%

Don't pay for what you don't need

Customize your report by selecting specific countries or regions and save 30%!

Historical Growth of the CBD Skin Care Market Vs. Forecast Outlook

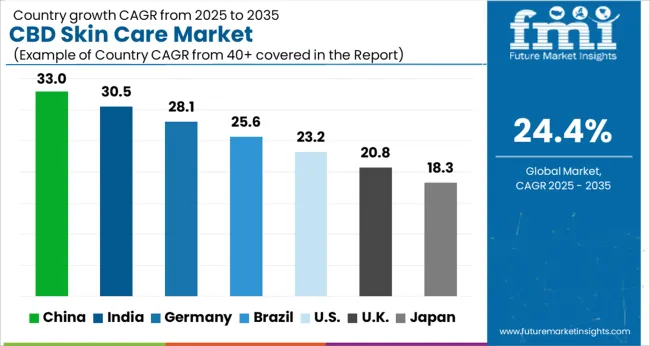
The CBD skin care industry displayed market growth of 18.8% CAGR in the historical period. The growth of the market is expected to assume a pace of 25.7% CAGR over the forecast period due to the buzz around CBD skin care products. The market has been driven by the increasing number of working professionals, which has expanded the spending capacity and awareness about several products present in the market, which is thus boosting the sales of quality products.

Attributes Details
CBD Skin Care Market Size (2018) US$ 1,353 million
CBD Skin Care Market Size (2022) US$ 2,696 million
CBD Skin Care Market CAGR (2018 to 2022) 18.8%

In the upcoming years, manufacturers are expected to develop clean-label personal care products. Due to the increasing options available to consumers, manufacturers are focusing on developing affordable and reliable products to boost their sales.
Comparative View of Adjacent CBD Skin Care Markets

In the following table, the CBD skin care market has been compared alongside the skin-lightening products market and cosmetics ODM market. The table sheds light on the key drivers, trends, and opportunities that are affecting the respective markets. As per the analysis, the CBD skin care market is expected to expand at a greater CAGR of 25.7% through 2033. The skin lightening products market is predicted to record a total revenue of US$ 19,225.9 million in 2023, which is higher than the other two given markets.

CBD Skin Care Market:

Attributes CBD Skin Care Market
CAGR (2023 to 2033) 25.7%
Market Value (2023) US$ 3,327.9 million
Growth Factors
  • Increasing awareness about the multiple benefits of using CBD in skin care products
  • Surging interest in new beauty products
Future Opportunities Increasing investments in CBD-infused skin care products
Market Trends Ongoing research proving the effectiveness of CBD skin care products

Skin Lightening Products Market:

Attributes Skin Lightening Products Market
CAGR (2023 to 2033) 7%
Market Value (2023) US$ 19,225.9 million
Growth Factors
Future Opportunities Introduction and investments in new natural ingredients for an effective and secure skin-lightening effect
Market Trends The emergent trend of inclusivity is picked up by the manufacturers of skin lightening products

Cosmetics ODM Market:

Attributes Cosmetics ODM Market
CAGR (2023 to 2033) 5.6%
Market Value (2023) US$ 13,460.7 million
Growth Factors
  • Development of cost-effective manufacturing solutions
  • Emergence of indie beauty brands
Future Opportunities Increasing interest in customized offerings of natural and sustainable products
Market Trends Running trend of try-on experiences and virtual reality beauty consultations
Sneha Verghese
Sneha Verghese

Principal Consultant

Talk to Analyst

Find your sweet spots for generating winning opportunities in this market.

Country-wise Insights

Countries Market Share, 2023
United States 31.1%
Canada 6%
Germany 8%
The United Kingdom 8.1%
France 6.2%
Italy 3%
Spain 3.7%

Legalization of Cannabis-based Products in the United States to Attract Many Users

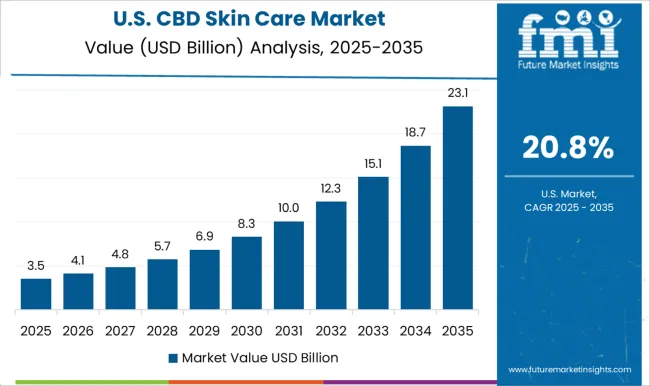
The CBD skin care market in North America is at an all-time high. The CBD skin care market in the United States accounts for 31.1%, thus gaining a massive share of the global market. The high presence of CBD skin care product manufacturers like DR. KERKLAAN THERAPEUTICS, Cannuka, LLC, Redwood Wellness, LLC, SAGELY NATURALS, etc., is influencing the market positively in the country.

Another chief factor fueling the market growth is the legalization of sales of cannabis-based products in the United States. This is projected to create a considerable demand for hemp-derived CBD skin care products in the country. Skin care products containing marijuana-derived CBD are selling like hotcakes due to growing awareness about their benefits. These products are beneficial in treating acne and slowing down aging.

This magic ingredient has become a norm in several skin care products like moisturizers, cleansers, sunscreens, chapsticks, etc. Thus, the growing familiarity of American inhabitants with CBD-infused skin care products has a significant role in boosting their consumption.

Intense Marketing Initiatives by Manufacturers to Gain Profits in the Canada Market

Canada is another key market in North America, which is assessed to account for 6% of the global market. Businesses are finding significant expansion opportunities in the country, after the positive outcome of their business in the United States. Apart from this, the fact that CBD has been positioned as a hero ingredient in beauty products has a crucial role in attracting potential customers. Moreover, companies are invigorating their distribution networks to boost the accessibility of CBD skin care products.
Focus on Sustainability and Innovation by CBD Skin Care Product Makers in Germany

Leading vendors are investing in the Germany market due to the high potential for revenue over the upcoming years. Consumers in Germany are showing greater concern for the ingredients used in their skin products. Therefore, companies are emphasizing developing innovative and more sustainable CBD skin care products for an enormous uptake.

CBD is finding higher adoption in skin care products, as it offers the benefits of cannabis without any psychoactive effects associated with cannabis. Owing to this, consumers who either cannot or will not utilize conventional marijuana products are expected to opt for CBD skin care products. Due to the widespread use of CBD in many industries, including skincare and makeup, dispensary owners are finding significant opportunities for expansion and lucrative turnover.

Introduction of New CBD Skin Care Products in the United Kingdom to Uplift the Market

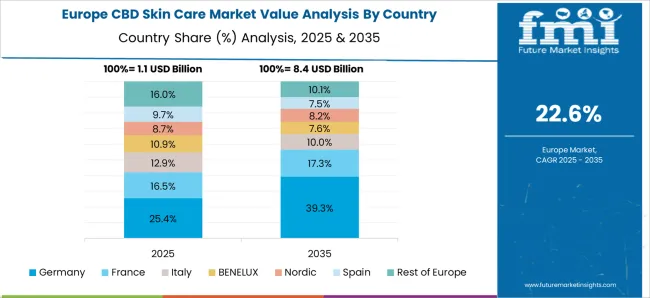
The United Kingdom accounts for 8.1% market share across the globe. The country holds the maximum share of the Europe CBD skin care market. Due to its high lucrativeness for the CBD skin care business, numerous manufacturers are projected to launch their CBD skin care products in the country, thus boosting skincare market growth.

  • For instance, in October 2020, The Body Shop, the United Kingdom-based manufacturer, introduced three CBD skin care products in the United Kingdom. The collection was announced on the 22nd of September and consists of moisturizer, face oil, and a cleansing mask. These products contain an undisclosed amount of natural origin CBD and hempseed oil. In Britain, the products are available in stores and online platforms.

Domestic Players in Asia Focusing on Developing Innovative and Effective CBD Skin Care Products

Asia Pacific is an emerging hub for beauty products, thanks to the appearance-conscious Asian population in the region. The increasing number of working women in the region is directly impacting the sales of beauty products. Interest in green cosmetic products is also soaring as consumers in China are gravitating toward sustainable fashion.

As per the latest market estimates, China is projected to have a prominent stake in the region. Surging consumer awareness about the benefits of natural cosmetics and the increasing emphasis of domestic players on the development of innovative and effective products composed of natural ingredients are boosting the market demand.

Country Market Share, 2023
China 4.4%
India 3.1%
Japan 2.2%
Singapore 1.1%

Trend-savvy Consumers in China Piqued by the CBD Beauty Trend

The China market holds a 4.4% of value share in the global market. The CBD beauty trend is gradually catching up in China, which has made a prominent name for itself as one of the leading beauty markets in the globe.

After the cannabis legalization in Europe and North America, skin care manufacturers have been increasingly deploying CBD in skincare products to enrich them with immunity-restorative and anti-inflammatory properties. Consequently, CBD has achieved a reputation as a star ingredient in the broader wellness beauty movement.

Such massive popularity of CBD in the West has grabbed the attention of trend-savvy consumers in China. Beauty and fashion bloggers in China are utilizing CBD product shopping hauls as a content staple for their social media handles. Daigous, referred to as the overseas personal shoppers in China, has been actively sourcing CBD beauty products to sell back to homeland consumers who recognize themselves as international, sophisticated, and cosmopolitan.

Category-wise Insights

Creams and Moisturizers to Record Significant Revenue Owing to Their Rising Demand

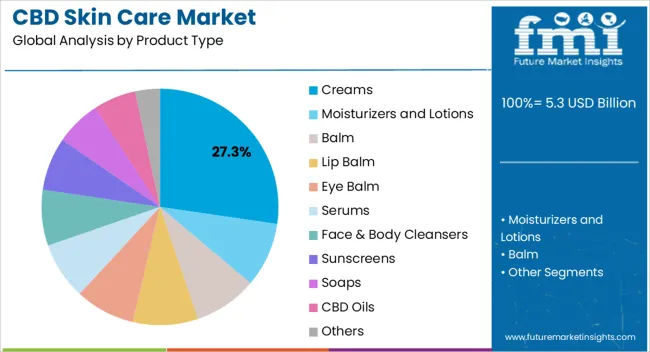
Top Product Type Creams and Moisturizers
Market Share, 2023 12.4%

The CBD-based creams and moisturizers segment has a share of 12.4% of the global market. Spurring sales of beauty products due to heightened skin concerns and consumer demand for distinct moisturizing creams are catalyzing market growth. Consumers are now open to experimenting with new and innovative products in the market, thus prompting manufacturers to develop creams and moisturizers with new ingredients.

As the anti-wrinkle ingredient products, skin-lightening products, and effective moisturizing products are rising, sales and revenue generated from these products in creams and moisturizer formats are escalating.

Increasing Focus on Cost-effective and Functional Pumps and Dispensers

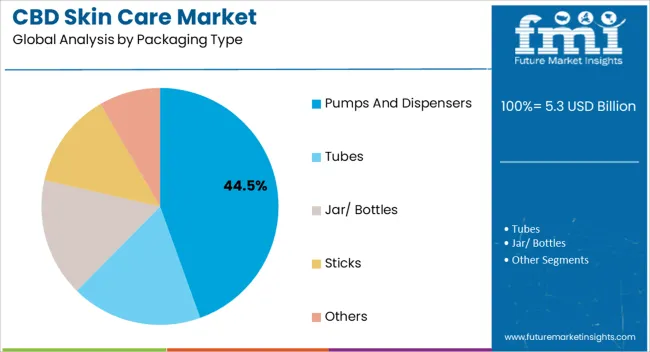
Top Packaging Type Pumps and Dispensers
Market Share, 2023 23.4%

Consumers are increasingly opting for CBD skin care products packed in pumps and dispensers. Their high adoption of beauty products in these formats can be credited to the high-end features of pumps and dispensers like being easy to dispose of, lightweight, chemical resistant, and likewise. Top manufacturers of pumps and dispensers are launching more eco-friendly products composed of 100% recycled contents and bioplastic for their eco-conscious consumers.

Packaging developers are introducing innovations in the market such as airless pumps to enhance product preference. The growing focus on the cost-efficiency of packaging products for higher margins is expected to boost the segment’s growth.
Get the data you need at a Fraction of the cost

Personalize your report by choosing insights you need
and save 40%!

Competitive Landscape in the CBD Skin Care Market

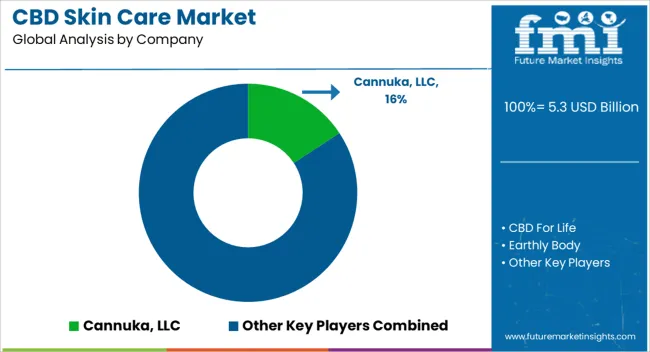
CBD skin care products market manufacturers are focusing on launching CBD-based products in their portfolios. For their enhanced accessibility, players are invigorating their distribution channels and online presence. A key differentiation strategy among the leading players includes cost-competitiveness. New launches, partnerships, collaborations, and mergers and acquisitions are some of the typical strategies adopted by leading players for better market penetration.

Key Developments in the CBD Skin Care Market

  • In February 2020, Avon, a beauty and personal care firm, made its entry into the green space with the introduction of its first CBD skincare product. The product is popularly called Green Goddess as it is infused with CBD. This CBD skincare product is composed of 99% natural ingredients, consisting of CBD, sunflower and jojoba seed oils, hemp, turmeric, and squalene oil.
  • In November 2022, Juana Skin’s product line, with the permission of Dubaian authorities, is expected to bring CBD or cannabidiol to consumers in the Middle East. The product line consists of night creams, brightening moisturizers, body butter, and face oils. The company took a new route with the expansion of business in the Middle East where the market was closed, instead of catering to consumers already spoiled for choice.
  • In September 2020, Nordic Cosmetics GmbH, which is a division of Nordic Oil, in tandem with Asia Horizon Group Inc., introduced Nordic Cosmetics’ flagship e-commerce store on Tmall, which is a business-to-consumer e-retail platform handled by Alibaba Group.
  • In July 2021, Bombay Hemp Company, an India-based firm, extended its skin care line consisting of hemp and CBD skin care range, as a curiosity in hemp oils and CBD beauty products soars.
  • In September 2020, Amway introduced CBD facial oil and glowing skin product line.

Key Players in the Market

  • Cannuka, LLC
  • CBD For Life
  • Earthly Body
  • Elixinol Global Limited
  • Endoca Company
  • Green Growth Brands
  • Herbivorebotanicals
  • IldiPekar Skin Care & Spa
  • Isodiol International Inc
  • Josie Maran Cosmetics
  • Kana Skincare
  • Kapu Maku LLC (POPULUM)
  • Kiehl's LLC
  • Kush Creams
  • Leef Organics
  • Leela Body Care Company
  • Lord Jones
  • Medical Marijuana Inc
  • Myaderm
  • Peter Thomas Roth
  • TESCosmetics
  • The CBD Skincare Company
  • VERTLYBALM
  • Others

Global CBD Skin Care Market Segmentation by Category

By Product Type:

  • Creams
  • Moisturizers and Lotions
  • Balm
  • Lip Balm
  • Eye Balm
  • Serums
  • Face & Body Cleansers
  • Sunscreens
  • Soaps
  • CBD Oils
  • Others

By Price Range:

  • Economic
  • Premium

By Packaging Type:

  • Pumps and Dispensers
  • Tubes
  • Jar/ Bottles
  • Sticks
  • Others

By Source Type:

  • Natural & Organic
  • Marijuana Derived CBD
  • Hemp-Derived CBD
  • Synthetic

By Sales Channel:

  • Hypermarkets/Supermarkets
  • Speciality Stores/ Multi brand stores
  • Drug/ Pharmaceuticals Stores
  • Online Retail
  • Department Stores
  • Convenience Stores
  • Wholesalers & Distributors

By Region:

  • North America
  • Latin America
  • Europe
  • South Asia
  • East Asia
  • Oceania
  • Middle East & Africa

Frequently Asked Questions

How Big is the CBD Skin Care Market?

The CBD skin care market valuation is US$ 3,327.9 million in 2023.

What is the Growth Potential of CBD Skin Care?

The market is expected to expand at a CAGR of 25.7% through 2033.

Which Country is Expected to Attain the Maximum Share?

The United States is projected to grab the maximum market share.

Which Product Type Generates Significant Revenue for the CBD Skin Care Market?

Creams and moisturizers generate significant revenue for the market.

Which are the Key Companies in the CBD Skin Care Market?

Kiehl's LLC, Kush Creams, and Leef Organics are the key competitors in the market.

Table of Content

1. Executive Summary

    1.1. Global Market Outlook

    1.2. Demand-side Trends

    1.3. Supply-side Trends

    1.4. Technology Roadmap Analysis

    1.5. Analysis and Recommendations

2. Market Overview

    2.1. Market Coverage / Taxonomy

    2.2. Market Definition / Scope / Limitations

3. Market Background

    3.1. Market Dynamics

        3.1.1. Drivers

        3.1.2. Restraints

        3.1.3. Opportunity

        3.1.4. Trends

    3.2. Scenario Forecast

        3.2.1. Demand in Optimistic Scenario

        3.2.2. Demand in Likely Scenario

        3.2.3. Demand in Conservative Scenario

    3.3. Opportunity Map Analysis

    3.4. Product Life Cycle Analysis

    3.5. Supply Chain Analysis

        3.5.1. Supply Side Participants and their Roles

            3.5.1.1. Producers

            3.5.1.2. Mid-Level Participants (Traders/ Agents/ Brokers)

            3.5.1.3. Wholesalers and Distributors

        3.5.2. Value Added and Value Created at Node in the Supply Chain

        3.5.3. List of Raw Material Suppliers

        3.5.4. List of Existing and Potential Buyer’s

    3.6. Investment Feasibility Matrix

    3.7. Value Chain Analysis

        3.7.1. Profit Margin Analysis

        3.7.2. Wholesalers and Distributors

        3.7.3. Retailers

    3.8. PESTLE and Porter’s Analysis

    3.9. Regulatory Landscape

        3.9.1. By Key Regions

        3.9.2. By Key Countries

    3.10. Regional Parent Market Outlook

    3.11. Production and Consumption Statistics

    3.12. Import and Export Statistics

4. Global Market Analysis 2018 to 2022 and Forecast, 2023 to 2033

    4.1. Historical Market Size Value (US$ Million) & Volume (Units) Analysis, 2018 to 2022

    4.2. Current and Future Market Size Value (US$ Million) & Volume (Units) Projections, 2023 to 2033

        4.2.1. Y-o-Y Growth Trend Analysis

        4.2.2. Absolute $ Opportunity Analysis

5. Global Market Analysis 2018 to 2022 and Forecast 2023 to 2033, By Product Type

    5.1. Introduction / Key Findings

    5.2. Historical Market Size Value (US$ Million) & Volume (Units) Analysis By Product Type, 2018 to 2022

    5.3. Current and Future Market Size Value (US$ Million) & Volume (Units) Analysis and Forecast By Product Type, 2023 to 2033

        5.3.1. Creams

        5.3.2. Moisturizers and Lotions

        5.3.3. Balm

            5.3.3.1. Lip Balm

            5.3.3.2. Eye Balm

        5.3.4. Serums

        5.3.5. Face & Body Cleansers

        5.3.6. Sunscreens

        5.3.7. Soaps

        5.3.8. CBD Oils

        5.3.9. Others

    5.4. Y-o-Y Growth Trend Analysis By Product Type, 2018 to 2022

    5.5. Absolute $ Opportunity Analysis By Product Type, 2023 to 2033

6. Global Market Analysis 2018 to 2022 and Forecast 2023 to 2033, By Price Range

    6.1. Introduction / Key Findings

    6.2. Historical Market Size Value (US$ Million) & Volume (Units) Analysis By Price Range, 2018 to 2022

    6.3. Current and Future Market Size Value (US$ Million) & Volume (Units) Analysis and Forecast By Price Range, 2023 to 2033

        6.3.1. Economic

        6.3.2. Premium

    6.4. Y-o-Y Growth Trend Analysis By Price Range, 2018 to 2022

    6.5. Absolute $ Opportunity Analysis By Price Range, 2023 to 2033

7. Global Market Analysis 2018 to 2022 and Forecast 2023 to 2033, By Packaging Type

    7.1. Introduction / Key Findings

    7.2. Historical Market Size Value (US$ Million) & Volume (Units) Analysis By Packaging Type, 2018 to 2022

    7.3. Current and Future Market Size Value (US$ Million) & Volume (Units) Analysis and Forecast By Packaging Type, 2023 to 2033

        7.3.1. Pump

        7.3.2. Tubes

        7.3.3. Jar/ Bottles

        7.3.4. Sticks

        7.3.5. Others

    7.4. Y-o-Y Growth Trend Analysis By Packaging Type, 2018 to 2022

    7.5. Absolute $ Opportunity Analysis By Packaging Type, 2023 to 2033

8. Global Market Analysis 2018 to 2022 and Forecast 2023 to 2033, By Source Type

    8.1. Introduction / Key Findings

    8.2. Historical Market Size Value (US$ Million) & Volume (Units) Analysis By Source Type, 2018 to 2022

    8.3. Current and Future Market Size Value (US$ Million) & Volume (Units) Analysis and Forecast By Source Type, 2023 to 2033

        8.3.1. Natural & Organic

            8.3.1.1. Marijuana Derived CBD

            8.3.1.2. Hemp-Derived CBD

        8.3.2. Synthetic

    8.4. Y-o-Y Growth Trend Analysis By Source Type, 2018 to 2022

    8.5. Absolute $ Opportunity Analysis By Source Type, 2023 to 2033

9. Global Market Analysis 2018 to 2022 and Forecast 2023 to 2033, By Sales Channel

    9.1. Introduction / Key Findings

    9.2. Historical Market Size Value (US$ Million) & Volume (Units) Analysis By Sales Channel, 2018 to 2022

    9.3. Current and Future Market Size Value (US$ Million) & Volume (Units) Analysis and Forecast By Sales Channel, 2023 to 2033

        9.3.1. Hypermarkets/Supermarkets

        9.3.2. Speciality Stores/ Multi brand stores

        9.3.3. Drug/ Pharmaceuticals Stores

        9.3.4. Online Retail

        9.3.5. Department Stores

        9.3.6. Convenience Stores

        9.3.7. Wholesalers & Distributer

    9.4. Y-o-Y Growth Trend Analysis By Sales Channel, 2018 to 2022

    9.5. Absolute $ Opportunity Analysis By Sales Channel, 2023 to 2033

10. Global Market Analysis 2018 to 2022 and Forecast 2023 to 2033, By Region

    10.1. Introduction

    10.2. Historical Market Size Value (US$ Million) & Volume (Units) Analysis By Region, 2018 to 2022

    10.3. Current Market Size Value (US$ Million) & Volume (Units) Analysis and Forecast By Region, 2023 to 2033

        10.3.1. North America

        10.3.2. Latin America

        10.3.3. Western Europe

        10.3.4. Eastern Europe

        10.3.5. South Asia and Pacific

        10.3.6. East Asia

        10.3.7. Middle East and Africa

    10.4. Market Attractiveness Analysis By Region

11. North America Market Analysis 2018 to 2022 and Forecast 2023 to 2033, By Country

    11.1. Historical Market Size Value (US$ Million) & Volume (Units) Trend Analysis By Market Taxonomy, 2018 to 2022

    11.2. Market Size Value (US$ Million) & Volume (Units) Forecast By Market Taxonomy, 2023 to 2033

        11.2.1. By Country

            11.2.1.1. USA

            11.2.1.2. Canada

        11.2.2. By Product Type

        11.2.3. By Price Range

        11.2.4. By Packaging Type

        11.2.5. By Source Type

        11.2.6. By Sales Channel

    11.3. Market Attractiveness Analysis

        11.3.1. By Country

        11.3.2. By Product Type

        11.3.3. By Price Range

        11.3.4. By Packaging Type

        11.3.5. By Source Type

        11.3.6. By Sales Channel

    11.4. Key Takeaways

12. Latin America Market Analysis 2018 to 2022 and Forecast 2023 to 2033, By Country

    12.1. Historical Market Size Value (US$ Million) & Volume (Units) Trend Analysis By Market Taxonomy, 2018 to 2022

    12.2. Market Size Value (US$ Million) & Volume (Units) Forecast By Market Taxonomy, 2023 to 2033

        12.2.1. By Country

            12.2.1.1. Brazil

            12.2.1.2. Mexico

            12.2.1.3. Rest of Latin America

        12.2.2. By Product Type

        12.2.3. By Price Range

        12.2.4. By Packaging Type

        12.2.5. By Source Type

        12.2.6. By Sales Channel

    12.3. Market Attractiveness Analysis

        12.3.1. By Country

        12.3.2. By Product Type

        12.3.3. By Price Range

        12.3.4. By Packaging Type

        12.3.5. By Source Type

        12.3.6. By Sales Channel

    12.4. Key Takeaways

13. Western Europe Market Analysis 2018 to 2022 and Forecast 2023 to 2033, By Country

    13.1. Historical Market Size Value (US$ Million) & Volume (Units) Trend Analysis By Market Taxonomy, 2018 to 2022

    13.2. Market Size Value (US$ Million) & Volume (Units) Forecast By Market Taxonomy, 2023 to 2033

        13.2.1. By Country

            13.2.1.1. Germany

            13.2.1.2. UK

            13.2.1.3. France

            13.2.1.4. Spain

            13.2.1.5. Italy

            13.2.1.6. Rest of Western Europe

        13.2.2. By Product Type

        13.2.3. By Price Range

        13.2.4. By Packaging Type

        13.2.5. By Source Type

        13.2.6. By Sales Channel

    13.3. Market Attractiveness Analysis

        13.3.1. By Country

        13.3.2. By Product Type

        13.3.3. By Price Range

        13.3.4. By Packaging Type

        13.3.5. By Source Type

        13.3.6. By Sales Channel

    13.4. Key Takeaways

14. Eastern Europe Market Analysis 2018 to 2022 and Forecast 2023 to 2033, By Country

    14.1. Historical Market Size Value (US$ Million) & Volume (Units) Trend Analysis By Market Taxonomy, 2018 to 2022

    14.2. Market Size Value (US$ Million) & Volume (Units) Forecast By Market Taxonomy, 2023 to 2033

        14.2.1. By Country

            14.2.1.1. Poland

            14.2.1.2. Russia

            14.2.1.3. Czech Republic

            14.2.1.4. Romania

            14.2.1.5. Rest of Eastern Europe

        14.2.2. By Product Type

        14.2.3. By Price Range

        14.2.4. By Packaging Type

        14.2.5. By Source Type

        14.2.6. By Sales Channel

    14.3. Market Attractiveness Analysis

        14.3.1. By Country

        14.3.2. By Product Type

        14.3.3. By Price Range

        14.3.4. By Packaging Type

        14.3.5. By Source Type

        14.3.6. By Sales Channel

    14.4. Key Takeaways

15. South Asia and Pacific Market Analysis 2018 to 2022 and Forecast 2023 to 2033, By Country

    15.1. Historical Market Size Value (US$ Million) & Volume (Units) Trend Analysis By Market Taxonomy, 2018 to 2022

    15.2. Market Size Value (US$ Million) & Volume (Units) Forecast By Market Taxonomy, 2023 to 2033

        15.2.1. By Country

            15.2.1.1. India

            15.2.1.2. Bangladesh

            15.2.1.3. Australia

            15.2.1.4. New Zealand

            15.2.1.5. Rest of South Asia and Pacific

        15.2.2. By Product Type

        15.2.3. By Price Range

        15.2.4. By Packaging Type

        15.2.5. By Source Type

        15.2.6. By Sales Channel

    15.3. Market Attractiveness Analysis

        15.3.1. By Country

        15.3.2. By Product Type

        15.3.3. By Price Range

        15.3.4. By Packaging Type

        15.3.5. By Source Type

        15.3.6. By Sales Channel

    15.4. Key Takeaways

16. East Asia Market Analysis 2018 to 2022 and Forecast 2023 to 2033, By Country

    16.1. Historical Market Size Value (US$ Million) & Volume (Units) Trend Analysis By Market Taxonomy, 2018 to 2022

    16.2. Market Size Value (US$ Million) & Volume (Units) Forecast By Market Taxonomy, 2023 to 2033

        16.2.1. By Country

            16.2.1.1. China

            16.2.1.2. Japan

            16.2.1.3. South Korea

        16.2.2. By Product Type

        16.2.3. By Price Range

        16.2.4. By Packaging Type

        16.2.5. By Source Type

        16.2.6. By Sales Channel

    16.3. Market Attractiveness Analysis

        16.3.1. By Country

        16.3.2. By Product Type

        16.3.3. By Price Range

        16.3.4. By Packaging Type

        16.3.5. By Source Type

        16.3.6. By Sales Channel

    16.4. Key Takeaways

17. Middle East and Africa Market Analysis 2018 to 2022 and Forecast 2023 to 2033, By Country

    17.1. Historical Market Size Value (US$ Million) & Volume (Units) Trend Analysis By Market Taxonomy, 2018 to 2022

    17.2. Market Size Value (US$ Million) & Volume (Units) Forecast By Market Taxonomy, 2023 to 2033

        17.2.1. By Country

            17.2.1.1. GCC Countries

            17.2.1.2. South Africa

            17.2.1.3. Israel

            17.2.1.4. Rest of MEA

        17.2.2. By Product Type

        17.2.3. By Price Range

        17.2.4. By Packaging Type

        17.2.5. By Source Type

        17.2.6. By Sales Channel

    17.3. Market Attractiveness Analysis

        17.3.1. By Country

        17.3.2. By Product Type

        17.3.3. By Price Range

        17.3.4. By Packaging Type

        17.3.5. By Source Type

        17.3.6. By Sales Channel

    17.4. Key Takeaways

18. Key Countries Market Analysis

    18.1. USA

        18.1.1. Pricing Analysis

        18.1.2. Market Share Analysis, 2022

            18.1.2.1. By Product Type

            18.1.2.2. By Price Range

            18.1.2.3. By Packaging Type

            18.1.2.4. By Source Type

            18.1.2.5. By Sales Channel

    18.2. Canada

        18.2.1. Pricing Analysis

        18.2.2. Market Share Analysis, 2022

            18.2.2.1. By Product Type

            18.2.2.2. By Price Range

            18.2.2.3. By Packaging Type

            18.2.2.4. By Source Type

            18.2.2.5. By Sales Channel

    18.3. Brazil

        18.3.1. Pricing Analysis

        18.3.2. Market Share Analysis, 2022

            18.3.2.1. By Product Type

            18.3.2.2. By Price Range

            18.3.2.3. By Packaging Type

            18.3.2.4. By Source Type

            18.3.2.5. By Sales Channel

    18.4. Mexico

        18.4.1. Pricing Analysis

        18.4.2. Market Share Analysis, 2022

            18.4.2.1. By Product Type

            18.4.2.2. By Price Range

            18.4.2.3. By Packaging Type

            18.4.2.4. By Source Type

            18.4.2.5. By Sales Channel

    18.5. Germany

        18.5.1. Pricing Analysis

        18.5.2. Market Share Analysis, 2022

            18.5.2.1. By Product Type

            18.5.2.2. By Price Range

            18.5.2.3. By Packaging Type

            18.5.2.4. By Source Type

            18.5.2.5. By Sales Channel

    18.6. UK

        18.6.1. Pricing Analysis

        18.6.2. Market Share Analysis, 2022

            18.6.2.1. By Product Type

            18.6.2.2. By Price Range

            18.6.2.3. By Packaging Type

            18.6.2.4. By Source Type

            18.6.2.5. By Sales Channel

    18.7. France

        18.7.1. Pricing Analysis

        18.7.2. Market Share Analysis, 2022

            18.7.2.1. By Product Type

            18.7.2.2. By Price Range

            18.7.2.3. By Packaging Type

            18.7.2.4. By Source Type

            18.7.2.5. By Sales Channel

    18.8. Spain

        18.8.1. Pricing Analysis

        18.8.2. Market Share Analysis, 2022

            18.8.2.1. By Product Type

            18.8.2.2. By Price Range

            18.8.2.3. By Packaging Type

            18.8.2.4. By Source Type

            18.8.2.5. By Sales Channel

    18.9. Italy

        18.9.1. Pricing Analysis

        18.9.2. Market Share Analysis, 2022

            18.9.2.1. By Product Type

            18.9.2.2. By Price Range

            18.9.2.3. By Packaging Type

            18.9.2.4. By Source Type

            18.9.2.5. By Sales Channel

    18.10. Poland

        18.10.1. Pricing Analysis

        18.10.2. Market Share Analysis, 2022

            18.10.2.1. By Product Type

            18.10.2.2. By Price Range

            18.10.2.3. By Packaging Type

            18.10.2.4. By Source Type

            18.10.2.5. By Sales Channel

    18.11. Russia

        18.11.1. Pricing Analysis

        18.11.2. Market Share Analysis, 2022

            18.11.2.1. By Product Type

            18.11.2.2. By Price Range

            18.11.2.3. By Packaging Type

            18.11.2.4. By Source Type

            18.11.2.5. By Sales Channel

    18.12. Czech Republic

        18.12.1. Pricing Analysis

        18.12.2. Market Share Analysis, 2022

            18.12.2.1. By Product Type

            18.12.2.2. By Price Range

            18.12.2.3. By Packaging Type

            18.12.2.4. By Source Type

            18.12.2.5. By Sales Channel

    18.13. Romania

        18.13.1. Pricing Analysis

        18.13.2. Market Share Analysis, 2022

            18.13.2.1. By Product Type

            18.13.2.2. By Price Range

            18.13.2.3. By Packaging Type

            18.13.2.4. By Source Type

            18.13.2.5. By Sales Channel

    18.14. India

        18.14.1. Pricing Analysis

        18.14.2. Market Share Analysis, 2022

            18.14.2.1. By Product Type

            18.14.2.2. By Price Range

            18.14.2.3. By Packaging Type

            18.14.2.4. By Source Type

            18.14.2.5. By Sales Channel

    18.15. Bangladesh

        18.15.1. Pricing Analysis

        18.15.2. Market Share Analysis, 2022

            18.15.2.1. By Product Type

            18.15.2.2. By Price Range

            18.15.2.3. By Packaging Type

            18.15.2.4. By Source Type

            18.15.2.5. By Sales Channel

    18.16. Australia

        18.16.1. Pricing Analysis

        18.16.2. Market Share Analysis, 2022

            18.16.2.1. By Product Type

            18.16.2.2. By Price Range

            18.16.2.3. By Packaging Type

            18.16.2.4. By Source Type

            18.16.2.5. By Sales Channel

    18.17. New Zealand

        18.17.1. Pricing Analysis

        18.17.2. Market Share Analysis, 2022

            18.17.2.1. By Product Type

            18.17.2.2. By Price Range

            18.17.2.3. By Packaging Type

            18.17.2.4. By Source Type

            18.17.2.5. By Sales Channel

    18.18. China

        18.18.1. Pricing Analysis

        18.18.2. Market Share Analysis, 2022

            18.18.2.1. By Product Type

            18.18.2.2. By Price Range

            18.18.2.3. By Packaging Type

            18.18.2.4. By Source Type

            18.18.2.5. By Sales Channel

    18.19. Japan

        18.19.1. Pricing Analysis

        18.19.2. Market Share Analysis, 2022

            18.19.2.1. By Product Type

            18.19.2.2. By Price Range

            18.19.2.3. By Packaging Type

            18.19.2.4. By Source Type

            18.19.2.5. By Sales Channel

    18.20. South Korea

        18.20.1. Pricing Analysis

        18.20.2. Market Share Analysis, 2022

            18.20.2.1. By Product Type

            18.20.2.2. By Price Range

            18.20.2.3. By Packaging Type

            18.20.2.4. By Source Type

            18.20.2.5. By Sales Channel

    18.21. GCC Countries

        18.21.1. Pricing Analysis

        18.21.2. Market Share Analysis, 2022

            18.21.2.1. By Product Type

            18.21.2.2. By Price Range

            18.21.2.3. By Packaging Type

            18.21.2.4. By Source Type

            18.21.2.5. By Sales Channel

    18.22. South Africa

        18.22.1. Pricing Analysis

        18.22.2. Market Share Analysis, 2022

            18.22.2.1. By Product Type

            18.22.2.2. By Price Range

            18.22.2.3. By Packaging Type

            18.22.2.4. By Source Type

            18.22.2.5. By Sales Channel

    18.23. Israel

        18.23.1. Pricing Analysis

        18.23.2. Market Share Analysis, 2022

            18.23.2.1. By Product Type

            18.23.2.2. By Price Range

            18.23.2.3. By Packaging Type

            18.23.2.4. By Source Type

            18.23.2.5. By Sales Channel

19. Market Structure Analysis

    19.1. Competition Dashboard

    19.2. Competition Benchmarking

    19.3. Market Share Analysis of Top Players

        19.3.1. By Regional

        19.3.2. By Product Type

        19.3.3. By Price Range

        19.3.4. By Packaging Type

        19.3.5. By Source Type

        19.3.6. By Sales Channel

20. Competition Analysis

    20.1. Competition Deep Dive

        20.1.1. Cannuka, LLC

            20.1.1.1. Overview

            20.1.1.2. Product Portfolio

            20.1.1.3. Profitability by Market Segments

            20.1.1.4. Sales Footprint

            20.1.1.5. Strategy Overview

                20.1.1.5.1. Marketing Strategy

                20.1.1.5.2. Product Strategy

                20.1.1.5.3. Channel Strategy

        20.1.2. CBD For Life

            20.1.2.1. Overview

            20.1.2.2. Product Portfolio

            20.1.2.3. Profitability by Market Segments

            20.1.2.4. Sales Footprint

            20.1.2.5. Strategy Overview

                20.1.2.5.1. Marketing Strategy

                20.1.2.5.2. Product Strategy

                20.1.2.5.3. Channel Strategy

        20.1.3. Earthly Body

            20.1.3.1. Overview

            20.1.3.2. Product Portfolio

            20.1.3.3. Profitability by Market Segments

            20.1.3.4. Sales Footprint

            20.1.3.5. Strategy Overview

                20.1.3.5.1. Marketing Strategy

                20.1.3.5.2. Product Strategy

                20.1.3.5.3. Channel Strategy

        20.1.4. Elixinol Global Limited

            20.1.4.1. Overview

            20.1.4.2. Product Portfolio

            20.1.4.3. Profitability by Market Segments

            20.1.4.4. Sales Footprint

            20.1.4.5. Strategy Overview

                20.1.4.5.1. Marketing Strategy

                20.1.4.5.2. Product Strategy

                20.1.4.5.3. Channel Strategy

        20.1.5. Endoca Company

            20.1.5.1. Overview

            20.1.5.2. Product Portfolio

            20.1.5.3. Profitability by Market Segments

            20.1.5.4. Sales Footprint

            20.1.5.5. Strategy Overview

                20.1.5.5.1. Marketing Strategy

                20.1.5.5.2. Product Strategy

                20.1.5.5.3. Channel Strategy

        20.1.6. Green Growth Brands

            20.1.6.1. Overview

            20.1.6.2. Product Portfolio

            20.1.6.3. Profitability by Market Segments

            20.1.6.4. Sales Footprint

            20.1.6.5. Strategy Overview

                20.1.6.5.1. Marketing Strategy

                20.1.6.5.2. Product Strategy

                20.1.6.5.3. Channel Strategy

        20.1.7. Herbivorebotanicals

            20.1.7.1. Overview

            20.1.7.2. Product Portfolio

            20.1.7.3. Profitability by Market Segments

            20.1.7.4. Sales Footprint

            20.1.7.5. Strategy Overview

                20.1.7.5.1. Marketing Strategy

                20.1.7.5.2. Product Strategy

                20.1.7.5.3. Channel Strategy

        20.1.8. IldiPekar Skin Care & Spa

            20.1.8.1. Overview

            20.1.8.2. Product Portfolio

            20.1.8.3. Profitability by Market Segments

            20.1.8.4. Sales Footprint

            20.1.8.5. Strategy Overview

                20.1.8.5.1. Marketing Strategy

                20.1.8.5.2. Product Strategy

                20.1.8.5.3. Channel Strategy

        20.1.9. Isodiol International Inc

            20.1.9.1. Overview

            20.1.9.2. Product Portfolio

            20.1.9.3. Profitability by Market Segments

            20.1.9.4. Sales Footprint

            20.1.9.5. Strategy Overview

                20.1.9.5.1. Marketing Strategy

                20.1.9.5.2. Product Strategy

                20.1.9.5.3. Channel Strategy

        20.1.10. Josie Maran Cosmetics

            20.1.10.1. Overview

            20.1.10.2. Product Portfolio

            20.1.10.3. Profitability by Market Segments

            20.1.10.4. Sales Footprint

            20.1.10.5. Strategy Overview

                20.1.10.5.1. Marketing Strategy

                20.1.10.5.2. Product Strategy

                20.1.10.5.3. Channel Strategy

        20.1.11. Kana Skincare

            20.1.11.1. Overview

            20.1.11.2. Product Portfolio

            20.1.11.3. Profitability by Market Segments

            20.1.11.4. Sales Footprint

            20.1.11.5. Strategy Overview

                20.1.11.5.1. Marketing Strategy

                20.1.11.5.2. Product Strategy

                20.1.11.5.3. Channel Strategy

        20.1.12. Kapu Maku LLC (POPULUM)

            20.1.12.1. Overview

            20.1.12.2. Product Portfolio

            20.1.12.3. Profitability by Market Segments

            20.1.12.4. Sales Footprint

            20.1.12.5. Strategy Overview

                20.1.12.5.1. Marketing Strategy

                20.1.12.5.2. Product Strategy

                20.1.12.5.3. Channel Strategy

        20.1.13. Kiehl's LLC

            20.1.13.1. Overview

            20.1.13.2. Product Portfolio

            20.1.13.3. Profitability by Market Segments

            20.1.13.4. Sales Footprint

            20.1.13.5. Strategy Overview

                20.1.13.5.1. Marketing Strategy

                20.1.13.5.2. Product Strategy

                20.1.13.5.3. Channel Strategy

        20.1.14. Kush Creams

            20.1.14.1. Overview

            20.1.14.2. Product Portfolio

            20.1.14.3. Profitability by Market Segments

            20.1.14.4. Sales Footprint

            20.1.14.5. Strategy Overview

                20.1.14.5.1. Marketing Strategy

                20.1.14.5.2. Product Strategy

                20.1.14.5.3. Channel Strategy

        20.1.15. Leef Organics

            20.1.15.1. Overview

            20.1.15.2. Product Portfolio

            20.1.15.3. Profitability by Market Segments

            20.1.15.4. Sales Footprint

            20.1.15.5. Strategy Overview

                20.1.15.5.1. Marketing Strategy

                20.1.15.5.2. Product Strategy

                20.1.15.5.3. Channel Strategy

        20.1.16. Leela Body Care Company

            20.1.16.1. Overview

            20.1.16.2. Product Portfolio

            20.1.16.3. Profitability by Market Segments

            20.1.16.4. Sales Footprint

            20.1.16.5. Strategy Overview

                20.1.16.5.1. Marketing Strategy

                20.1.16.5.2. Product Strategy

                20.1.16.5.3. Channel Strategy

        20.1.17. Lord Jones

            20.1.17.1. Overview

            20.1.17.2. Product Portfolio

            20.1.17.3. Profitability by Market Segments

            20.1.17.4. Sales Footprint

            20.1.17.5. Strategy Overview

                20.1.17.5.1. Marketing Strategy

                20.1.17.5.2. Product Strategy

                20.1.17.5.3. Channel Strategy

        20.1.18. Medical Marijuana Inc

            20.1.18.1. Overview

            20.1.18.2. Product Portfolio

            20.1.18.3. Profitability by Market Segments

            20.1.18.4. Sales Footprint

            20.1.18.5. Strategy Overview

                20.1.18.5.1. Marketing Strategy

                20.1.18.5.2. Product Strategy

                20.1.18.5.3. Channel Strategy

        20.1.19. Myaderm

            20.1.19.1. Overview

            20.1.19.2. Product Portfolio

            20.1.19.3. Profitability by Market Segments

            20.1.19.4. Sales Footprint

            20.1.19.5. Strategy Overview

                20.1.19.5.1. Marketing Strategy

                20.1.19.5.2. Product Strategy

                20.1.19.5.3. Channel Strategy

21. Assumptions & Acronyms Used

22. Research Methodology

Don't pay for what you don't need

Customize your report by selecting specific countries or regions and save 30%!

List of Tables

Table 1: Global Market Value (US$ Million) Forecast by Region, 2018 to 2033

Table 2: Global Market Volume (Units) Forecast by Region, 2018 to 2033

Table 3: Global Market Value (US$ Million) Forecast by Product Type, 2018 to 2033

Table 4: Global Market Volume (Units) Forecast by Product Type, 2018 to 2033

Table 5: Global Market Value (US$ Million) Forecast by Price Range, 2018 to 2033

Table 6: Global Market Volume (Units) Forecast by Price Range, 2018 to 2033

Table 7: Global Market Value (US$ Million) Forecast by Packaging Type, 2018 to 2033

Table 8: Global Market Volume (Units) Forecast by Packaging Type, 2018 to 2033

Table 9: Global Market Value (US$ Million) Forecast by Source Type, 2018 to 2033

Table 10: Global Market Volume (Units) Forecast by Source Type, 2018 to 2033

Table 11: Global Market Value (US$ Million) Forecast by Sales Channel, 2018 to 2033

Table 12: Global Market Volume (Units) Forecast by Sales Channel, 2018 to 2033

Table 13: North America Market Value (US$ Million) Forecast by Country, 2018 to 2033

Table 14: North America Market Volume (Units) Forecast by Country, 2018 to 2033

Table 15: North America Market Value (US$ Million) Forecast by Product Type, 2018 to 2033

Table 16: North America Market Volume (Units) Forecast by Product Type, 2018 to 2033

Table 17: North America Market Value (US$ Million) Forecast by Price Range, 2018 to 2033

Table 18: North America Market Volume (Units) Forecast by Price Range, 2018 to 2033

Table 19: North America Market Value (US$ Million) Forecast by Packaging Type, 2018 to 2033

Table 20: North America Market Volume (Units) Forecast by Packaging Type, 2018 to 2033

Table 21: North America Market Value (US$ Million) Forecast by Source Type, 2018 to 2033

Table 22: North America Market Volume (Units) Forecast by Source Type, 2018 to 2033

Table 23: North America Market Value (US$ Million) Forecast by Sales Channel, 2018 to 2033

Table 24: North America Market Volume (Units) Forecast by Sales Channel, 2018 to 2033

Table 25: Latin America Market Value (US$ Million) Forecast by Country, 2018 to 2033

Table 26: Latin America Market Volume (Units) Forecast by Country, 2018 to 2033

Table 27: Latin America Market Value (US$ Million) Forecast by Product Type, 2018 to 2033

Table 28: Latin America Market Volume (Units) Forecast by Product Type, 2018 to 2033

Table 29: Latin America Market Value (US$ Million) Forecast by Price Range, 2018 to 2033

Table 30: Latin America Market Volume (Units) Forecast by Price Range, 2018 to 2033

Table 31: Latin America Market Value (US$ Million) Forecast by Packaging Type, 2018 to 2033

Table 32: Latin America Market Volume (Units) Forecast by Packaging Type, 2018 to 2033

Table 33: Latin America Market Value (US$ Million) Forecast by Source Type, 2018 to 2033

Table 34: Latin America Market Volume (Units) Forecast by Source Type, 2018 to 2033

Table 35: Latin America Market Value (US$ Million) Forecast by Sales Channel, 2018 to 2033

Table 36: Latin America Market Volume (Units) Forecast by Sales Channel, 2018 to 2033

Table 37: Western Europe Market Value (US$ Million) Forecast by Country, 2018 to 2033

Table 38: Western Europe Market Volume (Units) Forecast by Country, 2018 to 2033

Table 39: Western Europe Market Value (US$ Million) Forecast by Product Type, 2018 to 2033

Table 40: Western Europe Market Volume (Units) Forecast by Product Type, 2018 to 2033

Table 41: Western Europe Market Value (US$ Million) Forecast by Price Range, 2018 to 2033

Table 42: Western Europe Market Volume (Units) Forecast by Price Range, 2018 to 2033

Table 43: Western Europe Market Value (US$ Million) Forecast by Packaging Type, 2018 to 2033

Table 44: Western Europe Market Volume (Units) Forecast by Packaging Type, 2018 to 2033

Table 45: Western Europe Market Value (US$ Million) Forecast by Source Type, 2018 to 2033

Table 46: Western Europe Market Volume (Units) Forecast by Source Type, 2018 to 2033

Table 47: Western Europe Market Value (US$ Million) Forecast by Sales Channel, 2018 to 2033

Table 48: Western Europe Market Volume (Units) Forecast by Sales Channel, 2018 to 2033

Table 49: Eastern Europe Market Value (US$ Million) Forecast by Country, 2018 to 2033

Table 50: Eastern Europe Market Volume (Units) Forecast by Country, 2018 to 2033

Table 51: Eastern Europe Market Value (US$ Million) Forecast by Product Type, 2018 to 2033

Table 52: Eastern Europe Market Volume (Units) Forecast by Product Type, 2018 to 2033

Table 53: Eastern Europe Market Value (US$ Million) Forecast by Price Range, 2018 to 2033

Table 54: Eastern Europe Market Volume (Units) Forecast by Price Range, 2018 to 2033

Table 55: Eastern Europe Market Value (US$ Million) Forecast by Packaging Type, 2018 to 2033

Table 56: Eastern Europe Market Volume (Units) Forecast by Packaging Type, 2018 to 2033

Table 57: Eastern Europe Market Value (US$ Million) Forecast by Source Type, 2018 to 2033

Table 58: Eastern Europe Market Volume (Units) Forecast by Source Type, 2018 to 2033

Table 59: Eastern Europe Market Value (US$ Million) Forecast by Sales Channel, 2018 to 2033

Table 60: Eastern Europe Market Volume (Units) Forecast by Sales Channel, 2018 to 2033

Table 61: South Asia and Pacific Market Value (US$ Million) Forecast by Country, 2018 to 2033

Table 62: South Asia and Pacific Market Volume (Units) Forecast by Country, 2018 to 2033

Table 63: South Asia and Pacific Market Value (US$ Million) Forecast by Product Type, 2018 to 2033

Table 64: South Asia and Pacific Market Volume (Units) Forecast by Product Type, 2018 to 2033

Table 65: South Asia and Pacific Market Value (US$ Million) Forecast by Price Range, 2018 to 2033

Table 66: South Asia and Pacific Market Volume (Units) Forecast by Price Range, 2018 to 2033

Table 67: South Asia and Pacific Market Value (US$ Million) Forecast by Packaging Type, 2018 to 2033

Table 68: South Asia and Pacific Market Volume (Units) Forecast by Packaging Type, 2018 to 2033

Table 69: South Asia and Pacific Market Value (US$ Million) Forecast by Source Type, 2018 to 2033

Table 70: South Asia and Pacific Market Volume (Units) Forecast by Source Type, 2018 to 2033

Table 71: South Asia and Pacific Market Value (US$ Million) Forecast by Sales Channel, 2018 to 2033

Table 72: South Asia and Pacific Market Volume (Units) Forecast by Sales Channel, 2018 to 2033

Table 73: East Asia Market Value (US$ Million) Forecast by Country, 2018 to 2033

Table 74: East Asia Market Volume (Units) Forecast by Country, 2018 to 2033

Table 75: East Asia Market Value (US$ Million) Forecast by Product Type, 2018 to 2033

Table 76: East Asia Market Volume (Units) Forecast by Product Type, 2018 to 2033

Table 77: East Asia Market Value (US$ Million) Forecast by Price Range, 2018 to 2033

Table 78: East Asia Market Volume (Units) Forecast by Price Range, 2018 to 2033

Table 79: East Asia Market Value (US$ Million) Forecast by Packaging Type, 2018 to 2033

Table 80: East Asia Market Volume (Units) Forecast by Packaging Type, 2018 to 2033

Table 81: East Asia Market Value (US$ Million) Forecast by Source Type, 2018 to 2033

Table 82: East Asia Market Volume (Units) Forecast by Source Type, 2018 to 2033

Table 83: East Asia Market Value (US$ Million) Forecast by Sales Channel, 2018 to 2033

Table 84: East Asia Market Volume (Units) Forecast by Sales Channel, 2018 to 2033

Table 85: Middle East and Africa Market Value (US$ Million) Forecast by Country, 2018 to 2033

Table 86: Middle East and Africa Market Volume (Units) Forecast by Country, 2018 to 2033

Table 87: Middle East and Africa Market Value (US$ Million) Forecast by Product Type, 2018 to 2033

Table 88: Middle East and Africa Market Volume (Units) Forecast by Product Type, 2018 to 2033

Table 89: Middle East and Africa Market Value (US$ Million) Forecast by Price Range, 2018 to 2033

Table 90: Middle East and Africa Market Volume (Units) Forecast by Price Range, 2018 to 2033

Table 91: Middle East and Africa Market Value (US$ Million) Forecast by Packaging Type, 2018 to 2033

Table 92: Middle East and Africa Market Volume (Units) Forecast by Packaging Type, 2018 to 2033

Table 93: Middle East and Africa Market Value (US$ Million) Forecast by Source Type, 2018 to 2033

Table 94: Middle East and Africa Market Volume (Units) Forecast by Source Type, 2018 to 2033

Table 95: Middle East and Africa Market Value (US$ Million) Forecast by Sales Channel, 2018 to 2033

Table 96: Middle East and Africa Market Volume (Units) Forecast by Sales Channel, 2018 to 2033
Sneha Verghese
Sneha Verghese

Principal Consultant

Talk to Analyst

Find your sweet spots for generating winning opportunities in this market.

List of Charts

Figure 1: Global Market Value (US$ Million) by Product Type, 2023 to 2033

Figure 2: Global Market Value (US$ Million) by Price Range, 2023 to 2033

Figure 3: Global Market Value (US$ Million) by Packaging Type, 2023 to 2033

Figure 4: Global Market Value (US$ Million) by Source Type, 2023 to 2033

Figure 5: Global Market Value (US$ Million) by Sales Channel, 2023 to 2033

Figure 6: Global Market Value (US$ Million) by Region, 2023 to 2033

Figure 7: Global Market Value (US$ Million) Analysis by Region, 2018 to 2033

Figure 8: Global Market Volume (Units) Analysis by Region, 2018 to 2033

Figure 9: Global Market Value Share (%) and BPS Analysis by Region, 2023 to 2033

Figure 10: Global Market Y-o-Y Growth (%) Projections by Region, 2023 to 2033

Figure 11: Global Market Value (US$ Million) Analysis by Product Type, 2018 to 2033

Figure 12: Global Market Volume (Units) Analysis by Product Type, 2018 to 2033

Figure 13: Global Market Value Share (%) and BPS Analysis by Product Type, 2023 to 2033

Figure 14: Global Market Y-o-Y Growth (%) Projections by Product Type, 2023 to 2033

Figure 15: Global Market Value (US$ Million) Analysis by Price Range, 2018 to 2033

Figure 16: Global Market Volume (Units) Analysis by Price Range, 2018 to 2033

Figure 17: Global Market Value Share (%) and BPS Analysis by Price Range, 2023 to 2033

Figure 18: Global Market Y-o-Y Growth (%) Projections by Price Range, 2023 to 2033

Figure 19: Global Market Value (US$ Million) Analysis by Packaging Type, 2018 to 2033

Figure 20: Global Market Volume (Units) Analysis by Packaging Type, 2018 to 2033

Figure 21: Global Market Value Share (%) and BPS Analysis by Packaging Type, 2023 to 2033

Figure 22: Global Market Y-o-Y Growth (%) Projections by Packaging Type, 2023 to 2033

Figure 23: Global Market Value (US$ Million) Analysis by Source Type, 2018 to 2033

Figure 24: Global Market Volume (Units) Analysis by Source Type, 2018 to 2033

Figure 25: Global Market Value Share (%) and BPS Analysis by Source Type, 2023 to 2033

Figure 26: Global Market Y-o-Y Growth (%) Projections by Source Type, 2023 to 2033

Figure 27: Global Market Value (US$ Million) Analysis by Sales Channel, 2018 to 2033

Figure 28: Global Market Volume (Units) Analysis by Sales Channel, 2018 to 2033

Figure 29: Global Market Value Share (%) and BPS Analysis by Sales Channel, 2023 to 2033

Figure 30: Global Market Y-o-Y Growth (%) Projections by Sales Channel, 2023 to 2033

Figure 31: Global Market Attractiveness by Product Type, 2023 to 2033

Figure 32: Global Market Attractiveness by Price Range, 2023 to 2033

Figure 33: Global Market Attractiveness by Packaging Type, 2023 to 2033

Figure 34: Global Market Attractiveness by Source Type, 2023 to 2033

Figure 35: Global Market Attractiveness by Sales Channel, 2023 to 2033

Figure 36: Global Market Attractiveness by Region, 2023 to 2033

Figure 37: North America Market Value (US$ Million) by Product Type, 2023 to 2033

Figure 38: North America Market Value (US$ Million) by Price Range, 2023 to 2033

Figure 39: North America Market Value (US$ Million) by Packaging Type, 2023 to 2033

Figure 40: North America Market Value (US$ Million) by Source Type, 2023 to 2033

Figure 41: North America Market Value (US$ Million) by Sales Channel, 2023 to 2033

Figure 42: North America Market Value (US$ Million) by Country, 2023 to 2033

Figure 43: North America Market Value (US$ Million) Analysis by Country, 2018 to 2033

Figure 44: North America Market Volume (Units) Analysis by Country, 2018 to 2033

Figure 45: North America Market Value Share (%) and BPS Analysis by Country, 2023 to 2033

Figure 46: North America Market Y-o-Y Growth (%) Projections by Country, 2023 to 2033

Figure 47: North America Market Value (US$ Million) Analysis by Product Type, 2018 to 2033

Figure 48: North America Market Volume (Units) Analysis by Product Type, 2018 to 2033

Figure 49: North America Market Value Share (%) and BPS Analysis by Product Type, 2023 to 2033

Figure 50: North America Market Y-o-Y Growth (%) Projections by Product Type, 2023 to 2033

Figure 51: North America Market Value (US$ Million) Analysis by Price Range, 2018 to 2033

Figure 52: North America Market Volume (Units) Analysis by Price Range, 2018 to 2033

Figure 53: North America Market Value Share (%) and BPS Analysis by Price Range, 2023 to 2033

Figure 54: North America Market Y-o-Y Growth (%) Projections by Price Range, 2023 to 2033

Figure 55: North America Market Value (US$ Million) Analysis by Packaging Type, 2018 to 2033

Figure 56: North America Market Volume (Units) Analysis by Packaging Type, 2018 to 2033

Figure 57: North America Market Value Share (%) and BPS Analysis by Packaging Type, 2023 to 2033

Figure 58: North America Market Y-o-Y Growth (%) Projections by Packaging Type, 2023 to 2033

Figure 59: North America Market Value (US$ Million) Analysis by Source Type, 2018 to 2033

Figure 60: North America Market Volume (Units) Analysis by Source Type, 2018 to 2033

Figure 61: North America Market Value Share (%) and BPS Analysis by Source Type, 2023 to 2033

Figure 62: North America Market Y-o-Y Growth (%) Projections by Source Type, 2023 to 2033

Figure 63: North America Market Value (US$ Million) Analysis by Sales Channel, 2018 to 2033

Figure 64: North America Market Volume (Units) Analysis by Sales Channel, 2018 to 2033

Figure 65: North America Market Value Share (%) and BPS Analysis by Sales Channel, 2023 to 2033

Figure 66: North America Market Y-o-Y Growth (%) Projections by Sales Channel, 2023 to 2033

Figure 67: North America Market Attractiveness by Product Type, 2023 to 2033

Figure 68: North America Market Attractiveness by Price Range, 2023 to 2033

Figure 69: North America Market Attractiveness by Packaging Type, 2023 to 2033

Figure 70: North America Market Attractiveness by Source Type, 2023 to 2033

Figure 71: North America Market Attractiveness by Sales Channel, 2023 to 2033

Figure 72: North America Market Attractiveness by Country, 2023 to 2033

Figure 73: Latin America Market Value (US$ Million) by Product Type, 2023 to 2033

Figure 74: Latin America Market Value (US$ Million) by Price Range, 2023 to 2033

Figure 75: Latin America Market Value (US$ Million) by Packaging Type, 2023 to 2033

Figure 76: Latin America Market Value (US$ Million) by Source Type, 2023 to 2033

Figure 77: Latin America Market Value (US$ Million) by Sales Channel, 2023 to 2033

Figure 78: Latin America Market Value (US$ Million) by Country, 2023 to 2033

Figure 79: Latin America Market Value (US$ Million) Analysis by Country, 2018 to 2033

Figure 80: Latin America Market Volume (Units) Analysis by Country, 2018 to 2033

Figure 81: Latin America Market Value Share (%) and BPS Analysis by Country, 2023 to 2033

Figure 82: Latin America Market Y-o-Y Growth (%) Projections by Country, 2023 to 2033

Figure 83: Latin America Market Value (US$ Million) Analysis by Product Type, 2018 to 2033

Figure 84: Latin America Market Volume (Units) Analysis by Product Type, 2018 to 2033

Figure 85: Latin America Market Value Share (%) and BPS Analysis by Product Type, 2023 to 2033

Figure 86: Latin America Market Y-o-Y Growth (%) Projections by Product Type, 2023 to 2033

Figure 87: Latin America Market Value (US$ Million) Analysis by Price Range, 2018 to 2033

Figure 88: Latin America Market Volume (Units) Analysis by Price Range, 2018 to 2033

Figure 89: Latin America Market Value Share (%) and BPS Analysis by Price Range, 2023 to 2033

Figure 90: Latin America Market Y-o-Y Growth (%) Projections by Price Range, 2023 to 2033

Figure 91: Latin America Market Value (US$ Million) Analysis by Packaging Type, 2018 to 2033

Figure 92: Latin America Market Volume (Units) Analysis by Packaging Type, 2018 to 2033

Figure 93: Latin America Market Value Share (%) and BPS Analysis by Packaging Type, 2023 to 2033

Figure 94: Latin America Market Y-o-Y Growth (%) Projections by Packaging Type, 2023 to 2033

Figure 95: Latin America Market Value (US$ Million) Analysis by Source Type, 2018 to 2033

Figure 96: Latin America Market Volume (Units) Analysis by Source Type, 2018 to 2033

Figure 97: Latin America Market Value Share (%) and BPS Analysis by Source Type, 2023 to 2033

Figure 98: Latin America Market Y-o-Y Growth (%) Projections by Source Type, 2023 to 2033

Figure 99: Latin America Market Value (US$ Million) Analysis by Sales Channel, 2018 to 2033

Figure 100: Latin America Market Volume (Units) Analysis by Sales Channel, 2018 to 2033

Figure 101: Latin America Market Value Share (%) and BPS Analysis by Sales Channel, 2023 to 2033

Figure 102: Latin America Market Y-o-Y Growth (%) Projections by Sales Channel, 2023 to 2033

Figure 103: Latin America Market Attractiveness by Product Type, 2023 to 2033

Figure 104: Latin America Market Attractiveness by Price Range, 2023 to 2033

Figure 105: Latin America Market Attractiveness by Packaging Type, 2023 to 2033

Figure 106: Latin America Market Attractiveness by Source Type, 2023 to 2033

Figure 107: Latin America Market Attractiveness by Sales Channel, 2023 to 2033

Figure 108: Latin America Market Attractiveness by Country, 2023 to 2033

Figure 109: Western Europe Market Value (US$ Million) by Product Type, 2023 to 2033

Figure 110: Western Europe Market Value (US$ Million) by Price Range, 2023 to 2033

Figure 111: Western Europe Market Value (US$ Million) by Packaging Type, 2023 to 2033

Figure 112: Western Europe Market Value (US$ Million) by Source Type, 2023 to 2033

Figure 113: Western Europe Market Value (US$ Million) by Sales Channel, 2023 to 2033

Figure 114: Western Europe Market Value (US$ Million) by Country, 2023 to 2033

Figure 115: Western Europe Market Value (US$ Million) Analysis by Country, 2018 to 2033

Figure 116: Western Europe Market Volume (Units) Analysis by Country, 2018 to 2033

Figure 117: Western Europe Market Value Share (%) and BPS Analysis by Country, 2023 to 2033

Figure 118: Western Europe Market Y-o-Y Growth (%) Projections by Country, 2023 to 2033

Figure 119: Western Europe Market Value (US$ Million) Analysis by Product Type, 2018 to 2033

Figure 120: Western Europe Market Volume (Units) Analysis by Product Type, 2018 to 2033

Figure 121: Western Europe Market Value Share (%) and BPS Analysis by Product Type, 2023 to 2033

Figure 122: Western Europe Market Y-o-Y Growth (%) Projections by Product Type, 2023 to 2033

Figure 123: Western Europe Market Value (US$ Million) Analysis by Price Range, 2018 to 2033

Figure 124: Western Europe Market Volume (Units) Analysis by Price Range, 2018 to 2033

Figure 125: Western Europe Market Value Share (%) and BPS Analysis by Price Range, 2023 to 2033

Figure 126: Western Europe Market Y-o-Y Growth (%) Projections by Price Range, 2023 to 2033

Figure 127: Western Europe Market Value (US$ Million) Analysis by Packaging Type, 2018 to 2033

Figure 128: Western Europe Market Volume (Units) Analysis by Packaging Type, 2018 to 2033

Figure 129: Western Europe Market Value Share (%) and BPS Analysis by Packaging Type, 2023 to 2033

Figure 130: Western Europe Market Y-o-Y Growth (%) Projections by Packaging Type, 2023 to 2033

Figure 131: Western Europe Market Value (US$ Million) Analysis by Source Type, 2018 to 2033

Figure 132: Western Europe Market Volume (Units) Analysis by Source Type, 2018 to 2033

Figure 133: Western Europe Market Value Share (%) and BPS Analysis by Source Type, 2023 to 2033

Figure 134: Western Europe Market Y-o-Y Growth (%) Projections by Source Type, 2023 to 2033

Figure 135: Western Europe Market Value (US$ Million) Analysis by Sales Channel, 2018 to 2033

Figure 136: Western Europe Market Volume (Units) Analysis by Sales Channel, 2018 to 2033

Figure 137: Western Europe Market Value Share (%) and BPS Analysis by Sales Channel, 2023 to 2033

Figure 138: Western Europe Market Y-o-Y Growth (%) Projections by Sales Channel, 2023 to 2033

Figure 139: Western Europe Market Attractiveness by Product Type, 2023 to 2033

Figure 140: Western Europe Market Attractiveness by Price Range, 2023 to 2033

Figure 141: Western Europe Market Attractiveness by Packaging Type, 2023 to 2033

Figure 142: Western Europe Market Attractiveness by Source Type, 2023 to 2033

Figure 143: Western Europe Market Attractiveness by Sales Channel, 2023 to 2033

Figure 144: Western Europe Market Attractiveness by Country, 2023 to 2033

Figure 145: Eastern Europe Market Value (US$ Million) by Product Type, 2023 to 2033

Figure 146: Eastern Europe Market Value (US$ Million) by Price Range, 2023 to 2033

Figure 147: Eastern Europe Market Value (US$ Million) by Packaging Type, 2023 to 2033

Figure 148: Eastern Europe Market Value (US$ Million) by Source Type, 2023 to 2033

Figure 149: Eastern Europe Market Value (US$ Million) by Sales Channel, 2023 to 2033

Figure 150: Eastern Europe Market Value (US$ Million) by Country, 2023 to 2033

Figure 151: Eastern Europe Market Value (US$ Million) Analysis by Country, 2018 to 2033

Figure 152: Eastern Europe Market Volume (Units) Analysis by Country, 2018 to 2033

Figure 153: Eastern Europe Market Value Share (%) and BPS Analysis by Country, 2023 to 2033

Figure 154: Eastern Europe Market Y-o-Y Growth (%) Projections by Country, 2023 to 2033

Figure 155: Eastern Europe Market Value (US$ Million) Analysis by Product Type, 2018 to 2033

Figure 156: Eastern Europe Market Volume (Units) Analysis by Product Type, 2018 to 2033

Figure 157: Eastern Europe Market Value Share (%) and BPS Analysis by Product Type, 2023 to 2033

Figure 158: Eastern Europe Market Y-o-Y Growth (%) Projections by Product Type, 2023 to 2033

Figure 159: Eastern Europe Market Value (US$ Million) Analysis by Price Range, 2018 to 2033

Figure 160: Eastern Europe Market Volume (Units) Analysis by Price Range, 2018 to 2033

Figure 161: Eastern Europe Market Value Share (%) and BPS Analysis by Price Range, 2023 to 2033

Figure 162: Eastern Europe Market Y-o-Y Growth (%) Projections by Price Range, 2023 to 2033

Figure 163: Eastern Europe Market Value (US$ Million) Analysis by Packaging Type, 2018 to 2033

Figure 164: Eastern Europe Market Volume (Units) Analysis by Packaging Type, 2018 to 2033

Figure 165: Eastern Europe Market Value Share (%) and BPS Analysis by Packaging Type, 2023 to 2033

Figure 166: Eastern Europe Market Y-o-Y Growth (%) Projections by Packaging Type, 2023 to 2033

Figure 167: Eastern Europe Market Value (US$ Million) Analysis by Source Type, 2018 to 2033

Figure 168: Eastern Europe Market Volume (Units) Analysis by Source Type, 2018 to 2033

Figure 169: Eastern Europe Market Value Share (%) and BPS Analysis by Source Type, 2023 to 2033

Figure 170: Eastern Europe Market Y-o-Y Growth (%) Projections by Source Type, 2023 to 2033

Figure 171: Eastern Europe Market Value (US$ Million) Analysis by Sales Channel, 2018 to 2033

Figure 172: Eastern Europe Market Volume (Units) Analysis by Sales Channel, 2018 to 2033

Figure 173: Eastern Europe Market Value Share (%) and BPS Analysis by Sales Channel, 2023 to 2033

Figure 174: Eastern Europe Market Y-o-Y Growth (%) Projections by Sales Channel, 2023 to 2033

Figure 175: Eastern Europe Market Attractiveness by Product Type, 2023 to 2033

Figure 176: Eastern Europe Market Attractiveness by Price Range, 2023 to 2033

Figure 177: Eastern Europe Market Attractiveness by Packaging Type, 2023 to 2033

Figure 178: Eastern Europe Market Attractiveness by Source Type, 2023 to 2033

Figure 179: Eastern Europe Market Attractiveness by Sales Channel, 2023 to 2033

Figure 180: Eastern Europe Market Attractiveness by Country, 2023 to 2033

Figure 181: South Asia and Pacific Market Value (US$ Million) by Product Type, 2023 to 2033

Figure 182: South Asia and Pacific Market Value (US$ Million) by Price Range, 2023 to 2033

Figure 183: South Asia and Pacific Market Value (US$ Million) by Packaging Type, 2023 to 2033

Figure 184: South Asia and Pacific Market Value (US$ Million) by Source Type, 2023 to 2033

Figure 185: South Asia and Pacific Market Value (US$ Million) by Sales Channel, 2023 to 2033

Figure 186: South Asia and Pacific Market Value (US$ Million) by Country, 2023 to 2033

Figure 187: South Asia and Pacific Market Value (US$ Million) Analysis by Country, 2018 to 2033

Figure 188: South Asia and Pacific Market Volume (Units) Analysis by Country, 2018 to 2033

Figure 189: South Asia and Pacific Market Value Share (%) and BPS Analysis by Country, 2023 to 2033

Figure 190: South Asia and Pacific Market Y-o-Y Growth (%) Projections by Country, 2023 to 2033

Figure 191: South Asia and Pacific Market Value (US$ Million) Analysis by Product Type, 2018 to 2033

Figure 192: South Asia and Pacific Market Volume (Units) Analysis by Product Type, 2018 to 2033

Figure 193: South Asia and Pacific Market Value Share (%) and BPS Analysis by Product Type, 2023 to 2033

Figure 194: South Asia and Pacific Market Y-o-Y Growth (%) Projections by Product Type, 2023 to 2033

Figure 195: South Asia and Pacific Market Value (US$ Million) Analysis by Price Range, 2018 to 2033

Figure 196: South Asia and Pacific Market Volume (Units) Analysis by Price Range, 2018 to 2033

Figure 197: South Asia and Pacific Market Value Share (%) and BPS Analysis by Price Range, 2023 to 2033

Figure 198: South Asia and Pacific Market Y-o-Y Growth (%) Projections by Price Range, 2023 to 2033

Figure 199: South Asia and Pacific Market Value (US$ Million) Analysis by Packaging Type, 2018 to 2033

Figure 200: South Asia and Pacific Market Volume (Units) Analysis by Packaging Type, 2018 to 2033

Figure 201: South Asia and Pacific Market Value Share (%) and BPS Analysis by Packaging Type, 2023 to 2033

Figure 202: South Asia and Pacific Market Y-o-Y Growth (%) Projections by Packaging Type, 2023 to 2033

Figure 203: South Asia and Pacific Market Value (US$ Million) Analysis by Source Type, 2018 to 2033

Figure 204: South Asia and Pacific Market Volume (Units) Analysis by Source Type, 2018 to 2033

Figure 205: South Asia and Pacific Market Value Share (%) and BPS Analysis by Source Type, 2023 to 2033

Figure 206: South Asia and Pacific Market Y-o-Y Growth (%) Projections by Source Type, 2023 to 2033

Figure 207: South Asia and Pacific Market Value (US$ Million) Analysis by Sales Channel, 2018 to 2033

Figure 208: South Asia and Pacific Market Volume (Units) Analysis by Sales Channel, 2018 to 2033

Figure 209: South Asia and Pacific Market Value Share (%) and BPS Analysis by Sales Channel, 2023 to 2033

Figure 210: South Asia and Pacific Market Y-o-Y Growth (%) Projections by Sales Channel, 2023 to 2033

Figure 211: South Asia and Pacific Market Attractiveness by Product Type, 2023 to 2033

Figure 212: South Asia and Pacific Market Attractiveness by Price Range, 2023 to 2033

Figure 213: South Asia and Pacific Market Attractiveness by Packaging Type, 2023 to 2033

Figure 214: South Asia and Pacific Market Attractiveness by Source Type, 2023 to 2033

Figure 215: South Asia and Pacific Market Attractiveness by Sales Channel, 2023 to 2033

Figure 216: South Asia and Pacific Market Attractiveness by Country, 2023 to 2033

Figure 217: East Asia Market Value (US$ Million) by Product Type, 2023 to 2033

Figure 218: East Asia Market Value (US$ Million) by Price Range, 2023 to 2033

Figure 219: East Asia Market Value (US$ Million) by Packaging Type, 2023 to 2033

Figure 220: East Asia Market Value (US$ Million) by Source Type, 2023 to 2033

Figure 221: East Asia Market Value (US$ Million) by Sales Channel, 2023 to 2033

Figure 222: East Asia Market Value (US$ Million) by Country, 2023 to 2033

Figure 223: East Asia Market Value (US$ Million) Analysis by Country, 2018 to 2033

Figure 224: East Asia Market Volume (Units) Analysis by Country, 2018 to 2033

Figure 225: East Asia Market Value Share (%) and BPS Analysis by Country, 2023 to 2033

Figure 226: East Asia Market Y-o-Y Growth (%) Projections by Country, 2023 to 2033

Figure 227: East Asia Market Value (US$ Million) Analysis by Product Type, 2018 to 2033

Figure 228: East Asia Market Volume (Units) Analysis by Product Type, 2018 to 2033

Figure 229: East Asia Market Value Share (%) and BPS Analysis by Product Type, 2023 to 2033

Figure 230: East Asia Market Y-o-Y Growth (%) Projections by Product Type, 2023 to 2033

Figure 231: East Asia Market Value (US$ Million) Analysis by Price Range, 2018 to 2033

Figure 232: East Asia Market Volume (Units) Analysis by Price Range, 2018 to 2033

Figure 233: East Asia Market Value Share (%) and BPS Analysis by Price Range, 2023 to 2033

Figure 234: East Asia Market Y-o-Y Growth (%) Projections by Price Range, 2023 to 2033

Figure 235: East Asia Market Value (US$ Million) Analysis by Packaging Type, 2018 to 2033

Figure 236: East Asia Market Volume (Units) Analysis by Packaging Type, 2018 to 2033

Figure 237: East Asia Market Value Share (%) and BPS Analysis by Packaging Type, 2023 to 2033

Figure 238: East Asia Market Y-o-Y Growth (%) Projections by Packaging Type, 2023 to 2033

Figure 239: East Asia Market Value (US$ Million) Analysis by Source Type, 2018 to 2033

Figure 240: East Asia Market Volume (Units) Analysis by Source Type, 2018 to 2033

Figure 241: East Asia Market Value Share (%) and BPS Analysis by Source Type, 2023 to 2033

Figure 242: East Asia Market Y-o-Y Growth (%) Projections by Source Type, 2023 to 2033

Figure 243: East Asia Market Value (US$ Million) Analysis by Sales Channel, 2018 to 2033

Figure 244: East Asia Market Volume (Units) Analysis by Sales Channel, 2018 to 2033

Figure 245: East Asia Market Value Share (%) and BPS Analysis by Sales Channel, 2023 to 2033

Figure 246: East Asia Market Y-o-Y Growth (%) Projections by Sales Channel, 2023 to 2033

Figure 247: East Asia Market Attractiveness by Product Type, 2023 to 2033

Figure 248: East Asia Market Attractiveness by Price Range, 2023 to 2033

Figure 249: East Asia Market Attractiveness by Packaging Type, 2023 to 2033

Figure 250: East Asia Market Attractiveness by Source Type, 2023 to 2033

Figure 251: East Asia Market Attractiveness by Sales Channel, 2023 to 2033

Figure 252: East Asia Market Attractiveness by Country, 2023 to 2033

Figure 253: Middle East and Africa Market Value (US$ Million) by Product Type, 2023 to 2033

Figure 254: Middle East and Africa Market Value (US$ Million) by Price Range, 2023 to 2033

Figure 255: Middle East and Africa Market Value (US$ Million) by Packaging Type, 2023 to 2033

Figure 256: Middle East and Africa Market Value (US$ Million) by Source Type, 2023 to 2033

Figure 257: Middle East and Africa Market Value (US$ Million) by Sales Channel, 2023 to 2033

Figure 258: Middle East and Africa Market Value (US$ Million) by Country, 2023 to 2033

Figure 259: Middle East and Africa Market Value (US$ Million) Analysis by Country, 2018 to 2033

Figure 260: Middle East and Africa Market Volume (Units) Analysis by Country, 2018 to 2033

Figure 261: Middle East and Africa Market Value Share (%) and BPS Analysis by Country, 2023 to 2033

Figure 262: Middle East and Africa Market Y-o-Y Growth (%) Projections by Country, 2023 to 2033

Figure 263: Middle East and Africa Market Value (US$ Million) Analysis by Product Type, 2018 to 2033

Figure 264: Middle East and Africa Market Volume (Units) Analysis by Product Type, 2018 to 2033

Figure 265: Middle East and Africa Market Value Share (%) and BPS Analysis by Product Type, 2023 to 2033

Figure 266: Middle East and Africa Market Y-o-Y Growth (%) Projections by Product Type, 2023 to 2033

Figure 267: Middle East and Africa Market Value (US$ Million) Analysis by Price Range, 2018 to 2033

Figure 268: Middle East and Africa Market Volume (Units) Analysis by Price Range, 2018 to 2033

Figure 269: Middle East and Africa Market Value Share (%) and BPS Analysis by Price Range, 2023 to 2033

Figure 270: Middle East and Africa Market Y-o-Y Growth (%) Projections by Price Range, 2023 to 2033

Figure 271: Middle East and Africa Market Value (US$ Million) Analysis by Packaging Type, 2018 to 2033

Figure 272: Middle East and Africa Market Volume (Units) Analysis by Packaging Type, 2018 to 2033

Figure 273: Middle East and Africa Market Value Share (%) and BPS Analysis by Packaging Type, 2023 to 2033

Figure 274: Middle East and Africa Market Y-o-Y Growth (%) Projections by Packaging Type, 2023 to 2033

Figure 275: Middle East and Africa Market Value (US$ Million) Analysis by Source Type, 2018 to 2033

Figure 276: Middle East and Africa Market Volume (Units) Analysis by Source Type, 2018 to 2033

Figure 277: Middle East and Africa Market Value Share (%) and BPS Analysis by Source Type, 2023 to 2033

Figure 278: Middle East and Africa Market Y-o-Y Growth (%) Projections by Source Type, 2023 to 2033

Figure 279: Middle East and Africa Market Value (US$ Million) Analysis by Sales Channel, 2018 to 2033

Figure 280: Middle East and Africa Market Volume (Units) Analysis by Sales Channel, 2018 to 2033

Figure 281: Middle East and Africa Market Value Share (%) and BPS Analysis by Sales Channel, 2023 to 2033

Figure 282: Middle East and Africa Market Y-o-Y Growth (%) Projections by Sales Channel, 2023 to 2033

Figure 283: Middle East and Africa Market Attractiveness by Product Type, 2023 to 2033

Figure 284: Middle East and Africa Market Attractiveness by Price Range, 2023 to 2033

Figure 285: Middle East and Africa Market Attractiveness by Packaging Type, 2023 to 2033

Figure 286: Middle East and Africa Market Attractiveness by Source Type, 2023 to 2033

Figure 287: Middle East and Africa Market Attractiveness by Sales Channel, 2023 to 2033

Figure 288: Middle East and Africa Market Attractiveness by Country, 2023 to 2033

Recommendations

Consumer Product

Skin Lightening Product Market

Published : January 2024

Consumer Product

Anti-wrinkle Product Market

Published : October 2023

Explore Consumer Product Insights

View Reports