Reports

- Global Locations -

Headquarters

Future Market Insights, Inc.

Christiana Corporate, 200
Continental Drive, Suite 401,
Newark, Delaware - 19713,
United States

T: +1-845-579-5705

Americas

Future Market Insights, Inc.

616 Corporate Way, Suite 2-9018,
Valley Cottage, NY 10989, United States

T: +1-347-918-3531

MEA

Future Market Insights

1602-6 Jumeirah Bay X2 Tower, Plot No: JLT-PH2-X2A,
Jumeirah Lakes Towers, Dubai,
United Arab Emirates

Europe

Future Market Insights

3rd Floor, 207 Regent Street,
W1B 3HH London
United Kingdom

T: + 44 (0) 20 8123 9659
D: +44 (0) 20 3287 4268

Asia Pacific

Future Market Insights

IndiaLand Global Tech Park, Unit UG-1, Behind Grand HighStreet, Phase 1, Hinjawadi, MH, Pune – 411057, India

Biomass Gasification Market Outlook from 2024 to 2034

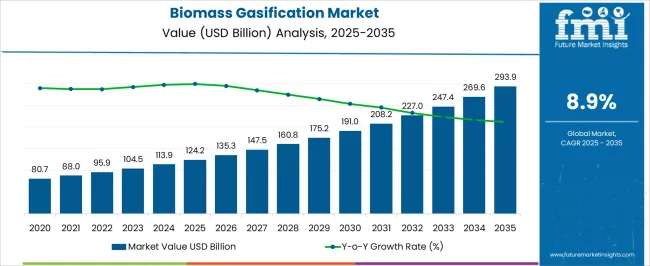
The biomass gasification market is projected to be worth US$ 114.0 billion in 2024. The market is anticipated to reach US$ 268.0 billion by 2034. The market is further expected to surge at a CAGR of 8.9% during the forecast period 2024 to 2034.

Key Market Trends and Highlights

Biomass gasification offers a potential solution for enhancing energy security by diversifying the energy mix. It can provide a reliable and continuous source of renewable energy, reducing dependence on non renewable resources.

  • Ongoing advancements in gasification technologies have improved efficiency, lowered costs, and increased the overall viability of biomass gasification as a source of energy. Research and development in this field are expected to continue, further enhancing the market.
  • Biomass gasification can utilize various feedstocks, including agricultural residues, forestry waste, and municipal solid waste. Biomass gasification becomes a valuable option for converting organic waste into energy, as waste to energy initiatives gain traction.
  • Biomass gasification can provide opportunities for rural development by utilizing locally available biomass resources. The decentralized approach can contribute to economic growth in rural areas.
Attributes Key Insights
Biomass Gasification Market Estimated Size in 2024 US$ 114.0 billion
Projected Market Value in 2034 US$ 268.0 billion
Value-based CAGR from 2024 to 2034 8.9

Don't pay for what you don't need

Customize your report by selecting specific countries or regions and save 30%!

2019 to 2023 Historical Analysis vs. 2024 to 2034 Market Forecast Projections

The scope for biomass gasification rose at an 11.1% CAGR between 2019 and 2023. The global market for biomass gasification is anticipated to grow at a moderate CAGR of 8.9% over the forecast period 2024 to 2034.

The market experienced steady growth during the historical period from 2019 to 2023. The period saw a continued rise in global demand for renewable energy sources, driven by environmental concerns, government policies, and corporate sustainability goals. Biomass gasification, as a renewable energy technology, gained attention during this time.

  • Many governments worldwide were implementing policies and providing incentives to promote renewable energy adoption. The biomass gasification market had benefited from supportive regulatory frameworks, subsidies, and tax credits during this period.
  • The integration of biomass gasification with other energy systems, such as combined heat and power and hybrid energy projects, were a notable trend. The integration enhances the overall efficiency and appeal of biomass gasification.

Looking ahead to the forecast period from 2024 to 2034, the market is expected to witness significant growth. Forecasts anticipate further technological innovation in biomass gasification, leading to even higher efficiencies, lower costs, and improved environmental performance. Research and development efforts are expected to focus on addressing any existing challenges and optimizing the technology.

  • The global push toward a cleaner and more sustainable energy mix is expected to continue. Biomass gasification is anticipated to play a crucial role in this transition, especially in industries where electrification is challenging.
  • Projections highlight the role of biomass gasification in rural development, both in developed and developing regions, which includes creating jobs, supporting local economies, and providing reliable energy access.

Biomass Gasification Market Key Drivers

Many governments offer incentives, subsidies, and tax benefits to encourage the adoption of renewable energy technologies, including biomass gasification. The financial incentives play a crucial role in promoting market growth.

  • Biomass gasification can be integrated with other energy systems, such as combined heat and power plants, enhancing its versatility and attractiveness to a wide range of applications.
  • Growing awareness and commitments to carbon neutrality by various countries and corporations are driving the adoption of biomass gasification as it is considered a carbon neutral or low carbon technology, especially when using sustainably sourced biomass.
  • Ongoing research is focused on exploring new and innovative biomass feedstock sources, including algae, energy crops, and agricultural residues. Diversifying feedstock options can enhance the resilience and sustainability of biomass gasification projects.
Nikhil Kaitwade
Nikhil Kaitwade

Principal Consultant

Talk to Analyst

Find your sweet spots for generating winning opportunities in this market.

Challenges in the Biomass Gasification Market

Biomass gasification projects often involve significant upfront capital investments. High initial costs for equipment, technology, and infrastructure can act as a barrier to entry for potential investors and limit the widespread adoption of biomass gasification.

  • Biomass gasification processes are complex, and technical challenges can arise in terms of gasifier efficiency, feedstock variability, and system reliability. Addressing these technical issues requires ongoing research and development efforts.
  • Biomass gasification competes with other renewable energy technologies such as solar and wind power. The cost competitiveness and intermittency of these alternatives can impact the market share of biomass gasification in the overall renewable energy landscape.
  • The reliable and cost effective supply of biomass feedstock can be challenging, especially in regions where dedicated feedstock infrastructure is lacking. Logistical issues in the biomass supply chain can affect the viability and efficiency of biomass gasification projects.

Comparative View of Adjacent Industries

Future Market Insights has compared two other industries, biomass pellets market, and biogas market. Increased collaboration between governments, research institutions, and private enterprises is fostering innovation and accelerating the development of biomass gasification technologies. Public private partnerships can provide the necessary resources for large scale projects.

The biomass pellets market is influenced by factors such as rising consumer awareness. Ongoing advancements in pelletization technology contribute to increased efficiency, consistency, and cost effectiveness in biomass pellet production. Improved technologies enhance the quality of pellets and expand their range of applications.

The biogas market is driven by the climate change mitigation. The need to mitigate climate change and reduce greenhouse gas emissions is driving the adoption of cleaner energy alternatives. Biogas production from organic waste helps capture methane, a potent greenhouse gas, and convert it into a useful energy source, contributing to climate change mitigation.

Biomass Gasification Market:

CAGR from 2024 to 2034 8.9%
Key Trends
  • The increasing global demand for renewable energy sources has been driving interest in biomass gasification. Governments and industries are seeking cleaner and sustainable alternatives to traditional fossil fuels.
  • Stringent environmental regulations and policies aimed at reducing greenhouse gas emissions have created a favorable environment for biomass gasification. Governments around the world are encouraging the use of cleaner technologies to combat climate change.
Opportunity
  • The increasing awareness and global focus on sustainable development are driving industries to explore and invest in cleaner and more sustainable energy solutions, including biomass gasification.
  • The biomass gasification market is witnessing growth in emerging economies where there is a need for affordable and sustainable energy solutions to support growing industrialization and urbanization.

Biomass Pellets Market:

CAGR from 2023 to 2033 6.7%
Key Trends
  • Co firing biomass pellets with coal in existing power plants is a strategy to reduce greenhouse gas emissions and transition to renewable energy. Policies promoting biomass co firing contribute to the growth of the biomass pellets market.
  • Biomass pellets are a popular choice for residential heating systems, especially in regions with a focus on renewable heating solutions. Pellet stoves and boilers provide a clean and efficient option for space and water heating in homes.
Opportunity
  • Biomass pellets are used in various industrial processes, such as heating, drying, and steam generation. Industries looking to reduce their carbon footprint and comply with environmental regulations are turning to biomass pellets as a sustainable energy source.
  • The broader growth of the bioenergy sector, including biofuels and biogas, positively influences the demand for biomass pellets. Biomass serves as a feedstock for the production of bioenergy, contributing to the overall growth of the bio based energy industry.

Biogas Market:

CAGR from 2023 to 2033 6.3%
Key Trends
  • Biogas is produced through the anaerobic digestion of organic waste, including agricultural residues, municipal solid waste, and wastewater. The integration of biogas production with waste management practices provides a sustainable solution for organic waste treatment.
  • Supportive government policies, incentives, and subsidies for biogas projects encourage investment and development in the sector. Feed in tariffs, tax credits, and financial incentives play a crucial role in boosting the economic viability of biogas projects.
Opportunity
  • Biogas contributes to energy security by diversifying the energy mix. The decentralized nature of biogas production allows for the generation of energy close to the source of organic waste, reducing dependence on centralized power generation.
  • Biogas can be produced at various scales, making it suitable for decentralized energy systems. Small scale biogas plants can serve local communities, industries, and agricultural operations, enhancing energy resilience.

Get the data you need at a Fraction of the cost

Personalize your report by choosing insights you need
and save 40%!

Country-wise Insights

The below table showcases revenues in terms of the top 5 leading countries, spearheaded by Korea and Japan. The countries are expected to lead the market through 2034.

Forecast CAGRs from 2024 to 2034

The United States 9.2%
China 9.5%
The United Kingdom 10.0%
Japan 10.3%
Korea 13.1%

Renewable Portfolio Standards Driving the Market in the United States

The biomass gasification market in the United States expected to expand at a CAGR of 9.2% through 2034. Many states in the country have established renewable portfolio standards, which mandate a certain percentage of electricity to be generated from renewable sources. Biomass gasification, as a form of renewable energy, can contribute to meeting these standards and targets.

  • The commitment of the government to addressing climate change and reducing greenhouse gas emissions creates a favorable environment for renewable energy technologies, including biomass gasification. Biomass gasification helps reduce reliance on fossil fuels and contributes to a low carbon energy mix.
  • The United States has abundant sources of biomass feedstocks, including agricultural residues, forestry waste, and dedicated energy crops. The availability of diverse and sustainable biomass feedstocks supports the development of biomass gasification projects.

Phasing Out of Coal to Accelerate Market Growth in the United Kingdom

The biomass gasification market in the United Kingdom is anticipated to expand at a CAGR of 10.0% through 2034. The government of the country has announced plans to phase out coal fired power plants, leading to a transition to cleaner energy sources. Biomass gasification can be a viable alternative, particularly for combined heat and power applications, helping to meet the demand for cleaner energy.

  • The United Kingdom has expressed interest in bioenergy with carbon capture and storage as a technology to achieve negative carbon emissions. Biomass gasification, when integrated with carbon capture and storage, aligns with these goals and can receive support for development.
  • Diversification of the energy mix contributes to energy security by reducing dependence on imported fossil fuels. Biomass gasification provides a domestically available and sustainable source of energy, contributing to the energy security objectives of the country.

Decentralized Energy Generation Spearhead the Market in China

Biomass gasification trends in China are taking a turn for the better. A 9.5% CAGR is forecast for the country from 2024 to 2034. Addressing air quality concerns and reducing pollution are top priorities for the Chinese government. Biomass gasification offers a cleaner alternative to traditional biomass combustion and can contribute to improving air quality by reducing emissions.

  • Biomass gasification supports decentralized energy generation, allowing for the utilization of locally available biomass resources. The approach can enhance energy resilience and provide reliable power to rural and off grid areas.
  • The deployment of biomass gasification projects in rural areas can create economic opportunities, support local farmers, and contribute to rural development. The decentralized approach aligns with broader goals of poverty reduction and rural revitalization in the country.

International Collaboration Fueling the Market in Japan

The biomass gasification market in Japan is poised to expand at a CAGR of 10.3% through 2034. Japan actively engages in international collaborations focused on clean energy and sustainable development. Collaboration with other countries and organizations facilitates knowledge exchange and technology transfer in the biomass gasification sector.

  • Japan has set goals for achieving carbon neutrality by 2050. Biomass gasification, as a carbon neutral technology, aligns with these long term commitments and can play a role in the transition to a low carbon economy.
  • Availability of investment and financing support, including green finance initiatives, can drive the development and implementation of biomass gasification projects in Japan. Financial incentives contribute to the economic viability of such projects.

Smart Grid Development Driving the Demand in Korea

The biomass gasification market in Korea is anticipated to expand at a CAGR of 13.1% through 2034. The focus of the country on developing smart grids and enhancing grid infrastructure creates opportunities for integrating biomass gasification projects. Smart grid technologies enable efficient integration of renewable energy sources, including biomass.

  • Government initiatives promoting energy efficiency in various sectors can drive the adoption of biomass gasification. The potential of the technology to provide both heat and power in a highly efficient manner aligns with energy saving goals.
  • Ongoing investments in research and development activities related to biomass gasification technologies contribute to innovation and improved performance. The commitment to research and development in Korea supports the advancement of clean energy solutions.

Category-wise Insights

The below table highlights how wood segment is projected to lead the market in terms of fuel type, and is expected to account for a CAGR of 8.6% through 2034. Based on application, the chemicals segment is expected to account for a CAGR of 8.3% through 2034.

Category CAGR from 2024 to 2034
Wood 8.6%
Chemicals 8.3%

Wood Claims High Demand for Biomass Gasification

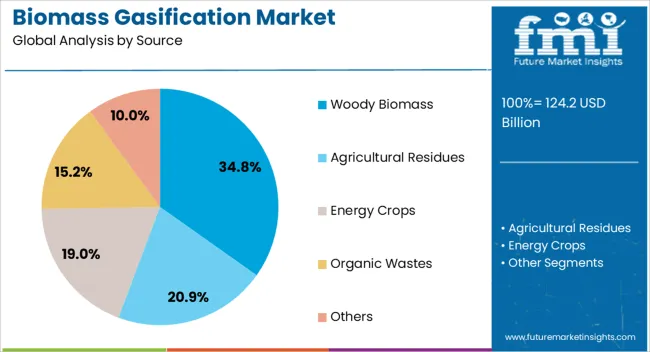
Based on fuel type, the wood segment is expected to continue dominating the biomass gasification market. Wood is a widely available and abundant biomass resource. It includes various forms such as wood chips, sawdust, forestry residues, and other woody materials. The ready availability of wood feedstock makes it a convenient and reliable fuel source for biomass gasification.

  • The wood segment benefits from the diversity of available wood biomass feedstocks. Different types of wood residues and by products from forestry and wood processing industries can be utilized in biomass gasification, providing flexibility in sourcing and utilizing feedstocks.
  • Wood biomass is considered carbon neutral because the carbon dioxide released during combustion is roughly equivalent to the carbon absorbed by trees during their growth. The characteristic makes wood a favorable choice for biomass gasification in terms of minimizing net carbon emissions.

Chemicals Segment to Hold High Demand for Biomass Gasification

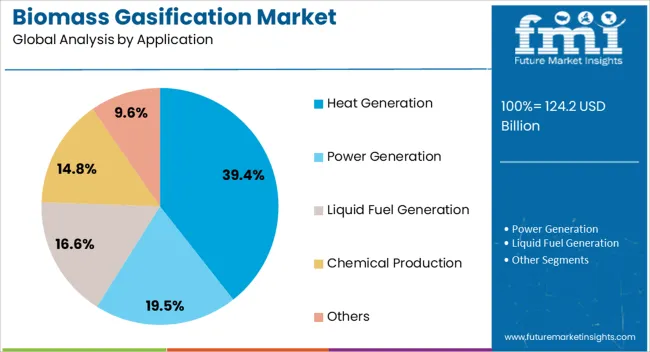
In terms of application, the star chemicals segment is expected to continue dominating the biomass gasification market. The chemicals segment is anticipated to significantly contribute to the growth of the market.

  • The rising emphasis on renewable energy sources and government initiatives to promote bio based chemicals are driving the adoption of biomass gasification in the chemicals sector. The versatility of biomass feedstocks, coupled with advancements in gasification technology, enhances the efficiency and cost effectiveness of chemical production.
  • The growing awareness among industries regarding the need for circular economy practices, coupled with the potential for biomass gasification to produce bio based chemicals from waste materials, is fostering the expansion of market in the chemicals segment.

Competitive Landscape

The biomass gasification market is dynamic and influenced by a combination of technological advancements, regulatory policies, and market demand for sustainable energy solutions. The competitive landscape reflects a mix of established players, emerging startups, and global energy giants.

Recent Development

  • In 2022, Valmet Corporation inaugurated a new facility in Sweden dedicated to expanding research and development initiatives in biomass treatment. The primary objective of this plant is to enhance the capabilities of the companies in meeting the growing demand for biofuels and bio energy.

Report Scope

Attribute Details
Estimated Market Size in 2024 US$ 114.0 billion
Projected Market Valuation in 2034 US$ 268.0 billion
Value-based CAGR 2024 to 2034 8.9%
Forecast Period 2024 to 2034
Historical Data Available for 2019 to 2023
Market Analysis Value in US$ billion
Key Regions Covered
  • North America
  • Latin America
  • Western Europe
  • Eastern Europe
  • South Asia and Pacific
  • East Asia
  • The Middle East & Africa
Key Market Segments Covered
  • Fuel Type
  • Application
  • Region
Key Countries Profiled
  • The United States
  • Canada
  • Brazil
  • Mexico
  • Germany
  • France
  • Spain
  • Italy
  • Russia
  • Poland
  • Czech Republic
  • Romania
  • India
  • Bangladesh
  • Australia
  • New Zealand
  • China
  • Japan
  • South Korea
  • GCC countries
  • South Africa
  • Israel
Key Companies Profiled
  • ThyssenKrupp AG
  • Siemens
  • Mitsubishi Heavy Industries Ltd
  • Sedin Engineering Company Limited
  • Cb&l
  • General Electric, Kbrinc
  • Air Liquide
  • Synthesis Energy Systems Inc.
  • Royal Dutch Shell Plc.

Segmentation Analysis of the Biomass Gasification Market

Fuel Type:

  • Wood
  • Animal Waste
  • Others

Application:

  • Chemicals
  • Liquid Fuels
  • Power and Gas Fuels

Region:

  • North America
  • Latin America
  • Western Europe
  • Eastern Europe
  • South Asia and Pacific
  • East Asia
  • The Middle East and Africa

Frequently Asked Questions

What is the anticipated value of the Biomass Gasification market in 2024?

The biomass gasification market is projected to reach a valuation of US$ 114.0 billion in 2024.

What is the expected CAGR for the Biomass Gasification market until 2034?

The biomass gasification industry is set to expand by a CAGR of 8.9% through 2034.

How much valuation is projected for the Biomass Gasification market in 2034?

The biomass gasification market is forecast to reach US$ 268.0 billion by 2034.

Which country is projected to lead the Biomass Gasification market?

Korea is expected to be the top performing market, exhibiting a CAGR of 13.1% through 2034.

Which is the dominant fuel type in the Biomass Gasification domain?

Wood segment is preferred, and is expected to account for a CAGR of 8.6% through 2034.

Table of Content

1. Executive Summary

    1.1. Global Market Outlook

    1.2. Demand-side Trends

    1.3. Supply-side Trends

    1.4. Technology Roadmap Analysis

    1.5. Analysis and Recommendations

2. Market Overview

    2.1. Market Coverage / Taxonomy

    2.2. Market Definition / Scope / Limitations

3. Market Background

    3.1. Market Dynamics

        3.1.1. Drivers

        3.1.2. Restraints

        3.1.3. Opportunity

        3.1.4. Trends

    3.2. Scenario Forecast

        3.2.1. Demand in Optimistic Scenario

        3.2.2. Demand in Likely Scenario

        3.2.3. Demand in Conservative Scenario

    3.3. Opportunity Map Analysis

    3.4. Investment Feasibility Matrix

    3.5. PESTLE and Porter’s Analysis

    3.6. Regulatory Landscape

        3.6.1. By Key Regions

        3.6.2. By Key Countries

    3.7. Regional Parent Market Outlook

4. Global Market Analysis 2019 to 2023 and Forecast, 2024 to 2034

    4.1. Historical Market Size Value (US$ Million) Analysis, 2019 to 2023

    4.2. Current and Future Market Size Value (US$ Million) Projections, 2024 to 2034

        4.2.1. Y-o-Y Growth Trend Analysis

        4.2.2. Absolute $ Opportunity Analysis

5. Global Market Analysis 2019 to 2023 and Forecast 2024 to 2034, By Fuel Type

    5.1. Introduction / Key Findings

    5.2. Historical Market Size Value (US$ Million) Analysis By Fuel Type, 2019 to 2023

    5.3. Current and Future Market Size Value (US$ Million) Analysis and Forecast By Fuel Type, 2024 to 2034

        5.3.1. Wood

        5.3.2. Animal Waste

        5.3.3. Others

    5.4. Y-o-Y Growth Trend Analysis By Fuel Type, 2019 to 2023

    5.5. Absolute $ Opportunity Analysis By Fuel Type, 2024 to 2034

6. Global Market Analysis 2019 to 2023 and Forecast 2024 to 2034, By Application

    6.1. Introduction / Key Findings

    6.2. Historical Market Size Value (US$ Million) Analysis By Application, 2019 to 2023

    6.3. Current and Future Market Size Value (US$ Million) Analysis and Forecast By Application, 2024 to 2034

        6.3.1. Chemicals

        6.3.2. Liquid Fuels

        6.3.3. Power & Gas Fuels

    6.4. Y-o-Y Growth Trend Analysis By Application, 2019 to 2023

    6.5. Absolute $ Opportunity Analysis By Application, 2024 to 2034

7. Global Market Analysis 2019 to 2023 and Forecast 2024 to 2034, By Region

    7.1. Introduction

    7.2. Historical Market Size Value (US$ Million) Analysis By Region, 2019 to 2023

    7.3. Current Market Size Value (US$ Million) Analysis and Forecast By Region, 2024 to 2034

        7.3.1. North America

        7.3.2. Latin America

        7.3.3. Western Europe

        7.3.4. Eastern Europe

        7.3.5. South Asia and Pacific

        7.3.6. East Asia

        7.3.7. Middle East and Africa

    7.4. Market Attractiveness Analysis By Region

8. North America Market Analysis 2019 to 2023 and Forecast 2024 to 2034, By Country

    8.1. Historical Market Size Value (US$ Million) Trend Analysis By Market Taxonomy, 2019 to 2023

    8.2. Market Size Value (US$ Million) Forecast By Market Taxonomy, 2024 to 2034

        8.2.1. By Country

            8.2.1.1. USA

            8.2.1.2. Canada

        8.2.2. By Fuel Type

        8.2.3. By Application

    8.3. Market Attractiveness Analysis

        8.3.1. By Country

        8.3.2. By Fuel Type

        8.3.3. By Application

    8.4. Key Takeaways

9. Latin America Market Analysis 2019 to 2023 and Forecast 2024 to 2034, By Country

    9.1. Historical Market Size Value (US$ Million) Trend Analysis By Market Taxonomy, 2019 to 2023

    9.2. Market Size Value (US$ Million) Forecast By Market Taxonomy, 2024 to 2034

        9.2.1. By Country

            9.2.1.1. Brazil

            9.2.1.2. Mexico

            9.2.1.3. Rest of Latin America

        9.2.2. By Fuel Type

        9.2.3. By Application

    9.3. Market Attractiveness Analysis

        9.3.1. By Country

        9.3.2. By Fuel Type

        9.3.3. By Application

    9.4. Key Takeaways

10. Western Europe Market Analysis 2019 to 2023 and Forecast 2024 to 2034, By Country

    10.1. Historical Market Size Value (US$ Million) Trend Analysis By Market Taxonomy, 2019 to 2023

    10.2. Market Size Value (US$ Million) Forecast By Market Taxonomy, 2024 to 2034

        10.2.1. By Country

            10.2.1.1. Germany

            10.2.1.2. UK

            10.2.1.3. France

            10.2.1.4. Spain

            10.2.1.5. Italy

            10.2.1.6. Rest of Western Europe

        10.2.2. By Fuel Type

        10.2.3. By Application

    10.3. Market Attractiveness Analysis

        10.3.1. By Country

        10.3.2. By Fuel Type

        10.3.3. By Application

    10.4. Key Takeaways

11. Eastern Europe Market Analysis 2019 to 2023 and Forecast 2024 to 2034, By Country

    11.1. Historical Market Size Value (US$ Million) Trend Analysis By Market Taxonomy, 2019 to 2023

    11.2. Market Size Value (US$ Million) Forecast By Market Taxonomy, 2024 to 2034

        11.2.1. By Country

            11.2.1.1. Poland

            11.2.1.2. Russia

            11.2.1.3. Czech Republic

            11.2.1.4. Romania

            11.2.1.5. Rest of Eastern Europe

        11.2.2. By Fuel Type

        11.2.3. By Application

    11.3. Market Attractiveness Analysis

        11.3.1. By Country

        11.3.2. By Fuel Type

        11.3.3. By Application

    11.4. Key Takeaways

12. South Asia and Pacific Market Analysis 2019 to 2023 and Forecast 2024 to 2034, By Country

    12.1. Historical Market Size Value (US$ Million) Trend Analysis By Market Taxonomy, 2019 to 2023

    12.2. Market Size Value (US$ Million) Forecast By Market Taxonomy, 2024 to 2034

        12.2.1. By Country

            12.2.1.1. India

            12.2.1.2. Bangladesh

            12.2.1.3. Australia

            12.2.1.4. New Zealand

            12.2.1.5. Rest of South Asia and Pacific

        12.2.2. By Fuel Type

        12.2.3. By Application

    12.3. Market Attractiveness Analysis

        12.3.1. By Country

        12.3.2. By Fuel Type

        12.3.3. By Application

    12.4. Key Takeaways

13. East Asia Market Analysis 2019 to 2023 and Forecast 2024 to 2034, By Country

    13.1. Historical Market Size Value (US$ Million) Trend Analysis By Market Taxonomy, 2019 to 2023

    13.2. Market Size Value (US$ Million) Forecast By Market Taxonomy, 2024 to 2034

        13.2.1. By Country

            13.2.1.1. China

            13.2.1.2. Japan

            13.2.1.3. South Korea

        13.2.2. By Fuel Type

        13.2.3. By Application

    13.3. Market Attractiveness Analysis

        13.3.1. By Country

        13.3.2. By Fuel Type

        13.3.3. By Application

    13.4. Key Takeaways

14. Middle East and Africa Market Analysis 2019 to 2023 and Forecast 2024 to 2034, By Country

    14.1. Historical Market Size Value (US$ Million) Trend Analysis By Market Taxonomy, 2019 to 2023

    14.2. Market Size Value (US$ Million) Forecast By Market Taxonomy, 2024 to 2034

        14.2.1. By Country

            14.2.1.1. GCC Countries

            14.2.1.2. South Africa

            14.2.1.3. Israel

            14.2.1.4. Rest of MEA

        14.2.2. By Fuel Type

        14.2.3. By Application

    14.3. Market Attractiveness Analysis

        14.3.1. By Country

        14.3.2. By Fuel Type

        14.3.3. By Application

    14.4. Key Takeaways

15. Key Countries Market Analysis

    15.1. USA

        15.1.1. Pricing Analysis

        15.1.2. Market Share Analysis, 2023

            15.1.2.1. By Fuel Type

            15.1.2.2. By Application

    15.2. Canada

        15.2.1. Pricing Analysis

        15.2.2. Market Share Analysis, 2023

            15.2.2.1. By Fuel Type

            15.2.2.2. By Application

    15.3. Brazil

        15.3.1. Pricing Analysis

        15.3.2. Market Share Analysis, 2023

            15.3.2.1. By Fuel Type

            15.3.2.2. By Application

    15.4. Mexico

        15.4.1. Pricing Analysis

        15.4.2. Market Share Analysis, 2023

            15.4.2.1. By Fuel Type

            15.4.2.2. By Application

    15.5. Germany

        15.5.1. Pricing Analysis

        15.5.2. Market Share Analysis, 2023

            15.5.2.1. By Fuel Type

            15.5.2.2. By Application

    15.6. UK

        15.6.1. Pricing Analysis

        15.6.2. Market Share Analysis, 2023

            15.6.2.1. By Fuel Type

            15.6.2.2. By Application

    15.7. France

        15.7.1. Pricing Analysis

        15.7.2. Market Share Analysis, 2023

            15.7.2.1. By Fuel Type

            15.7.2.2. By Application

    15.8. Spain

        15.8.1. Pricing Analysis

        15.8.2. Market Share Analysis, 2023

            15.8.2.1. By Fuel Type

            15.8.2.2. By Application

    15.9. Italy

        15.9.1. Pricing Analysis

        15.9.2. Market Share Analysis, 2023

            15.9.2.1. By Fuel Type

            15.9.2.2. By Application

    15.10. Poland

        15.10.1. Pricing Analysis

        15.10.2. Market Share Analysis, 2023

            15.10.2.1. By Fuel Type

            15.10.2.2. By Application

    15.11. Russia

        15.11.1. Pricing Analysis

        15.11.2. Market Share Analysis, 2023

            15.11.2.1. By Fuel Type

            15.11.2.2. By Application

    15.12. Czech Republic

        15.12.1. Pricing Analysis

        15.12.2. Market Share Analysis, 2023

            15.12.2.1. By Fuel Type

            15.12.2.2. By Application

    15.13. Romania

        15.13.1. Pricing Analysis

        15.13.2. Market Share Analysis, 2023

            15.13.2.1. By Fuel Type

            15.13.2.2. By Application

    15.14. India

        15.14.1. Pricing Analysis

        15.14.2. Market Share Analysis, 2023

            15.14.2.1. By Fuel Type

            15.14.2.2. By Application

    15.15. Bangladesh

        15.15.1. Pricing Analysis

        15.15.2. Market Share Analysis, 2023

            15.15.2.1. By Fuel Type

            15.15.2.2. By Application

    15.16. Australia

        15.16.1. Pricing Analysis

        15.16.2. Market Share Analysis, 2023

            15.16.2.1. By Fuel Type

            15.16.2.2. By Application

    15.17. New Zealand

        15.17.1. Pricing Analysis

        15.17.2. Market Share Analysis, 2023

            15.17.2.1. By Fuel Type

            15.17.2.2. By Application

    15.18. China

        15.18.1. Pricing Analysis

        15.18.2. Market Share Analysis, 2023

            15.18.2.1. By Fuel Type

            15.18.2.2. By Application

    15.19. Japan

        15.19.1. Pricing Analysis

        15.19.2. Market Share Analysis, 2023

            15.19.2.1. By Fuel Type

            15.19.2.2. By Application

    15.20. South Korea

        15.20.1. Pricing Analysis

        15.20.2. Market Share Analysis, 2023

            15.20.2.1. By Fuel Type

            15.20.2.2. By Application

    15.21. GCC Countries

        15.21.1. Pricing Analysis

        15.21.2. Market Share Analysis, 2023

            15.21.2.1. By Fuel Type

            15.21.2.2. By Application

    15.22. South Africa

        15.22.1. Pricing Analysis

        15.22.2. Market Share Analysis, 2023

            15.22.2.1. By Fuel Type

            15.22.2.2. By Application

    15.23. Israel

        15.23.1. Pricing Analysis

        15.23.2. Market Share Analysis, 2023

            15.23.2.1. By Fuel Type

            15.23.2.2. By Application

16. Market Structure Analysis

    16.1. Competition Dashboard

    16.2. Competition Benchmarking

    16.3. Market Share Analysis of Top Players

        16.3.1. By Regional

        16.3.2. By Fuel Type

        16.3.3. By Application

17. Competition Analysis

    17.1. Competition Deep Dive

        17.1.1. ThyssenKrupp AG

            17.1.1.1. Overview

            17.1.1.2. Product Portfolio

            17.1.1.3. Profitability by Market Segments

            17.1.1.4. Sales Footprint

            17.1.1.5. Strategy Overview

                17.1.1.5.1. Marketing Strategy

        17.1.2. Siemens

            17.1.2.1. Overview

            17.1.2.2. Product Portfolio

            17.1.2.3. Profitability by Market Segments

            17.1.2.4. Sales Footprint

            17.1.2.5. Strategy Overview

                17.1.2.5.1. Marketing Strategy

        17.1.3. Mitsubishi Heavy Industries Ltd

            17.1.3.1. Overview

            17.1.3.2. Product Portfolio

            17.1.3.3. Profitability by Market Segments

            17.1.3.4. Sales Footprint

            17.1.3.5. Strategy Overview

                17.1.3.5.1. Marketing Strategy

        17.1.4. Sedin Engineering Company Limited

            17.1.4.1. Overview

            17.1.4.2. Product Portfolio

            17.1.4.3. Profitability by Market Segments

            17.1.4.4. Sales Footprint

            17.1.4.5. Strategy Overview

                17.1.4.5.1. Marketing Strategy

        17.1.5. Cb&l

            17.1.5.1. Overview

            17.1.5.2. Product Portfolio

            17.1.5.3. Profitability by Market Segments

            17.1.5.4. Sales Footprint

            17.1.5.5. Strategy Overview

                17.1.5.5.1. Marketing Strategy

        17.1.6. General Electric, Kbrinc

            17.1.6.1. Overview

            17.1.6.2. Product Portfolio

            17.1.6.3. Profitability by Market Segments

            17.1.6.4. Sales Footprint

            17.1.6.5. Strategy Overview

                17.1.6.5.1. Marketing Strategy

        17.1.7. Air Liquide

            17.1.7.1. Overview

            17.1.7.2. Product Portfolio

            17.1.7.3. Profitability by Market Segments

            17.1.7.4. Sales Footprint

            17.1.7.5. Strategy Overview

                17.1.7.5.1. Marketing Strategy

        17.1.8. Synthesis Energy Systems Inc.

            17.1.8.1. Overview

            17.1.8.2. Product Portfolio

            17.1.8.3. Profitability by Market Segments

            17.1.8.4. Sales Footprint

            17.1.8.5. Strategy Overview

                17.1.8.5.1. Marketing Strategy

        17.1.9. Royal Dutch Shell Plc

            17.1.9.1. Overview

            17.1.9.2. Product Portfolio

            17.1.9.3. Profitability by Market Segments

            17.1.9.4. Sales Footprint

            17.1.9.5. Strategy Overview

                17.1.9.5.1. Marketing Strategy

18. Assumptions & Acronyms Used

19. Research Methodology

List of Tables

Table 1: Global Market Value (US$ Million) Forecast by Region, 2019 to 2034

Table 2: Global Market Value (US$ Million) Forecast by Fuel Type, 2019 to 2034

Table 3: Global Market Value (US$ Million) Forecast by Application, 2019 to 2034

Table 4: North America Market Value (US$ Million) Forecast by Country, 2019 to 2034

Table 5: North America Market Value (US$ Million) Forecast by Fuel Type, 2019 to 2034

Table 6: North America Market Value (US$ Million) Forecast by Application, 2019 to 2034

Table 7: Latin America Market Value (US$ Million) Forecast by Country, 2019 to 2034

Table 8: Latin America Market Value (US$ Million) Forecast by Fuel Type, 2019 to 2034

Table 9: Latin America Market Value (US$ Million) Forecast by Application, 2019 to 2034

Table 10: Western Europe Market Value (US$ Million) Forecast by Country, 2019 to 2034

Table 11: Western Europe Market Value (US$ Million) Forecast by Fuel Type, 2019 to 2034

Table 12: Western Europe Market Value (US$ Million) Forecast by Application, 2019 to 2034

Table 13: Eastern Europe Market Value (US$ Million) Forecast by Country, 2019 to 2034

Table 14: Eastern Europe Market Value (US$ Million) Forecast by Fuel Type, 2019 to 2034

Table 15: Eastern Europe Market Value (US$ Million) Forecast by Application, 2019 to 2034

Table 16: South Asia and Pacific Market Value (US$ Million) Forecast by Country, 2019 to 2034

Table 17: South Asia and Pacific Market Value (US$ Million) Forecast by Fuel Type, 2019 to 2034

Table 18: South Asia and Pacific Market Value (US$ Million) Forecast by Application, 2019 to 2034

Table 19: East Asia Market Value (US$ Million) Forecast by Country, 2019 to 2034

Table 20: East Asia Market Value (US$ Million) Forecast by Fuel Type, 2019 to 2034

Table 21: East Asia Market Value (US$ Million) Forecast by Application, 2019 to 2034

Table 22: Middle East and Africa Market Value (US$ Million) Forecast by Country, 2019 to 2034

Table 23: Middle East and Africa Market Value (US$ Million) Forecast by Fuel Type, 2019 to 2034

Table 24: Middle East and Africa Market Value (US$ Million) Forecast by Application, 2019 to 2034

List of Charts

Figure 1: Global Market Value (US$ Million) by Fuel Type, 2024 to 2034

Figure 2: Global Market Value (US$ Million) by Application, 2024 to 2034

Figure 3: Global Market Value (US$ Million) by Region, 2024 to 2034

Figure 4: Global Market Value (US$ Million) Analysis by Region, 2019 to 2034

Figure 5: Global Market Value Share (%) and BPS Analysis by Region, 2024 to 2034

Figure 6: Global Market Y-o-Y Growth (%) Projections by Region, 2024 to 2034

Figure 7: Global Market Value (US$ Million) Analysis by Fuel Type, 2019 to 2034

Figure 8: Global Market Value Share (%) and BPS Analysis by Fuel Type, 2024 to 2034

Figure 9: Global Market Y-o-Y Growth (%) Projections by Fuel Type, 2024 to 2034

Figure 10: Global Market Value (US$ Million) Analysis by Application, 2019 to 2034

Figure 11: Global Market Value Share (%) and BPS Analysis by Application, 2024 to 2034

Figure 12: Global Market Y-o-Y Growth (%) Projections by Application, 2024 to 2034

Figure 13: Global Market Attractiveness by Fuel Type, 2024 to 2034

Figure 14: Global Market Attractiveness by Application, 2024 to 2034

Figure 15: Global Market Attractiveness by Region, 2024 to 2034

Figure 16: North America Market Value (US$ Million) by Fuel Type, 2024 to 2034

Figure 17: North America Market Value (US$ Million) by Application, 2024 to 2034

Figure 18: North America Market Value (US$ Million) by Country, 2024 to 2034

Figure 19: North America Market Value (US$ Million) Analysis by Country, 2019 to 2034

Figure 20: North America Market Value Share (%) and BPS Analysis by Country, 2024 to 2034

Figure 21: North America Market Y-o-Y Growth (%) Projections by Country, 2024 to 2034

Figure 22: North America Market Value (US$ Million) Analysis by Fuel Type, 2019 to 2034

Figure 23: North America Market Value Share (%) and BPS Analysis by Fuel Type, 2024 to 2034

Figure 24: North America Market Y-o-Y Growth (%) Projections by Fuel Type, 2024 to 2034

Figure 25: North America Market Value (US$ Million) Analysis by Application, 2019 to 2034

Figure 26: North America Market Value Share (%) and BPS Analysis by Application, 2024 to 2034

Figure 27: North America Market Y-o-Y Growth (%) Projections by Application, 2024 to 2034

Figure 28: North America Market Attractiveness by Fuel Type, 2024 to 2034

Figure 29: North America Market Attractiveness by Application, 2024 to 2034

Figure 30: North America Market Attractiveness by Country, 2024 to 2034

Figure 31: Latin America Market Value (US$ Million) by Fuel Type, 2024 to 2034

Figure 32: Latin America Market Value (US$ Million) by Application, 2024 to 2034

Figure 33: Latin America Market Value (US$ Million) by Country, 2024 to 2034

Figure 34: Latin America Market Value (US$ Million) Analysis by Country, 2019 to 2034

Figure 35: Latin America Market Value Share (%) and BPS Analysis by Country, 2024 to 2034

Figure 36: Latin America Market Y-o-Y Growth (%) Projections by Country, 2024 to 2034

Figure 37: Latin America Market Value (US$ Million) Analysis by Fuel Type, 2019 to 2034

Figure 38: Latin America Market Value Share (%) and BPS Analysis by Fuel Type, 2024 to 2034

Figure 39: Latin America Market Y-o-Y Growth (%) Projections by Fuel Type, 2024 to 2034

Figure 40: Latin America Market Value (US$ Million) Analysis by Application, 2019 to 2034

Figure 41: Latin America Market Value Share (%) and BPS Analysis by Application, 2024 to 2034

Figure 42: Latin America Market Y-o-Y Growth (%) Projections by Application, 2024 to 2034

Figure 43: Latin America Market Attractiveness by Fuel Type, 2024 to 2034

Figure 44: Latin America Market Attractiveness by Application, 2024 to 2034

Figure 45: Latin America Market Attractiveness by Country, 2024 to 2034

Figure 46: Western Europe Market Value (US$ Million) by Fuel Type, 2024 to 2034

Figure 47: Western Europe Market Value (US$ Million) by Application, 2024 to 2034

Figure 48: Western Europe Market Value (US$ Million) by Country, 2024 to 2034

Figure 49: Western Europe Market Value (US$ Million) Analysis by Country, 2019 to 2034

Figure 50: Western Europe Market Value Share (%) and BPS Analysis by Country, 2024 to 2034

Figure 51: Western Europe Market Y-o-Y Growth (%) Projections by Country, 2024 to 2034

Figure 52: Western Europe Market Value (US$ Million) Analysis by Fuel Type, 2019 to 2034

Figure 53: Western Europe Market Value Share (%) and BPS Analysis by Fuel Type, 2024 to 2034

Figure 54: Western Europe Market Y-o-Y Growth (%) Projections by Fuel Type, 2024 to 2034

Figure 55: Western Europe Market Value (US$ Million) Analysis by Application, 2019 to 2034

Figure 56: Western Europe Market Value Share (%) and BPS Analysis by Application, 2024 to 2034

Figure 57: Western Europe Market Y-o-Y Growth (%) Projections by Application, 2024 to 2034

Figure 58: Western Europe Market Attractiveness by Fuel Type, 2024 to 2034

Figure 59: Western Europe Market Attractiveness by Application, 2024 to 2034

Figure 60: Western Europe Market Attractiveness by Country, 2024 to 2034

Figure 61: Eastern Europe Market Value (US$ Million) by Fuel Type, 2024 to 2034

Figure 62: Eastern Europe Market Value (US$ Million) by Application, 2024 to 2034

Figure 63: Eastern Europe Market Value (US$ Million) by Country, 2024 to 2034

Figure 64: Eastern Europe Market Value (US$ Million) Analysis by Country, 2019 to 2034

Figure 65: Eastern Europe Market Value Share (%) and BPS Analysis by Country, 2024 to 2034

Figure 66: Eastern Europe Market Y-o-Y Growth (%) Projections by Country, 2024 to 2034

Figure 67: Eastern Europe Market Value (US$ Million) Analysis by Fuel Type, 2019 to 2034

Figure 68: Eastern Europe Market Value Share (%) and BPS Analysis by Fuel Type, 2024 to 2034

Figure 69: Eastern Europe Market Y-o-Y Growth (%) Projections by Fuel Type, 2024 to 2034

Figure 70: Eastern Europe Market Value (US$ Million) Analysis by Application, 2019 to 2034

Figure 71: Eastern Europe Market Value Share (%) and BPS Analysis by Application, 2024 to 2034

Figure 72: Eastern Europe Market Y-o-Y Growth (%) Projections by Application, 2024 to 2034

Figure 73: Eastern Europe Market Attractiveness by Fuel Type, 2024 to 2034

Figure 74: Eastern Europe Market Attractiveness by Application, 2024 to 2034

Figure 75: Eastern Europe Market Attractiveness by Country, 2024 to 2034

Figure 76: South Asia and Pacific Market Value (US$ Million) by Fuel Type, 2024 to 2034

Figure 77: South Asia and Pacific Market Value (US$ Million) by Application, 2024 to 2034

Figure 78: South Asia and Pacific Market Value (US$ Million) by Country, 2024 to 2034

Figure 79: South Asia and Pacific Market Value (US$ Million) Analysis by Country, 2019 to 2034

Figure 80: South Asia and Pacific Market Value Share (%) and BPS Analysis by Country, 2024 to 2034

Figure 81: South Asia and Pacific Market Y-o-Y Growth (%) Projections by Country, 2024 to 2034

Figure 82: South Asia and Pacific Market Value (US$ Million) Analysis by Fuel Type, 2019 to 2034

Figure 83: South Asia and Pacific Market Value Share (%) and BPS Analysis by Fuel Type, 2024 to 2034

Figure 84: South Asia and Pacific Market Y-o-Y Growth (%) Projections by Fuel Type, 2024 to 2034

Figure 85: South Asia and Pacific Market Value (US$ Million) Analysis by Application, 2019 to 2034

Figure 86: South Asia and Pacific Market Value Share (%) and BPS Analysis by Application, 2024 to 2034

Figure 87: South Asia and Pacific Market Y-o-Y Growth (%) Projections by Application, 2024 to 2034

Figure 88: South Asia and Pacific Market Attractiveness by Fuel Type, 2024 to 2034

Figure 89: South Asia and Pacific Market Attractiveness by Application, 2024 to 2034

Figure 90: South Asia and Pacific Market Attractiveness by Country, 2024 to 2034

Figure 91: East Asia Market Value (US$ Million) by Fuel Type, 2024 to 2034

Figure 92: East Asia Market Value (US$ Million) by Application, 2024 to 2034

Figure 93: East Asia Market Value (US$ Million) by Country, 2024 to 2034

Figure 94: East Asia Market Value (US$ Million) Analysis by Country, 2019 to 2034

Figure 95: East Asia Market Value Share (%) and BPS Analysis by Country, 2024 to 2034

Figure 96: East Asia Market Y-o-Y Growth (%) Projections by Country, 2024 to 2034

Figure 97: East Asia Market Value (US$ Million) Analysis by Fuel Type, 2019 to 2034

Figure 98: East Asia Market Value Share (%) and BPS Analysis by Fuel Type, 2024 to 2034

Figure 99: East Asia Market Y-o-Y Growth (%) Projections by Fuel Type, 2024 to 2034

Figure 100: East Asia Market Value (US$ Million) Analysis by Application, 2019 to 2034

Figure 101: East Asia Market Value Share (%) and BPS Analysis by Application, 2024 to 2034

Figure 102: East Asia Market Y-o-Y Growth (%) Projections by Application, 2024 to 2034

Figure 103: East Asia Market Attractiveness by Fuel Type, 2024 to 2034

Figure 104: East Asia Market Attractiveness by Application, 2024 to 2034

Figure 105: East Asia Market Attractiveness by Country, 2024 to 2034

Figure 106: Middle East and Africa Market Value (US$ Million) by Fuel Type, 2024 to 2034

Figure 107: Middle East and Africa Market Value (US$ Million) by Application, 2024 to 2034

Figure 108: Middle East and Africa Market Value (US$ Million) by Country, 2024 to 2034

Figure 109: Middle East and Africa Market Value (US$ Million) Analysis by Country, 2019 to 2034

Figure 110: Middle East and Africa Market Value Share (%) and BPS Analysis by Country, 2024 to 2034

Figure 111: Middle East and Africa Market Y-o-Y Growth (%) Projections by Country, 2024 to 2034

Figure 112: Middle East and Africa Market Value (US$ Million) Analysis by Fuel Type, 2019 to 2034

Figure 113: Middle East and Africa Market Value Share (%) and BPS Analysis by Fuel Type, 2024 to 2034

Figure 114: Middle East and Africa Market Y-o-Y Growth (%) Projections by Fuel Type, 2024 to 2034

Figure 115: Middle East and Africa Market Value (US$ Million) Analysis by Application, 2019 to 2034

Figure 116: Middle East and Africa Market Value Share (%) and BPS Analysis by Application, 2024 to 2034

Figure 117: Middle East and Africa Market Y-o-Y Growth (%) Projections by Application, 2024 to 2034

Figure 118: Middle East and Africa Market Attractiveness by Fuel Type, 2024 to 2034

Figure 119: Middle East and Africa Market Attractiveness by Application, 2024 to 2034

Figure 120: Middle East and Africa Market Attractiveness by Country, 2024 to 2034

Recommendations

Chemicals & Materials

Biogas Market

Published : April 2024

Chemicals & Materials

Biomass Pellets Market

Published : April 2023

Food and Beverage

Biochar Fertilizer Market

Published : March 2023

Oil and Gas

Asia Pacific Biochar Market

Published : October 2022

Explore Chemicals & Materials Insights

View Reports

Biomass Gasification Market