Reports

- Global Locations -

Headquarters

Future Market Insights, Inc.

Christiana Corporate, 200
Continental Drive, Suite 401,
Newark, Delaware - 19713,
United States

T: +1-845-579-5705

Americas

Future Market Insights, Inc.

616 Corporate Way, Suite 2-9018,
Valley Cottage, NY 10989, United States

T: +1-347-918-3531

MEA

Future Market Insights

1602-6 Jumeirah Bay X2 Tower, Plot No: JLT-PH2-X2A,
Jumeirah Lakes Towers, Dubai,
United Arab Emirates

Europe

Future Market Insights

3rd Floor, 207 Regent Street,
W1B 3HH London
United Kingdom

T: + 44 (0) 20 8123 9659
D: +44 (0) 20 3287 4268

Asia Pacific

Future Market Insights

IndiaLand Global Tech Park, Unit UG-1, Behind Grand HighStreet, Phase 1, Hinjawadi, MH, Pune – 411057, India

Fish Processing Equipment Market Outlook (2023 to 2033)

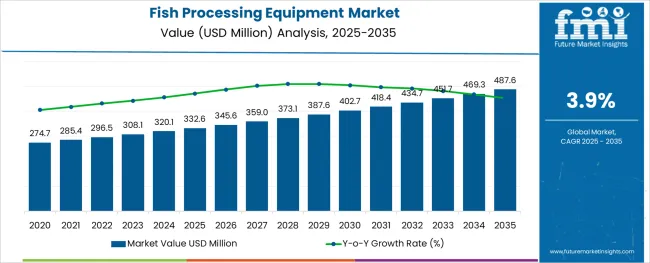
The fish processing equipment market is expected to surge ahead at a CAGR of 3.9% during the forecast period. The market is valued at US$ 308.1 million as of 2023, and by 2033, the market is expected to reach a valuation of US$ 451.6 million.

Some of the factors which are expected to support the market growth are:

  • Surging global seafood market.
  • The exponential increase in the purchasing power of consumers.
  • Increasing consumption of fish owing to its nutritional value.
  • Rapid technological development has led to an increase in the precision of fish processing equipment.

Don't pay for what you don't need

Customize your report by selecting specific countries or regions and save 30%!

Massive fish oil market in Europe presents lucrative opportunities to increase the demand for fish processing equipment

Europe is expected to be one of the most significant markets for fish processing equipment.

Europe's fish oil market is valued at US$ 2 billion as of 2022. There has been an increasing demand for fish oil in the region owing to its increased application in the pharmaceutical business and animal nutrition, and pet feed market as these are rich sources of omega-3 fatty acids, EPA and DHA.

The fish oil market has depended upon fish processing equipment as they generate products that are high in proteins, lipids, and various other nutrients.

Massive aquaculture therapeutics market in North America expected to surge the sales of fish processing equipment during the forecast period

North America is expected to be the second-largest market for fish processing machines during the forecast period.

The North American aquaculture therapeutics market was valued at US$ 450 million as of 2022, and the region held a massive 35% of the global market share. There were increasing cases of bacterial illness among the aquaculture species, as a result of which the manufacturers wanted to get them treated before putting them into further usage.

As a matter of fact, consumer confidence would further enhance, and this would give the fish processing equipment manufacturers the leeway to seamlessly carry out the activity owing to FDA authorization.

Nandini Roy Choudhury

Principal Consultant

Talk to Analyst

Find your sweet spots for generating winning opportunities in this market.

Massive seafood market in Asia Pacific region expected to surge the sales of fish processing equipment

Based on the research conducted by FMI, the Asia Pacific region is expected to be the largest fish processing equipment market during the forecast period.

Asia Pacific is currently the largest seafood market and based on the market analysis, the region occupies nearly 40% of the global market share. As of 2021, the Asia Pacific seafood market was valued at close to US$ 74 billion.

A huge seafood market would definitely showcase a huge potential for the surging demand for fish processing equipment. The major players in the seafood market are making use of fish processing equipment to carry out the fish slaughtering process effectively.

Historical CAGR (2018 to 2022) Vs anticipated CAGR (2023 to 2033)

On comparing the historical CAGR with the anticipated CAGR, we might get a sense that the market growth is gradual, but the analysts are of the view that the growth would certainly be long-lasting.

While the historical CAGR for the market was 3.2%, the anticipated CAGR is 3.9%. This certainly indicates that an increase in the sales of fish and related products would certainly surge the market growth. It is because the fish processing equipment is versatile in nature and does much more than just fish slaughtering.

Attributes Value
Fish Processing Equipment Market Value (2022) US$ 297.4 million
Fish Processing Equipment Market Value (2023) US$ 308.1 million
Fish Processing Equipment Market Forecast Value (2033) US$ 451.6 million
Fish Processing Equipment Market Expected CAGR (2023 to 2033) 3.9%

Get the data you need at a Fraction of the cost

Personalize your report by choosing insights you need
and save 40%!

Drivers for Fish Processing Equipment Market

Reducing labor cost

The implementation of fish processing equipment ensures that the manpower is put to work on more relevant matters, thereby increasing the efficiency of the operations.

Reduced process errors

The application of fish processing equipment ensures that there are no cases pertaining to unclean cuts, slower work, wasted fish, or reduced product quality.

Owing to a high level of automation in fish processing equipment, the overall activity that is performed in a day is equivalent to the same combined effort put in by the laborers to achieve the same result in a span of at least five days.

Thanks to the consistency offered by these machines, and the ability to work for long hours together, companies operating in this business are able to reap the benefits.

Safe mode of operation

Tasks like cutting, grinding, and canning are performed flawlessly by the fish processing equipment. However, if such tasks are performed manually, it can be extremely dangerous for workers.

Moreover, the usage of the fish processing equipment also ensures that the workers are not exposed to extreme conditions, such as low temperatures, lifting heavy equipment, and exposure to toxins, which might surge the fish processing equipment market share.

Fixed initial investment

In the current times of volatile markets, the impact of inflation can be ruthless at times, which means higher labor charges along with high raw material prices.

Implementation of the fish processing equipment is as good as a one-time investment. Apart from that, the implementation of the latest technology ensures that the equipment performs all the functions with the highest level of accuracy.

Restraints for the Fish Processing Equipment Market

Concerns regarding the quality of food

One of the biggest challenges experienced by the market is that there might be differences in the method which is used as a yardstick to check the quality of fish, during import and export activities.

Moreover, the manufacturers hardly have any clue of whether the quality of the fish is good or not, and this can further impede the market growth.

Rising water pollution

Increasing cases of water pollution have led to the deteriorating health of aquatic species across the globe. This might severely impact the health of consumers, as a result of which the demand for fish processing equipment might be impacted.
Comparative View for Fish Processing Equipment Market

Fish Processing Equipment Market:

Attributes Fish Processing Equipment Market
Anticipated CAGR (2023 to 2033) 3.9%
Market Value (2023) US$ 308.1 million
Growth Factor Reduced labor cost and safe mode of operation
Future Opportunities Surging aquaculture therapeutics market
Market Trends Burgeoning fish sauce market and fish meal market

Seafood Processing Equipment Market:

Attributes Seafood Processing Equipment Market
Anticipated CAGR (2023 to 2033) 3.5%
Market Value (2023) US$ 3 billion
Growth Factor Low process errors and only a fixed initial investment
Future Opportunities The surge in the consumption of protein-based diet
Market Trends Technological advancements in the software and the operations

Poultry Processing Equipment Market:

Attributes Poultry Processing Equipment Market
Anticipated CAGR (2023 to 2033) 5%
Market Value (2023) US$ 4.2 billion
Growth Factor Increase in the number of fast food and restaurant chains.
Future Opportunities Increase in the demand for processed food in bulk quantities.
Market Trends An increase in the adoption of automation processes

Country-wise Insights

The USA: Huge Prospects for an increasing Adoption of Fish Processing Equipment

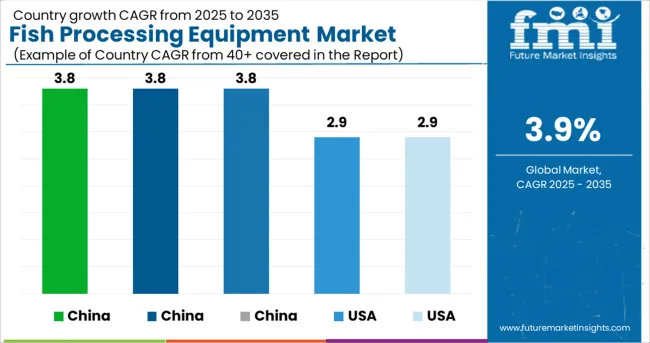
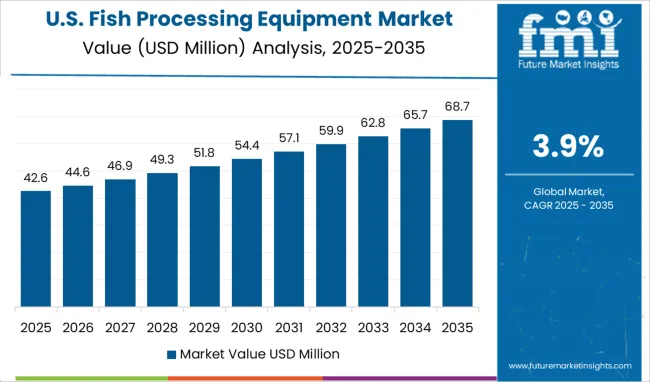
The USA fish processing equipment market is expected to grow at a CAGR of 2.9% during the forecast period. The market is valued at US$ 67.1 million as of 2023, and by 2033, the market is expected to reach a valuation of US$ 89 million.

The historic CAGR (2018 to 2022) for the market was 2.6%.

The USA is also one of the largest markets for fish sauce. As per the research conducted by FMI, the USA fish sauce market is valued at nearly US$ 1.1 billion as of 2022. Being a rich source of Vitamin D and Vitamin B2 is surging the demand for fish sauce in the region.

Manufacturers are increasingly making use of fish processing equipment to ensure that the fish is finely processed and converted to finer forms for the ease of preparation of the fish sauce.

The United Kingdom: Sales of Fish Processing Equipment are all set to increase

The United Kingdom market is expected to grow at a CAGR of 2.9% during the forecast period. The market is valued at US$ 15.2 million as of 2023, and by 2033, the market is expected to hit a valuation of US$ 20.3 million.

The historical CAGR of (2018 to 2022) for the market was 2.7%.

the United Kingdom is a prominent fish meal market. The fish meal market in the United Kingdom is expected to reach a valuation of US$ 746 million by 2033. Fish meal is gradually replacing the likes of soybean meals and corn gluten meals because they are a sustainable form of protein and have higher nutritional benefits.

The implementation of fish processing equipment in the fish meal market makes the process of deriving valuable nutrients from fish much easier.

China: Demand for Fish Processing Equipment is expected to surge during the forecast period

The China fish processing equipment market is valued at US$ 29.9 million as of 2023. The market is expected to surge at a CAGR of 3.8% during the forecast period, and by 2033, is projected to reach a valuation of US$ 43.5 million.

The historic CAGR (2018 to 2022) for the market was 3.4%.

The China fish collagen market was valued at US$ 102.4 million as of 2022, and the market is expected to surge at an above-average CAGR of 6.1%. Fish collagens are being used for strengthening bones and regulating blood sugar. Apart from that, the collagens are also used to improve the condition of tissues as well.

The fish processing equipment is used for deriving the necessary nutrients from the fish so that the fish collagen manufacturers can make use of them to prepare the required products.

Japan: The Surging Fish Based Pet Food Market is expected to increase the Sales of Fish Processing Equipment

The Japan fish processing equipment market is expected to reach a valuation of US$ 36.3 million by 2033. The market is anticipated to grow at a CAGR of 3.8%, and as of 2023, the market is valued at US$ 25 million.

The historical CAGR (2018 to 2022) for the market was 3.4%.

Japan has a fast-growing fish-based pet food market which was valued at US$ 420 million as of 2021 and is expected to grow at an anticipated CAGR of around 5%. There is an increasing demand for high-quality pet foods which is expected to surge the demand for fish-based pet food. Apart from that, the increasing scenario of pet humanization is expected to further surge the demand for fish-based pet food.

The fish processing equipment is being utilized mainly to convert the fish into a finer form so that, they can be easily converted to edible form.

South Korea consists of Massive Fish Protein Market which is expected to hugely impact the Adoption of Fish Processing Equipment

The South Korean market is expected to grow at a CAGR of 3.8% during the forecast period. The market is expected to reach a valuation of US$ 30.5 million by 2033, and as of 2023, the market is valued at US$ 21 million.

The historical CAGR (2018 to 2022) for the market was 3.4%.

The South Korean fish protein market is valued at US$ 341 million as of 2021. An increase in the number of health-conscious customers in South Korea is expected to surge the market share. Apart from that, the increasing adoption of fish protein chemicals by pharmaceutical companies is expected to further surge the market growth.

The fish processing equipment helps in converting the fish into a form from which protein and other nutrients can be easily derived. This is something that might surge the demand for fish processing equipment among the fish protein market players.

Segment-wise Insights

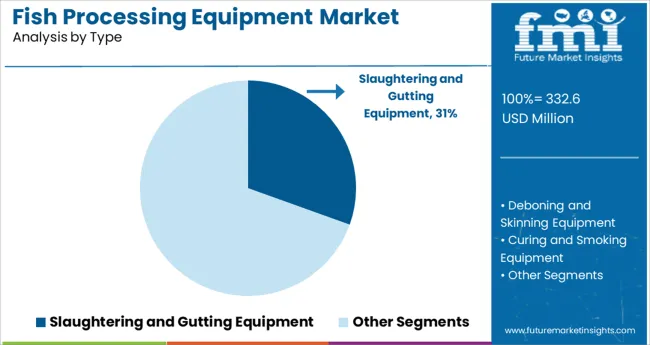
Based on the Type, Slaughtering and Gutting Equipment currently has the Highest Fish Processing Equipment Market Share

The slaughtering and gutting equipment segment is expected to grow at a CAGR of 3.5% during the forecast period.

The historical CAGR (2018 to 2022) for the market was 2.7%.

The process of gutting ensures that the nutrients are effectively derived from the fish, as the process essentially involves cutting the species and converting them into finer pieces. Moreover, the usage of stainless steel ensures easy cleaning of the slaughtering and gutting machines, and gives long life to them. ;

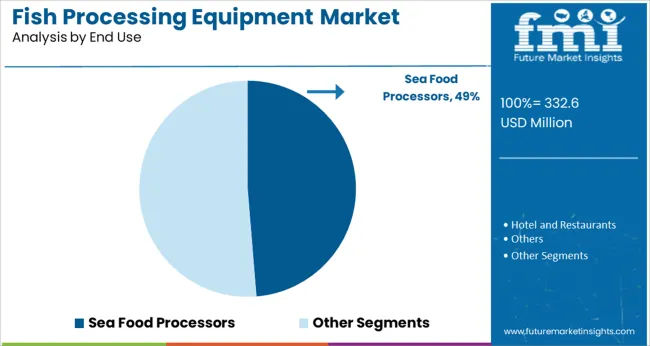
Based on the End Use, Sea Food Processors currently has the Highest Market Share

The seafood processors are expected to grow at a CAGR of 3.7% during the forecast period.

The historic CAGR (2018 to 2022) for the segment was 2.9%.

The seafood processors perform the core functionality of processing the fish and converting them into finer forms so that they can be further used by the end users. This segment is known to serve other sectors like pharmaceutical, hospitality, wholesale markets, etc.

Start-up Ecosystem

The start-ups serving the fish processing equipment market are making use of the latest technological developments to provide the best services to the customers. Some of the start-ups are working on seafood traceability using QR tags. This would allow the company to trace the fish’s journey back to its origins and define who caught it.

SmartCatch is providing fishermen with eyes within their nets, which helps capture and organize the data at the point of harvest, controls the net from the wheelhouse, and selectively releases the unwanted catch.

On 9th March’19, the company managed to raise US$ 2.5 million from Sustainable Ocean Alliance.

Competitive Landscape

The key players operating in the fish processing equipment market are on a mission of handling issues pertaining to the labor shortage. For this, the companies are developing automatic in-line cut-ups, which can handle up to 7200 broilers per hour.

Additionally, the key players are also developing systems that can handle both air and water-chilled products.

Some of the recent developments in the fish processing equipment market are:

  • In November 2022, Marel signed a new-3-year US$ 300 million term loan with an initial margin of 250bp on top of the Secured Overnight Funding Rate.
  • In May 2022, World Fishing and Aquaculture mentioned Kinarca systems, which provide freezing at ultra-low temperatures of -60oC.

Marel, Trifisk Manufacturing Inc., and Blois Fish Processing Automation Ltd. have been producing great quality fish processing equipment to serve the niche in the best way possible

Marel is a market leader in transforming the way food is processed. They have been producing high-quality, safe, and affordable food by providing solutions, services, and software to the poultry, meat, and fish processing industries. The business works on the core idea of sustainability.

Employing more than 7,000 who are working around the globe in over 30 countries, the company is willing to provide the best in the world products to its customers. Marel has been laying huge emphasis on innovation. The company is dedicated to surpassing industry standards in providing to development of the highest quality affordable food.

On 2nd November’22, Marel announced that it is refining its operating model to enable customer-centricity, enhancing end-to-end accountability and cross-business collaboration.

Blois Fish Processing Automation Ltd. has been offering quality assured, on-site sales, service, and maintenance to the North American fish processing market. The success of the company is built on integrity and building long-term relationships. The company has been providing top-quality food processing equipment, which coordinates Transport, Export, and Import.

The company has also been providing equipment and parts sourcing, equipment evaluations, consultation design, equipment cleaning services, and Business Supportive Resources. The company has always assisted its clients in innovating, and increasing the quality and quantity of throughput, to attain high-quality ratings.

Trifisk Manufacturing Inc. brings four trusted names together: Simnar, Simor, Fishmore, and Trifisk: all under a single brand. The company is a market leader in commercial fish scalers and continues to produce Simor brand fish de-scaler. The company takes pride in producing excellent fish scaler repairs and service for all its customers.

The company has also been providing machining and CAD Services using the latest 3D software. They accept DWG, DXF, IGES, and other software files.

Key Companies Profiled

  • Marel
  • World Fishing & Aquaculture
  • Trifisk Manufacturing Inc.
  • MTC Food Processing Equipment
  • Blois Fish Processing Automation Ltd.

Fish Processing Equipment Market Segmentation

By Type:

  • Slaughtering and Gutting Equipment
  • Deboning and Skinning Equipment
  • Curing and Smoking Equipment
  • Other Types

By Application:

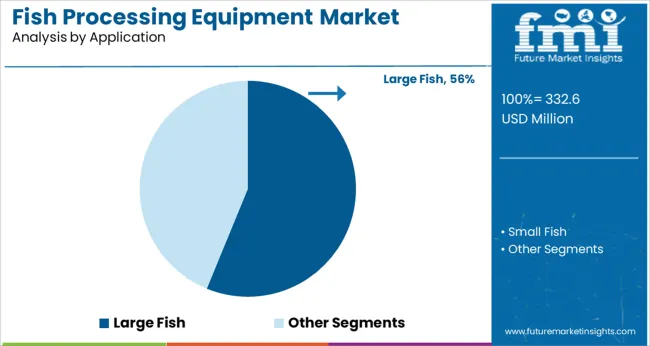
  • Large Fish
  • Small Fish

By End Use:

  • Hotel and Restaurants
  • Sea Food Processors
  • Others

By Operating Mechanism:

  • Mechanical
  • Electrical

By Region:

  • North America
  • Latin America
  • Asia Pacific
  • Middle East and Africa (MEA)
  • Europe

Frequently Asked Questions

What is the Fish Processing Equipment Market Size as on 2023?

The fish processing equipment market is valued at US$ 308.1 million as of 2023.

At what rate is the Global Fish Processing Equipment Market expected to grow?

The fish processing equipment market is expected to grow at a CAGR of around 3.9% over the forecast period.

What is the Expected Valuation of Fish Processing Equipment Market by 2033?

By 2033, the fish processing equipment market is expected to be valued at US$ 451.6 million.

Which Region is the Largest Fish Processing Equipment Market?

Asia Pacific is the largest fish processing equipment market.

What are the Main Drivers for Fish Processing Equipment Market?

The main drivers are: reduced process errors and safe mode of operation.

Table of Content

1. Executive Summary | Fish Processing Equipment Market

    1.1. Global Market Outlook

    1.2. Demand-side Trends

    1.3. Supply-side Trends

    1.4. Technology Roadmap Analysis

    1.5. Analysis and Recommendations

2. Market Overview

    2.1. Market Coverage / Taxonomy

    2.2. Market Definition / Scope / Limitations

3. Market Background

    3.1. Market Dynamics

        3.1.1. Drivers

        3.1.2. Restraints

        3.1.3. Opportunity

        3.1.4. Trends

    3.2. Scenario Forecast

        3.2.1. Demand in Optimistic Scenario

        3.2.2. Demand in Likely Scenario

        3.2.3. Demand in Conservative Scenario

    3.3. Opportunity Map Analysis

    3.4. Product Life Cycle Analysis

    3.5. Supply Chain Analysis

        3.5.1. Supply Side Participants and their Roles

            3.5.1.1. Producers

            3.5.1.2. Mid-Level Participants (Traders/ Agents/ Brokers)

            3.5.1.3. Wholesalers and Distributors

        3.5.2. Value Added and Value Created at Node in the Supply Chain

        3.5.3. List of Raw Material Suppliers

        3.5.4. List of Existing and Potential Buyer’s

    3.6. Investment Feasibility Matrix

    3.7. Value Chain Analysis

        3.7.1. Profit Margin Analysis

        3.7.2. Wholesalers and Distributors

        3.7.3. Retailers

    3.8. PESTLE and Porter’s Analysis

    3.9. Regulatory Landscape

        3.9.1. By Key Regions

        3.9.2. By Key Countries

    3.10. Regional Parent Market Outlook

    3.11. Production and Consumption Statistics

    3.12. Import and Export Statistics

4. Global Market Analysis 2018 to 2022 and Forecast, 2023 to 2033

    4.1. Historical Market Size Value (US$ million) & Volume (Units) Analysis, 2018 to 2022

    4.2. Current and Future Market Size Value (US$ million) & Volume (Units) Projections, 2023 to 2033

        4.2.1. Y-o-Y Growth Trend Analysis

        4.2.2. Absolute $ Opportunity Analysis

5. Global Market Analysis 2018 to 2022 and Forecast 2023 to 2033, By Type

    5.1. Introduction / Key Findings

    5.2. Historical Market Size Value (US$ million) & Volume (Units) Analysis By Type, 2018 to 2022

    5.3. Current and Future Market Size Value (US$ million) & Volume (Units) Analysis and Forecast By Type, 2023 to 2033

        5.3.1. Slaughtering and Gutting Equipment

        5.3.2. Deboning and Skinning Equipment

        5.3.3. Curing & Smoking Equipment

        5.3.4. Other Types

    5.4. Y-o-Y Growth Trend Analysis By Type, 2018 to 2022

    5.5. Absolute $ Opportunity Analysis By Type, 2023 to 2033

6. Global Market Analysis 2018 to 2022 and Forecast 2023 to 2033, By Application

    6.1. Introduction / Key Findings

    6.2. Historical Market Size Value (US$ million) & Volume (Units) Analysis By Application, 2018 to 2022

    6.3. Current and Future Market Size Value (US$ million) & Volume (Units) Analysis and Forecast By Application, 2023 to 2033

        6.3.1. Large Fish

        6.3.2. Small Fish

    6.4. Y-o-Y Growth Trend Analysis By Application, 2018 to 2022

    6.5. Absolute $ Opportunity Analysis By Application, 2023 to 2033

7. Global Market Analysis 2018 to 2022 and Forecast 2023 to 2033, By End Use

    7.1. Introduction / Key Findings

    7.2. Historical Market Size Value (US$ million) & Volume (Units) Analysis By End Use, 2018 to 2022

    7.3. Current and Future Market Size Value (US$ million) & Volume (Units) Analysis and Forecast By End Use, 2023 to 2033

        7.3.1. Hotel & Restaurants

        7.3.2. Sea Food Processors

        7.3.3. Others

    7.4. Y-o-Y Growth Trend Analysis By End Use, 2018 to 2022

    7.5. Absolute $ Opportunity Analysis By End Use, 2023 to 2033

8. Global Market Analysis 2018 to 2022 and Forecast 2023 to 2033, By Operating Mechanism

    8.1. Introduction / Key Findings

    8.2. Historical Market Size Value (US$ million) & Volume (Units) Analysis By Operating Mechanism, 2018 to 2022

    8.3. Current and Future Market Size Value (US$ million) & Volume (Units) Analysis and Forecast By Operating Mechanism, 2023 to 2033

        8.3.1. Mechanical

        8.3.2. Electrical

    8.4. Y-o-Y Growth Trend Analysis By Operating Mechanism, 2018 to 2022

    8.5. Absolute $ Opportunity Analysis By Operating Mechanism, 2023 to 2033

9. Global Market Analysis 2018 to 2022 and Forecast 2023 to 2033, By Region

    9.1. Introduction

    9.2. Historical Market Size Value (US$ million) & Volume (Units) Analysis By Region, 2018 to 2022

    9.3. Current Market Size Value (US$ million) & Volume (Units) Analysis and Forecast By Region, 2023 to 2033

        9.3.1. North America

        9.3.2. Latin America

        9.3.3. Europe

        9.3.4. Asia Pacific

        9.3.5. Middle East and Africa (MEA)

    9.4. Market Attractiveness Analysis By Region

10. North America Market Analysis 2018 to 2022 and Forecast 2023 to 2033, By Country

    10.1. Historical Market Size Value (US$ million) & Volume (Units) Trend Analysis By Market Taxonomy, 2018 to 2022

    10.2. Market Size Value (US$ million) & Volume (Units) Forecast By Market Taxonomy, 2023 to 2033

        10.2.1. By Country

            10.2.1.1. The USA

            10.2.1.2. Canada

        10.2.2. By Type

        10.2.3. By Application

        10.2.4. By End Use

        10.2.5. By Operating Mechanism

    10.3. Market Attractiveness Analysis

        10.3.1. By Country

        10.3.2. By Type

        10.3.3. By Application

        10.3.4. By End Use

        10.3.5. By Operating Mechanism

    10.4. Key Takeaways

11. Latin America Market Analysis 2018 to 2022 and Forecast 2023 to 2033, By Country

    11.1. Historical Market Size Value (US$ million) & Volume (Units) Trend Analysis By Market Taxonomy, 2018 to 2022

    11.2. Market Size Value (US$ million) & Volume (Units) Forecast By Market Taxonomy, 2023 to 2033

        11.2.1. By Country

            11.2.1.1. Brazil

            11.2.1.2. Mexico

            11.2.1.3. Rest of Latin America

        11.2.2. By Type

        11.2.3. By Application

        11.2.4. By End Use

        11.2.5. By Operating Mechanism

    11.3. Market Attractiveness Analysis

        11.3.1. By Country

        11.3.2. By Type

        11.3.3. By Application

        11.3.4. By End Use

        11.3.5. By Operating Mechanism

    11.4. Key Takeaways

12. Europe Market Analysis 2018 to 2022 and Forecast 2023 to 2033, By Country

    12.1. Historical Market Size Value (US$ million) & Volume (Units) Trend Analysis By Market Taxonomy, 2018 to 2022

    12.2. Market Size Value (US$ million) & Volume (Units) Forecast By Market Taxonomy, 2023 to 2033

        12.2.1. By Country

            12.2.1.1. Germany

            12.2.1.2. The United Kingdom

            12.2.1.3. France

            12.2.1.4. Spain

            12.2.1.5. Italy

            12.2.1.6. Rest of Europe

        12.2.2. By Type

        12.2.3. By Application

        12.2.4. By End Use

        12.2.5. By Operating Mechanism

    12.3. Market Attractiveness Analysis

        12.3.1. By Country

        12.3.2. By Type

        12.3.3. By Application

        12.3.4. By End Use

        12.3.5. By Operating Mechanism

    12.4. Key Takeaways

13. Asia Pacific Market Analysis 2018 to 2022 and Forecast 2023 to 2033, By Country

    13.1. Historical Market Size Value (US$ million) & Volume (Units) Trend Analysis By Market Taxonomy, 2018 to 2022

    13.2. Market Size Value (US$ million) & Volume (Units) Forecast By Market Taxonomy, 2023 to 2033

        13.2.1. By Country

            13.2.1.1. China

            13.2.1.2. Japan

            13.2.1.3. South Korea

            13.2.1.4. Singapore

            13.2.1.5. Thailand

            13.2.1.6. Indonesia

            13.2.1.7. Australia

            13.2.1.8. New Zealand

            13.2.1.9. Rest of Asia Pacific

        13.2.2. By Type

        13.2.3. By Application

        13.2.4. By End Use

        13.2.5. By Operating Mechanism

    13.3. Market Attractiveness Analysis

        13.3.1. By Country

        13.3.2. By Type

        13.3.3. By Application

        13.3.4. By End Use

        13.3.5. By Operating Mechanism

    13.4. Key Takeaways

14. MEA Market Analysis 2018 to 2022 and Forecast 2023 to 2033, By Country

    14.1. Historical Market Size Value (US$ million) & Volume (Units) Trend Analysis By Market Taxonomy, 2018 to 2022

    14.2. Market Size Value (US$ million) & Volume (Units) Forecast By Market Taxonomy, 2023 to 2033

        14.2.1. By Country

            14.2.1.1. GCC Countries

            14.2.1.2. South Africa

            14.2.1.3. Israel

            14.2.1.4. Rest of MEA

        14.2.2. By Type

        14.2.3. By Application

        14.2.4. By End Use

        14.2.5. By Operating Mechanism

    14.3. Market Attractiveness Analysis

        14.3.1. By Country

        14.3.2. By Type

        14.3.3. By Application

        14.3.4. By End Use

        14.3.5. By Operating Mechanism

    14.4. Key Takeaways

15. Key Countries Market Analysis

    15.1. The USA

        15.1.1. Pricing Analysis

        15.1.2. Market Share Analysis, 2022

            15.1.2.1. By Type

            15.1.2.2. By Application

            15.1.2.3. By End Use

            15.1.2.4. By Operating Mechanism

    15.2. Canada

        15.2.1. Pricing Analysis

        15.2.2. Market Share Analysis, 2022

            15.2.2.1. By Type

            15.2.2.2. By Application

            15.2.2.3. By End Use

            15.2.2.4. By Operating Mechanism

    15.3. Brazil

        15.3.1. Pricing Analysis

        15.3.2. Market Share Analysis, 2022

            15.3.2.1. By Type

            15.3.2.2. By Application

            15.3.2.3. By End Use

            15.3.2.4. By Operating Mechanism

    15.4. Mexico

        15.4.1. Pricing Analysis

        15.4.2. Market Share Analysis, 2022

            15.4.2.1. By Type

            15.4.2.2. By Application

            15.4.2.3. By End Use

            15.4.2.4. By Operating Mechanism

    15.5. Germany

        15.5.1. Pricing Analysis

        15.5.2. Market Share Analysis, 2022

            15.5.2.1. By Type

            15.5.2.2. By Application

            15.5.2.3. By End Use

            15.5.2.4. By Operating Mechanism

    15.6. The United Kingdom

        15.6.1. Pricing Analysis

        15.6.2. Market Share Analysis, 2022

            15.6.2.1. By Type

            15.6.2.2. By Application

            15.6.2.3. By End Use

            15.6.2.4. By Operating Mechanism

    15.7. France

        15.7.1. Pricing Analysis

        15.7.2. Market Share Analysis, 2022

            15.7.2.1. By Type

            15.7.2.2. By Application

            15.7.2.3. By End Use

            15.7.2.4. By Operating Mechanism

    15.8. Spain

        15.8.1. Pricing Analysis

        15.8.2. Market Share Analysis, 2022

            15.8.2.1. By Type

            15.8.2.2. By Application

            15.8.2.3. By End Use

            15.8.2.4. By Operating Mechanism

    15.9. Italy

        15.9.1. Pricing Analysis

        15.9.2. Market Share Analysis, 2022

            15.9.2.1. By Type

            15.9.2.2. By Application

            15.9.2.3. By End Use

            15.9.2.4. By Operating Mechanism

    15.10. China

        15.10.1. Pricing Analysis

        15.10.2. Market Share Analysis, 2022

            15.10.2.1. By Type

            15.10.2.2. By Application

            15.10.2.3. By End Use

            15.10.2.4. By Operating Mechanism

    15.11. Japan

        15.11.1. Pricing Analysis

        15.11.2. Market Share Analysis, 2022

            15.11.2.1. By Type

            15.11.2.2. By Application

            15.11.2.3. By End Use

            15.11.2.4. By Operating Mechanism

    15.12. South Korea

        15.12.1. Pricing Analysis

        15.12.2. Market Share Analysis, 2022

            15.12.2.1. By Type

            15.12.2.2. By Application

            15.12.2.3. By End Use

            15.12.2.4. By Operating Mechanism

    15.13. Singapore

        15.13.1. Pricing Analysis

        15.13.2. Market Share Analysis, 2022

            15.13.2.1. By Type

            15.13.2.2. By Application

            15.13.2.3. By End Use

            15.13.2.4. By Operating Mechanism

    15.14. Thailand

        15.14.1. Pricing Analysis

        15.14.2. Market Share Analysis, 2022

            15.14.2.1. By Type

            15.14.2.2. By Application

            15.14.2.3. By End Use

            15.14.2.4. By Operating Mechanism

    15.15. Indonesia

        15.15.1. Pricing Analysis

        15.15.2. Market Share Analysis, 2022

            15.15.2.1. By Type

            15.15.2.2. By Application

            15.15.2.3. By End Use

            15.15.2.4. By Operating Mechanism

    15.16. Australia

        15.16.1. Pricing Analysis

        15.16.2. Market Share Analysis, 2022

            15.16.2.1. By Type

            15.16.2.2. By Application

            15.16.2.3. By End Use

            15.16.2.4. By Operating Mechanism

    15.17. New Zealand

        15.17.1. Pricing Analysis

        15.17.2. Market Share Analysis, 2022

            15.17.2.1. By Type

            15.17.2.2. By Application

            15.17.2.3. By End Use

            15.17.2.4. By Operating Mechanism

    15.18. GCC Countries

        15.18.1. Pricing Analysis

        15.18.2. Market Share Analysis, 2022

            15.18.2.1. By Type

            15.18.2.2. By Application

            15.18.2.3. By End Use

            15.18.2.4. By Operating Mechanism

    15.19. South Africa

        15.19.1. Pricing Analysis

        15.19.2. Market Share Analysis, 2022

            15.19.2.1. By Type

            15.19.2.2. By Application

            15.19.2.3. By End Use

            15.19.2.4. By Operating Mechanism

    15.20. Israel

        15.20.1. Pricing Analysis

        15.20.2. Market Share Analysis, 2022

            15.20.2.1. By Type

            15.20.2.2. By Application

            15.20.2.3. By End Use

            15.20.2.4. By Operating Mechanism

16. Market Structure Analysis

    16.1. Competition Dashboard

    16.2. Competition Benchmarking

    16.3. Market Share Analysis of Top Players

        16.3.1. By Regional

        16.3.2. By Type

        16.3.3. By Application

        16.3.4. By End Use

        16.3.5. By Operating Mechanism

17. Competition Analysis

    17.1. Competition Deep Dive

        17.1.1. Marel

            17.1.1.1. Overview

            17.1.1.2. Product Portfolio

            17.1.1.3. Profitability by Market Segments

            17.1.1.4. Sales Footprint

            17.1.1.5. Strategy Overview

                17.1.1.5.1. Marketing Strategy

                17.1.1.5.2. Product Strategy

                17.1.1.5.3. Channel Strategy

        17.1.2. World Fishing & Aquaculture

            17.1.2.1. Overview

            17.1.2.2. Product Portfolio

            17.1.2.3. Profitability by Market Segments

            17.1.2.4. Sales Footprint

            17.1.2.5. Strategy Overview

                17.1.2.5.1. Marketing Strategy

                17.1.2.5.2. Product Strategy

                17.1.2.5.3. Channel Strategy

        17.1.3. Trifisk Manufacturing Inc.

            17.1.3.1. Overview

            17.1.3.2. Product Portfolio

            17.1.3.3. Profitability by Market Segments

            17.1.3.4. Sales Footprint

            17.1.3.5. Strategy Overview

                17.1.3.5.1. Marketing Strategy

                17.1.3.5.2. Product Strategy

                17.1.3.5.3. Channel Strategy

        17.1.4. MTC Food Processing Equipment

            17.1.4.1. Overview

            17.1.4.2. Product Portfolio

            17.1.4.3. Profitability by Market Segments

            17.1.4.4. Sales Footprint

            17.1.4.5. Strategy Overview

                17.1.4.5.1. Marketing Strategy

                17.1.4.5.2. Product Strategy

                17.1.4.5.3. Channel Strategy

        17.1.5. Blois Fish Processing Automation Ltd.

            17.1.5.1. Overview

            17.1.5.2. Product Portfolio

            17.1.5.3. Profitability by Market Segments

            17.1.5.4. Sales Footprint

            17.1.5.5. Strategy Overview

                17.1.5.5.1. Marketing Strategy

                17.1.5.5.2. Product Strategy

                17.1.5.5.3. Channel Strategy

        17.1.6. P.P.U.H. Karpowicz

            17.1.6.1. Overview

            17.1.6.2. Product Portfolio

            17.1.6.3. Profitability by Market Segments

            17.1.6.4. Sales Footprint

            17.1.6.5. Strategy Overview

                17.1.6.5.1. Marketing Strategy

                17.1.6.5.2. Product Strategy

                17.1.6.5.3. Channel Strategy

        17.1.7. Pisces Fish Machinery

            17.1.7.1. Overview

            17.1.7.2. Product Portfolio

            17.1.7.3. Profitability by Market Segments

            17.1.7.4. Sales Footprint

            17.1.7.5. Strategy Overview

                17.1.7.5.1. Marketing Strategy

                17.1.7.5.2. Product Strategy

                17.1.7.5.3. Channel Strategy

        17.1.8. Pearce Processing Systems

            17.1.8.1. Overview

            17.1.8.2. Product Portfolio

            17.1.8.3. Profitability by Market Segments

            17.1.8.4. Sales Footprint

            17.1.8.5. Strategy Overview

                17.1.8.5.1. Marketing Strategy

                17.1.8.5.2. Product Strategy

                17.1.8.5.3. Channel Strategy

        17.1.9. Uni-Food Technic A/S

            17.1.9.1. Overview

            17.1.9.2. Product Portfolio

            17.1.9.3. Profitability by Market Segments

            17.1.9.4. Sales Footprint

            17.1.9.5. Strategy Overview

                17.1.9.5.1. Marketing Strategy

                17.1.9.5.2. Product Strategy

                17.1.9.5.3. Channel Strategy

        17.1.10. Pearce Processing Systems

            17.1.10.1. Overview

            17.1.10.2. Product Portfolio

            17.1.10.3. Profitability by Market Segments

            17.1.10.4. Sales Footprint

            17.1.10.5. Strategy Overview

                17.1.10.5.1. Marketing Strategy

                17.1.10.5.2. Product Strategy

                17.1.10.5.3. Channel Strategy

18. Assumptions & Acronyms Used

19. Research Methodology

List of Tables

Table 1: Global Market Value (US$ million) Forecast by Region, 2018 to 2033

Table 2: Global Market Volume (Units) Forecast by Region, 2018 to 2033

Table 3: Global Market Value (US$ million) Forecast by Type, 2018 to 2033

Table 4: Global Market Volume (Units) Forecast by Type, 2018 to 2033

Table 5: Global Market Value (US$ million) Forecast by Application, 2018 to 2033

Table 6: Global Market Volume (Units) Forecast by Application, 2018 to 2033

Table 7: Global Market Value (US$ million) Forecast by End Use, 2018 to 2033

Table 8: Global Market Volume (Units) Forecast by End Use, 2018 to 2033

Table 9: Global Market Value (US$ million) Forecast by Operating Mechanism, 2018 to 2033

Table 10: Global Market Volume (Units) Forecast by Operating Mechanism, 2018 to 2033

Table 11: North America Market Value (US$ million) Forecast by Country, 2018 to 2033

Table 12: North America Market Volume (Units) Forecast by Country, 2018 to 2033

Table 13: North America Market Value (US$ million) Forecast by Type, 2018 to 2033

Table 14: North America Market Volume (Units) Forecast by Type, 2018 to 2033

Table 15: North America Market Value (US$ million) Forecast by Application, 2018 to 2033

Table 16: North America Market Volume (Units) Forecast by Application, 2018 to 2033

Table 17: North America Market Value (US$ million) Forecast by End Use, 2018 to 2033

Table 18: North America Market Volume (Units) Forecast by End Use, 2018 to 2033

Table 19: North America Market Value (US$ million) Forecast by Operating Mechanism, 2018 to 2033

Table 20: North America Market Volume (Units) Forecast by Operating Mechanism, 2018 to 2033

Table 21: Latin America Market Value (US$ million) Forecast by Country, 2018 to 2033

Table 22: Latin America Market Volume (Units) Forecast by Country, 2018 to 2033

Table 23: Latin America Market Value (US$ million) Forecast by Type, 2018 to 2033

Table 24: Latin America Market Volume (Units) Forecast by Type, 2018 to 2033

Table 25: Latin America Market Value (US$ million) Forecast by Application, 2018 to 2033

Table 26: Latin America Market Volume (Units) Forecast by Application, 2018 to 2033

Table 27: Latin America Market Value (US$ million) Forecast by End Use, 2018 to 2033

Table 28: Latin America Market Volume (Units) Forecast by End Use, 2018 to 2033

Table 29: Latin America Market Value (US$ million) Forecast by Operating Mechanism, 2018 to 2033

Table 30: Latin America Market Volume (Units) Forecast by Operating Mechanism, 2018 to 2033

Table 31: Europe Market Value (US$ million) Forecast by Country, 2018 to 2033

Table 32: Europe Market Volume (Units) Forecast by Country, 2018 to 2033

Table 33: Europe Market Value (US$ million) Forecast by Type, 2018 to 2033

Table 34: Europe Market Volume (Units) Forecast by Type, 2018 to 2033

Table 35: Europe Market Value (US$ million) Forecast by Application, 2018 to 2033

Table 36: Europe Market Volume (Units) Forecast by Application, 2018 to 2033

Table 37: Europe Market Value (US$ million) Forecast by End Use, 2018 to 2033

Table 38: Europe Market Volume (Units) Forecast by End Use, 2018 to 2033

Table 39: Europe Market Value (US$ million) Forecast by Operating Mechanism, 2018 to 2033

Table 40: Europe Market Volume (Units) Forecast by Operating Mechanism, 2018 to 2033

Table 41: Asia Pacific Market Value (US$ million) Forecast by Country, 2018 to 2033

Table 42: Asia Pacific Market Volume (Units) Forecast by Country, 2018 to 2033

Table 43: Asia Pacific Market Value (US$ million) Forecast by Type, 2018 to 2033

Table 44: Asia Pacific Market Volume (Units) Forecast by Type, 2018 to 2033

Table 45: Asia Pacific Market Value (US$ million) Forecast by Application, 2018 to 2033

Table 46: Asia Pacific Market Volume (Units) Forecast by Application, 2018 to 2033

Table 47: Asia Pacific Market Value (US$ million) Forecast by End Use, 2018 to 2033

Table 48: Asia Pacific Market Volume (Units) Forecast by End Use, 2018 to 2033

Table 49: Asia Pacific Market Value (US$ million) Forecast by Operating Mechanism, 2018 to 2033

Table 50: Asia Pacific Market Volume (Units) Forecast by Operating Mechanism, 2018 to 2033

Table 51: MEA Market Value (US$ million) Forecast by Country, 2018 to 2033

Table 52: MEA Market Volume (Units) Forecast by Country, 2018 to 2033

Table 53: MEA Market Value (US$ million) Forecast by Type, 2018 to 2033

Table 54: MEA Market Volume (Units) Forecast by Type, 2018 to 2033

Table 55: MEA Market Value (US$ million) Forecast by Application, 2018 to 2033

Table 56: MEA Market Volume (Units) Forecast by Application, 2018 to 2033

Table 57: MEA Market Value (US$ million) Forecast by End Use, 2018 to 2033

Table 58: MEA Market Volume (Units) Forecast by End Use, 2018 to 2033

Table 59: MEA Market Value (US$ million) Forecast by Operating Mechanism, 2018 to 2033

Table 60: MEA Market Volume (Units) Forecast by Operating Mechanism, 2018 to 2033

List of Charts

Figure 1: Global Market Value (US$ million) by Type, 2023 to 2033

Figure 2: Global Market Value (US$ million) by Application, 2023 to 2033

Figure 3: Global Market Value (US$ million) by End Use, 2023 to 2033

Figure 4: Global Market Value (US$ million) by Operating Mechanism, 2023 to 2033

Figure 5: Global Market Value (US$ million) by Region, 2023 to 2033

Figure 6: Global Market Value (US$ million) Analysis by Region, 2018 to 2033

Figure 7: Global Market Volume (Units) Analysis by Region, 2018 to 2033

Figure 8: Global Market Value Share (%) and BPS Analysis by Region, 2023 to 2033

Figure 9: Global Market Y-o-Y Growth (%) Projections by Region, 2023 to 2033

Figure 10: Global Market Value (US$ million) Analysis by Type, 2018 to 2033

Figure 11: Global Market Volume (Units) Analysis by Type, 2018 to 2033

Figure 12: Global Market Value Share (%) and BPS Analysis by Type, 2023 to 2033

Figure 13: Global Market Y-o-Y Growth (%) Projections by Type, 2023 to 2033

Figure 14: Global Market Value (US$ million) Analysis by Application, 2018 to 2033

Figure 15: Global Market Volume (Units) Analysis by Application, 2018 to 2033

Figure 16: Global Market Value Share (%) and BPS Analysis by Application, 2023 to 2033

Figure 17: Global Market Y-o-Y Growth (%) Projections by Application, 2023 to 2033

Figure 18: Global Market Value (US$ million) Analysis by End Use, 2018 to 2033

Figure 19: Global Market Volume (Units) Analysis by End Use, 2018 to 2033

Figure 20: Global Market Value Share (%) and BPS Analysis by End Use, 2023 to 2033

Figure 21: Global Market Y-o-Y Growth (%) Projections by End Use, 2023 to 2033

Figure 22: Global Market Value (US$ million) Analysis by Operating Mechanism, 2018 to 2033

Figure 23: Global Market Volume (Units) Analysis by Operating Mechanism, 2018 to 2033

Figure 24: Global Market Value Share (%) and BPS Analysis by Operating Mechanism, 2023 to 2033

Figure 25: Global Market Y-o-Y Growth (%) Projections by Operating Mechanism, 2023 to 2033

Figure 26: Global Market Attractiveness by Type, 2023 to 2033

Figure 27: Global Market Attractiveness by Application, 2023 to 2033

Figure 28: Global Market Attractiveness by End Use, 2023 to 2033

Figure 29: Global Market Attractiveness by Operating Mechanism, 2023 to 2033

Figure 30: Global Market Attractiveness by Region, 2023 to 2033

Figure 31: North America Market Value (US$ million) by Type, 2023 to 2033

Figure 32: North America Market Value (US$ million) by Application, 2023 to 2033

Figure 33: North America Market Value (US$ million) by End Use, 2023 to 2033

Figure 34: North America Market Value (US$ million) by Operating Mechanism, 2023 to 2033

Figure 35: North America Market Value (US$ million) by Country, 2023 to 2033

Figure 36: North America Market Value (US$ million) Analysis by Country, 2018 to 2033

Figure 37: North America Market Volume (Units) Analysis by Country, 2018 to 2033

Figure 38: North America Market Value Share (%) and BPS Analysis by Country, 2023 to 2033

Figure 39: North America Market Y-o-Y Growth (%) Projections by Country, 2023 to 2033

Figure 40: North America Market Value (US$ million) Analysis by Type, 2018 to 2033

Figure 41: North America Market Volume (Units) Analysis by Type, 2018 to 2033

Figure 42: North America Market Value Share (%) and BPS Analysis by Type, 2023 to 2033

Figure 43: North America Market Y-o-Y Growth (%) Projections by Type, 2023 to 2033

Figure 44: North America Market Value (US$ million) Analysis by Application, 2018 to 2033

Figure 45: North America Market Volume (Units) Analysis by Application, 2018 to 2033

Figure 46: North America Market Value Share (%) and BPS Analysis by Application, 2023 to 2033

Figure 47: North America Market Y-o-Y Growth (%) Projections by Application, 2023 to 2033

Figure 48: North America Market Value (US$ million) Analysis by End Use, 2018 to 2033

Figure 49: North America Market Volume (Units) Analysis by End Use, 2018 to 2033

Figure 50: North America Market Value Share (%) and BPS Analysis by End Use, 2023 to 2033

Figure 51: North America Market Y-o-Y Growth (%) Projections by End Use, 2023 to 2033

Figure 52: North America Market Value (US$ million) Analysis by Operating Mechanism, 2018 to 2033

Figure 53: North America Market Volume (Units) Analysis by Operating Mechanism, 2018 to 2033

Figure 54: North America Market Value Share (%) and BPS Analysis by Operating Mechanism, 2023 to 2033

Figure 55: North America Market Y-o-Y Growth (%) Projections by Operating Mechanism, 2023 to 2033

Figure 56: North America Market Attractiveness by Type, 2023 to 2033

Figure 57: North America Market Attractiveness by Application, 2023 to 2033

Figure 58: North America Market Attractiveness by End Use, 2023 to 2033

Figure 59: North America Market Attractiveness by Operating Mechanism, 2023 to 2033

Figure 60: North America Market Attractiveness by Country, 2023 to 2033

Figure 61: Latin America Market Value (US$ million) by Type, 2023 to 2033

Figure 62: Latin America Market Value (US$ million) by Application, 2023 to 2033

Figure 63: Latin America Market Value (US$ million) by End Use, 2023 to 2033

Figure 64: Latin America Market Value (US$ million) by Operating Mechanism, 2023 to 2033

Figure 65: Latin America Market Value (US$ million) by Country, 2023 to 2033

Figure 66: Latin America Market Value (US$ million) Analysis by Country, 2018 to 2033

Figure 67: Latin America Market Volume (Units) Analysis by Country, 2018 to 2033

Figure 68: Latin America Market Value Share (%) and BPS Analysis by Country, 2023 to 2033

Figure 69: Latin America Market Y-o-Y Growth (%) Projections by Country, 2023 to 2033

Figure 70: Latin America Market Value (US$ million) Analysis by Type, 2018 to 2033

Figure 71: Latin America Market Volume (Units) Analysis by Type, 2018 to 2033

Figure 72: Latin America Market Value Share (%) and BPS Analysis by Type, 2023 to 2033

Figure 73: Latin America Market Y-o-Y Growth (%) Projections by Type, 2023 to 2033

Figure 74: Latin America Market Value (US$ million) Analysis by Application, 2018 to 2033

Figure 75: Latin America Market Volume (Units) Analysis by Application, 2018 to 2033

Figure 76: Latin America Market Value Share (%) and BPS Analysis by Application, 2023 to 2033

Figure 77: Latin America Market Y-o-Y Growth (%) Projections by Application, 2023 to 2033

Figure 78: Latin America Market Value (US$ million) Analysis by End Use, 2018 to 2033

Figure 79: Latin America Market Volume (Units) Analysis by End Use, 2018 to 2033

Figure 80: Latin America Market Value Share (%) and BPS Analysis by End Use, 2023 to 2033

Figure 81: Latin America Market Y-o-Y Growth (%) Projections by End Use, 2023 to 2033

Figure 82: Latin America Market Value (US$ million) Analysis by Operating Mechanism, 2018 to 2033

Figure 83: Latin America Market Volume (Units) Analysis by Operating Mechanism, 2018 to 2033

Figure 84: Latin America Market Value Share (%) and BPS Analysis by Operating Mechanism, 2023 to 2033

Figure 85: Latin America Market Y-o-Y Growth (%) Projections by Operating Mechanism, 2023 to 2033

Figure 86: Latin America Market Attractiveness by Type, 2023 to 2033

Figure 87: Latin America Market Attractiveness by Application, 2023 to 2033

Figure 88: Latin America Market Attractiveness by End Use, 2023 to 2033

Figure 89: Latin America Market Attractiveness by Operating Mechanism, 2023 to 2033

Figure 90: Latin America Market Attractiveness by Country, 2023 to 2033

Figure 91: Europe Market Value (US$ million) by Type, 2023 to 2033

Figure 92: Europe Market Value (US$ million) by Application, 2023 to 2033

Figure 93: Europe Market Value (US$ million) by End Use, 2023 to 2033

Figure 94: Europe Market Value (US$ million) by Operating Mechanism, 2023 to 2033

Figure 95: Europe Market Value (US$ million) by Country, 2023 to 2033

Figure 96: Europe Market Value (US$ million) Analysis by Country, 2018 to 2033

Figure 97: Europe Market Volume (Units) Analysis by Country, 2018 to 2033

Figure 98: Europe Market Value Share (%) and BPS Analysis by Country, 2023 to 2033

Figure 99: Europe Market Y-o-Y Growth (%) Projections by Country, 2023 to 2033

Figure 100: Europe Market Value (US$ million) Analysis by Type, 2018 to 2033

Figure 101: Europe Market Volume (Units) Analysis by Type, 2018 to 2033

Figure 102: Europe Market Value Share (%) and BPS Analysis by Type, 2023 to 2033

Figure 103: Europe Market Y-o-Y Growth (%) Projections by Type, 2023 to 2033

Figure 104: Europe Market Value (US$ million) Analysis by Application, 2018 to 2033

Figure 105: Europe Market Volume (Units) Analysis by Application, 2018 to 2033

Figure 106: Europe Market Value Share (%) and BPS Analysis by Application, 2023 to 2033

Figure 107: Europe Market Y-o-Y Growth (%) Projections by Application, 2023 to 2033

Figure 108: Europe Market Value (US$ million) Analysis by End Use, 2018 to 2033

Figure 109: Europe Market Volume (Units) Analysis by End Use, 2018 to 2033

Figure 110: Europe Market Value Share (%) and BPS Analysis by End Use, 2023 to 2033

Figure 111: Europe Market Y-o-Y Growth (%) Projections by End Use, 2023 to 2033

Figure 112: Europe Market Value (US$ million) Analysis by Operating Mechanism, 2018 to 2033

Figure 113: Europe Market Volume (Units) Analysis by Operating Mechanism, 2018 to 2033

Figure 114: Europe Market Value Share (%) and BPS Analysis by Operating Mechanism, 2023 to 2033

Figure 115: Europe Market Y-o-Y Growth (%) Projections by Operating Mechanism, 2023 to 2033

Figure 116: Europe Market Attractiveness by Type, 2023 to 2033

Figure 117: Europe Market Attractiveness by Application, 2023 to 2033

Figure 118: Europe Market Attractiveness by End Use, 2023 to 2033

Figure 119: Europe Market Attractiveness by Operating Mechanism, 2023 to 2033

Figure 120: Europe Market Attractiveness by Country, 2023 to 2033

Figure 121: Asia Pacific Market Value (US$ million) by Type, 2023 to 2033

Figure 122: Asia Pacific Market Value (US$ million) by Application, 2023 to 2033

Figure 123: Asia Pacific Market Value (US$ million) by End Use, 2023 to 2033

Figure 124: Asia Pacific Market Value (US$ million) by Operating Mechanism, 2023 to 2033

Figure 125: Asia Pacific Market Value (US$ million) by Country, 2023 to 2033

Figure 126: Asia Pacific Market Value (US$ million) Analysis by Country, 2018 to 2033

Figure 127: Asia Pacific Market Volume (Units) Analysis by Country, 2018 to 2033

Figure 128: Asia Pacific Market Value Share (%) and BPS Analysis by Country, 2023 to 2033

Figure 129: Asia Pacific Market Y-o-Y Growth (%) Projections by Country, 2023 to 2033

Figure 130: Asia Pacific Market Value (US$ million) Analysis by Type, 2018 to 2033

Figure 131: Asia Pacific Market Volume (Units) Analysis by Type, 2018 to 2033

Figure 132: Asia Pacific Market Value Share (%) and BPS Analysis by Type, 2023 to 2033

Figure 133: Asia Pacific Market Y-o-Y Growth (%) Projections by Type, 2023 to 2033

Figure 134: Asia Pacific Market Value (US$ million) Analysis by Application, 2018 to 2033

Figure 135: Asia Pacific Market Volume (Units) Analysis by Application, 2018 to 2033

Figure 136: Asia Pacific Market Value Share (%) and BPS Analysis by Application, 2023 to 2033

Figure 137: Asia Pacific Market Y-o-Y Growth (%) Projections by Application, 2023 to 2033

Figure 138: Asia Pacific Market Value (US$ million) Analysis by End Use, 2018 to 2033

Figure 139: Asia Pacific Market Volume (Units) Analysis by End Use, 2018 to 2033

Figure 140: Asia Pacific Market Value Share (%) and BPS Analysis by End Use, 2023 to 2033

Figure 141: Asia Pacific Market Y-o-Y Growth (%) Projections by End Use, 2023 to 2033

Figure 142: Asia Pacific Market Value (US$ million) Analysis by Operating Mechanism, 2018 to 2033

Figure 143: Asia Pacific Market Volume (Units) Analysis by Operating Mechanism, 2018 to 2033

Figure 144: Asia Pacific Market Value Share (%) and BPS Analysis by Operating Mechanism, 2023 to 2033

Figure 145: Asia Pacific Market Y-o-Y Growth (%) Projections by Operating Mechanism, 2023 to 2033

Figure 146: Asia Pacific Market Attractiveness by Type, 2023 to 2033

Figure 147: Asia Pacific Market Attractiveness by Application, 2023 to 2033

Figure 148: Asia Pacific Market Attractiveness by End Use, 2023 to 2033

Figure 149: Asia Pacific Market Attractiveness by Operating Mechanism, 2023 to 2033

Figure 150: Asia Pacific Market Attractiveness by Country, 2023 to 2033

Figure 151: MEA Market Value (US$ million) by Type, 2023 to 2033

Figure 152: MEA Market Value (US$ million) by Application, 2023 to 2033

Figure 153: MEA Market Value (US$ million) by End Use, 2023 to 2033

Figure 154: MEA Market Value (US$ million) by Operating Mechanism, 2023 to 2033

Figure 155: MEA Market Value (US$ million) by Country, 2023 to 2033

Figure 156: MEA Market Value (US$ million) Analysis by Country, 2018 to 2033

Figure 157: MEA Market Volume (Units) Analysis by Country, 2018 to 2033

Figure 158: MEA Market Value Share (%) and BPS Analysis by Country, 2023 to 2033

Figure 159: MEA Market Y-o-Y Growth (%) Projections by Country, 2023 to 2033

Figure 160: MEA Market Value (US$ million) Analysis by Type, 2018 to 2033

Figure 161: MEA Market Volume (Units) Analysis by Type, 2018 to 2033

Figure 162: MEA Market Value Share (%) and BPS Analysis by Type, 2023 to 2033

Figure 163: MEA Market Y-o-Y Growth (%) Projections by Type, 2023 to 2033

Figure 164: MEA Market Value (US$ million) Analysis by Application, 2018 to 2033

Figure 165: MEA Market Volume (Units) Analysis by Application, 2018 to 2033

Figure 166: MEA Market Value Share (%) and BPS Analysis by Application, 2023 to 2033

Figure 167: MEA Market Y-o-Y Growth (%) Projections by Application, 2023 to 2033

Figure 168: MEA Market Value (US$ million) Analysis by End Use, 2018 to 2033

Figure 169: MEA Market Volume (Units) Analysis by End Use, 2018 to 2033

Figure 170: MEA Market Value Share (%) and BPS Analysis by End Use, 2023 to 2033

Figure 171: MEA Market Y-o-Y Growth (%) Projections by End Use, 2023 to 2033

Figure 172: MEA Market Value (US$ million) Analysis by Operating Mechanism, 2018 to 2033

Figure 173: MEA Market Volume (Units) Analysis by Operating Mechanism, 2018 to 2033

Figure 174: MEA Market Value Share (%) and BPS Analysis by Operating Mechanism, 2023 to 2033

Figure 175: MEA Market Y-o-Y Growth (%) Projections by Operating Mechanism, 2023 to 2033

Figure 176: MEA Market Attractiveness by Type, 2023 to 2033

Figure 177: MEA Market Attractiveness by Application, 2023 to 2033

Figure 178: MEA Market Attractiveness by End Use, 2023 to 2033

Figure 179: MEA Market Attractiveness by Operating Mechanism, 2023 to 2033

Figure 180: MEA Market Attractiveness by Country, 2023 to 2033

Explore Process Automation Insights

View Reports

Fish Processing Equipment Market