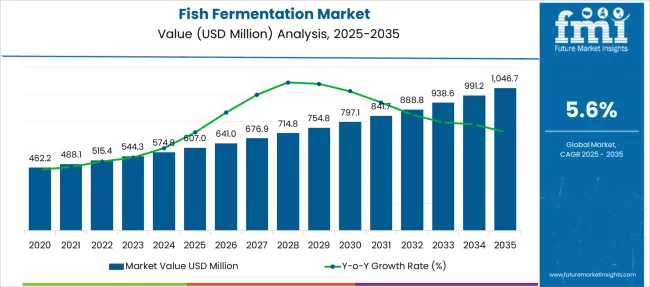
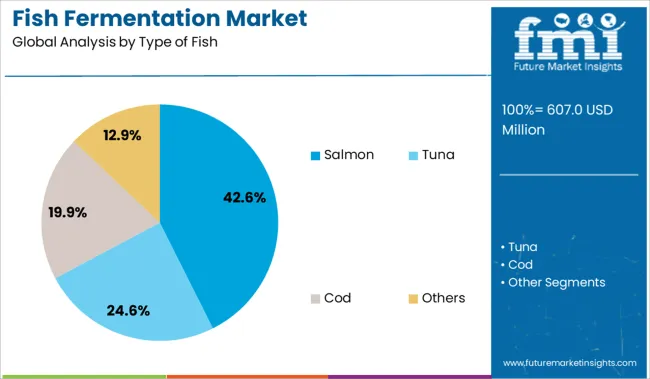
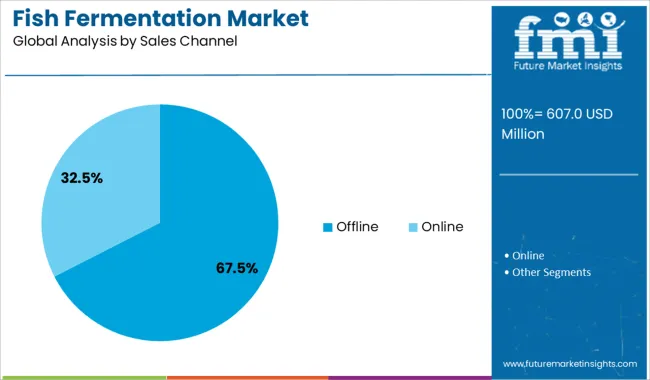
The global fish fermentation market size is anticipated to grow from USD 544.3 million in 2023 to USD 983.6 million by 2033, with overall sales accelerating at a CAGR of 5.6% throughout the forecast period (2023 to 2033). Rising demand for fermented fish products across the globe is a key factor boosting sales in the market.
Fish fermentation is a process in which fish are preserved through fermentation. The process of fermentation creates an anaerobic environment that prevents the growth of spoilage bacteria, thereby extending the shelf life of products.
Fish fermentation has been a traditional method of preservation in many cultures around the world. During fish fermentation, a wide range of products is released that have preservation effects and limit the growth of spoilage or microbiota in fish products.
The most common type of fish fermented is salted and dried fish. The salt helps to draw out water from the fish, creating an inhospitable environment for bacteria to grow. The process of fermentation can take several weeks to several months, depending on the type of fish and the desired level of fermentation.
During fermentation, the proteins in the fish break down into amino acids, which give fermented fish its characteristic umami flavor. Fermented fish is a rich source of probiotics, which are beneficial for gut health. It is also a good source of vitamin B12 and omega-3 fatty acids.
Fermented fish products are rich sources of protein, vitamins, minerals, and probiotics. They are also low in calories and fat and offer several health benefits, including improving digestion, boosting immunity, reducing inflammation, and preventing cancer.
Thus, growing awareness about the health benefits of fermented fish products across the globe will continue to boost the global fish fermentation market during the forecast period.
Furthermore, increasing export of fermented fish products due to their longer shelf life and a growing number of start-ups entering this space will further expand the global market over the next decade.
Regionally, with a market valuation of USD 217.7 Million, Europe will continue to remain at the top of the ladder in the fish fermentation industry, accounting for around 40% share in 2023. The North American market is currently valued at USD 206.8 Million and it holds a 38% share of the global market.
Asia Pacific on the other hand is emerging as a lucrative market for fish fermentation companies due to increasing health awareness, a rapidly growing population, and rising consumption of fermented fish products. A market valuation of over USD 98.0 Million has been predicted for Asia pacific market by FMI 2023.
Attribute | Key Insights |
---|---|
Fish Fermentation Market Estimated Value (2023) | USD 544.3 Million |
Projected Market Value (2033) | USD 983.6 Million |
Value-based CAGR (2023 to 2033) | 5.6% |
Top 3 Countries' Market Share | 35.6% |
According to Future Market Insights, the global demand for fish fermentation grew at a CAGR of 4.6% during the historical period from 2018 to 2022. However, with growing demand for fermented food products across the world, the overall fish fermentation market is set to expand at a steady CAGR of 5.6% between 2023 and 2033.
The market is driven by the growing demand for fermented fish products, due to their health benefits. Fermented fish products are rich in protein and omega-3 fatty acids, which are known to improve heart health and cognitive function.
Similarly, increasing demand for healthy and nutritious food products along with rising awareness about the health benefits of fermented fish is expected to boost the fish fermentation industry over the next ten years.
A number of influential factors have been identified that are expected to spur growth in the global fish fermentation market during the projection period (2023 to 2033). Besides the proliferating aspects prevailing in the market, the analysts at FMI have also analyzed the restraining elements, lucrative opportunities, and upcoming threats that can somehow influence sales.
The drivers, restraints, opportunities, and threats (DROTs) identified are as follows:
DRIVERS
RESTRAINTS
OPPORTUNITIES
THREATS
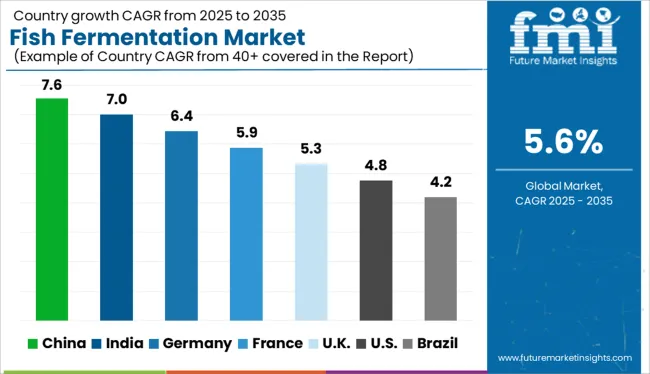
Rising Demand for Healthy and Nutritious Food Products Boosting Market in the USA
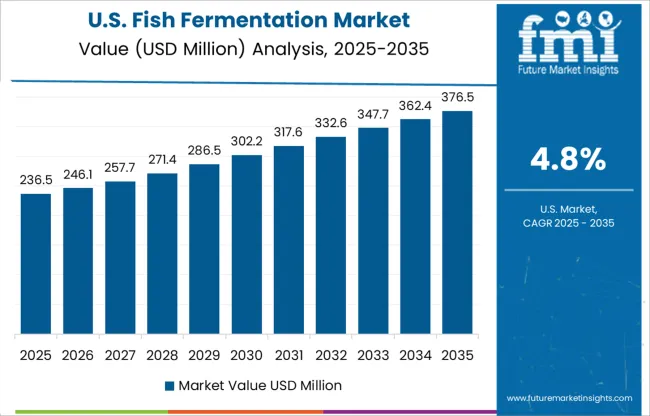
As per FMI, the USA currently holds around 68% revenue share of the North American fish fermentation industry and it is set to expand at a significant CAGR over the projection period (2023 to 2033).
The major factor driving the growth in the USA market is the increasing demand for healthy and nutritious food. Moreover, the growing popularity of fermented fish products among consumers is another key factor that is propelling the demand for fish fermentation in the country.
Fermented fish is becoming widely popular among Americans owing to its high nutritive value, the bioavailability of minerals, easy digestibility, and organoleptic characteristics. As a result, there has been a rapid surge in demand for fermented fish products in the country and this trend will continue during the forecast period.
Growing Popularity of Fermented Foods to Fuel Sales in the UK
The UK is expected to account for over 22% share of the Europe market in 2023. Furthermore, sales of fermented fish products in the country are likely to rise at a steady pace as consumer preference towards healthy and nutritional food products continues to increase.
FMI predicts the UK market to grow rapidly over the next ten years, with new players and products entering the market every year. This growth is being driven by the increasing popularity of fermented foods, as well as the health benefits associated with fermentation.
Increasing Awareness About the Health Benefits of Fermented Fish Items Pushing Demand in China
According to Future Market Insights, with around 32% market share, China will continue to dominate the Asia Pacific market during the forecast period. Factors such as the high consumption of seafood in China, the rapidly rising population, and increasing disposable income are driving the demand for fish products, which in turn is fueling the growth of the fish fermentation industry.
Similarly, growing health consciousness among consumers is also boosting the market as fermented fish products are rich in omega-3 fatty acids, vitamins, and minerals.
Whole Fish Fermentation to Hold Substantial Share Through 2033
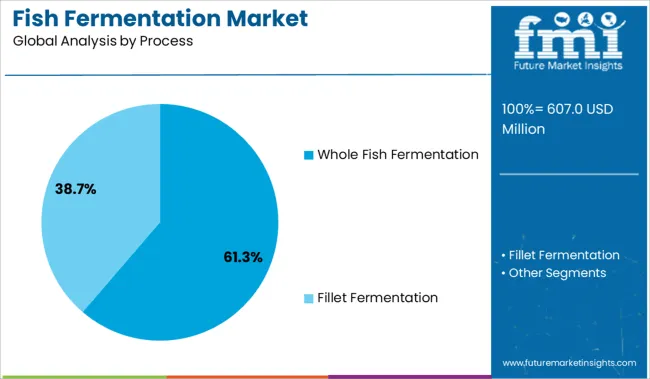
Based on the process, the global market for fish fermentation is segmented into whole fish fermentation and fillet fermentation. Among these, whole fish fermentation will continue to dominate the global market during the forecast period. This can be attributed to the growing popularity of fermenting whole fish rather than just fillets across various countries.
Several companies across countries like the USA, China, Germany, and Mexico use the process of whole fish fermentation as it allows them to produce large amounts of fermented fish products in quick intervals of time.
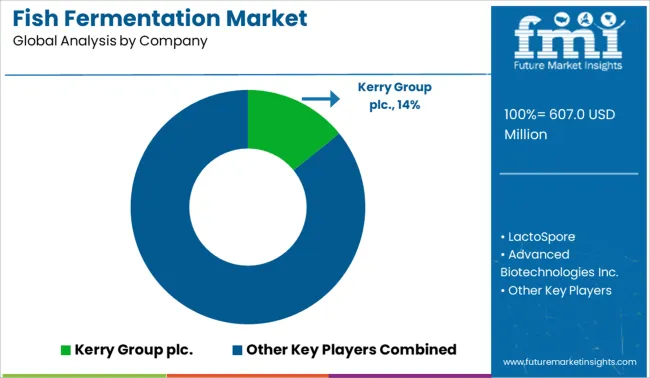
Key players in this market space include LactoSpore (India), Danisco A/S (Denmark), Advanced Biotechnologies Inc. (USA), Kerry Group plc (Ireland), and Associated British Foods plc (UK).
These players are focused on increasing their revenue shares by launching new products and investing in research and development. Furthermore, they are adopting strategies such as partnerships, acquisitions, mergers, facility expansions, and collaborations to expand their global footprint. For instance,
Attribute | Details |
---|---|
Estimated Market Size (2023) | USD 544.3 Million |
Projected Market Size (2033) | USD 983.6 Million |
Anticipated Growth Rate (2023 to 2033) | 5.6% CAGR |
Forecast Period | 2023 to 2033 |
Historical Data Available for | 2018 to 2022 |
Market Analysis | USD Million for Value and Units for Volume |
Key Regions Covered | North America; Latin America; Europe; Asia Pacific; Middle East & Africa (MEA); RoW |
Key Countries Covered | The USA, Germany, The UK, France, Spain, Italy, Brazil, Argentina, China, India, Japan, UAE,= Australia, New Zealand |
Key Segments Covered | Type of Fish, Process, Sales Channel, Geography |
Key Companies Profiled | LactoSpore; Danisco A/S; Advanced Biotechnologies Inc.; Kerry Group plc.; Associated British Foods plc; FMC Corporation; Omega Protein Corporation; TripleNine Group A/S; Corpesca S.A.; TASA; Colpex International; American Marine Ingredients; Pesquera Diamante S.A.; FF Skagen A/S |
Report Coverage | DROT Analysis, Market Forecast, Company Share Analysis, Market Dynamics and Challenges, Competitive Landscape, and Strategic Growth Initiatives |
Table 1: Global Market Value (US$ Million) Forecast by Region, 2018 to 2033
Table 2: Global Market Volume (MT) Forecast by Region, 2018 to 2033
Table 3: Global Market Value (US$ Million) Forecast by Type of Fish, 2018 to 2033
Table 4: Global Market Volume (MT) Forecast by Type of Fish, 2018 to 2033
Table 5: Global Market Value (US$ Million) Forecast by Process, 2018 to 2033
Table 6: Global Market Volume (MT) Forecast by Process, 2018 to 2033
Table 7: Global Market Value (US$ Million) Forecast by Sales Channel, 2018 to 2033
Table 8: Global Market Volume (MT) Forecast by Sales Channel, 2018 to 2033
Table 9: North America Market Value (US$ Million) Forecast by Country, 2018 to 2033
Table 10: North America Market Volume (MT) Forecast by Country, 2018 to 2033
Table 11: North America Market Value (US$ Million) Forecast by Type of Fish, 2018 to 2033
Table 12: North America Market Volume (MT) Forecast by Type of Fish, 2018 to 2033
Table 13: North America Market Value (US$ Million) Forecast by Process, 2018 to 2033
Table 14: North America Market Volume (MT) Forecast by Process, 2018 to 2033
Table 15: North America Market Value (US$ Million) Forecast by Sales Channel, 2018 to 2033
Table 16: North America Market Volume (MT) Forecast by Sales Channel, 2018 to 2033
Table 17: Latin America Market Value (US$ Million) Forecast by Country, 2018 to 2033
Table 18: Latin America Market Volume (MT) Forecast by Country, 2018 to 2033
Table 19: Latin America Market Value (US$ Million) Forecast by Type of Fish, 2018 to 2033
Table 20: Latin America Market Volume (MT) Forecast by Type of Fish, 2018 to 2033
Table 21: Latin America Market Value (US$ Million) Forecast by Process, 2018 to 2033
Table 22: Latin America Market Volume (MT) Forecast by Process, 2018 to 2033
Table 23: Latin America Market Value (US$ Million) Forecast by Sales Channel, 2018 to 2033
Table 24: Latin America Market Volume (MT) Forecast by Sales Channel, 2018 to 2033
Table 25: Europe Market Value (US$ Million) Forecast by Country, 2018 to 2033
Table 26: Europe Market Volume (MT) Forecast by Country, 2018 to 2033
Table 27: Europe Market Value (US$ Million) Forecast by Type of Fish, 2018 to 2033
Table 28: Europe Market Volume (MT) Forecast by Type of Fish, 2018 to 2033
Table 29: Europe Market Value (US$ Million) Forecast by Process, 2018 to 2033
Table 30: Europe Market Volume (MT) Forecast by Process, 2018 to 2033
Table 31: Europe Market Value (US$ Million) Forecast by Sales Channel, 2018 to 2033
Table 32: Europe Market Volume (MT) Forecast by Sales Channel, 2018 to 2033
Table 33: East Asia Market Value (US$ Million) Forecast by Country, 2018 to 2033
Table 34: East Asia Market Volume (MT) Forecast by Country, 2018 to 2033
Table 35: East Asia Market Value (US$ Million) Forecast by Type of Fish, 2018 to 2033
Table 36: East Asia Market Volume (MT) Forecast by Type of Fish, 2018 to 2033
Table 37: East Asia Market Value (US$ Million) Forecast by Process, 2018 to 2033
Table 38: East Asia Market Volume (MT) Forecast by Process, 2018 to 2033
Table 39: East Asia Market Value (US$ Million) Forecast by Sales Channel, 2018 to 2033
Table 40: East Asia Market Volume (MT) Forecast by Sales Channel, 2018 to 2033
Table 41: South Asia Market Value (US$ Million) Forecast by Country, 2018 to 2033
Table 42: South Asia Market Volume (MT) Forecast by Country, 2018 to 2033
Table 43: South Asia Market Value (US$ Million) Forecast by Type of Fish, 2018 to 2033
Table 44: South Asia Market Volume (MT) Forecast by Type of Fish, 2018 to 2033
Table 45: South Asia Market Value (US$ Million) Forecast by Process, 2018 to 2033
Table 46: South Asia Market Volume (MT) Forecast by Process, 2018 to 2033
Table 47: South Asia Market Value (US$ Million) Forecast by Sales Channel, 2018 to 2033
Table 48: South Asia Market Volume (MT) Forecast by Sales Channel, 2018 to 2033
Table 49: Oceania Market Value (US$ Million) Forecast by Country, 2018 to 2033
Table 50: Oceania Market Volume (MT) Forecast by Country, 2018 to 2033
Table 51: Oceania Market Value (US$ Million) Forecast by Type of Fish, 2018 to 2033
Table 52: Oceania Market Volume (MT) Forecast by Type of Fish, 2018 to 2033
Table 53: Oceania Market Value (US$ Million) Forecast by Process, 2018 to 2033
Table 54: Oceania Market Volume (MT) Forecast by Process, 2018 to 2033
Table 55: Oceania Market Value (US$ Million) Forecast by Sales Channel, 2018 to 2033
Table 56: Oceania Market Volume (MT) Forecast by Sales Channel, 2018 to 2033
Table 57: MEA Market Value (US$ Million) Forecast by Country, 2018 to 2033
Table 58: MEA Market Volume (MT) Forecast by Country, 2018 to 2033
Table 59: MEA Market Value (US$ Million) Forecast by Type of Fish, 2018 to 2033
Table 60: MEA Market Volume (MT) Forecast by Type of Fish, 2018 to 2033
Table 61: MEA Market Value (US$ Million) Forecast by Process, 2018 to 2033
Table 62: MEA Market Volume (MT) Forecast by Process, 2018 to 2033
Table 63: MEA Market Value (US$ Million) Forecast by Sales Channel, 2018 to 2033
Table 64: MEA Market Volume (MT) Forecast by Sales Channel, 2018 to 2033
Figure 1: Global Market Value (US$ Million) by Type of Fish, 2023 to 2033
Figure 2: Global Market Value (US$ Million) by Process, 2023 to 2033
Figure 3: Global Market Value (US$ Million) by Sales Channel, 2023 to 2033
Figure 4: Global Market Value (US$ Million) by Region, 2023 to 2033
Figure 5: Global Market Value (US$ Million) Analysis by Region, 2018 to 2033
Figure 6: Global Market Volume (MT) Analysis by Region, 2018 to 2033
Figure 7: Global Market Value Share (%) and BPS Analysis by Region, 2023 to 2033
Figure 8: Global Market Y-o-Y Growth (%) Projections by Region, 2023 to 2033
Figure 9: Global Market Value (US$ Million) Analysis by Type of Fish, 2018 to 2033
Figure 10: Global Market Volume (MT) Analysis by Type of Fish, 2018 to 2033
Figure 11: Global Market Value Share (%) and BPS Analysis by Type of Fish, 2023 to 2033
Figure 12: Global Market Y-o-Y Growth (%) Projections by Type of Fish, 2023 to 2033
Figure 13: Global Market Value (US$ Million) Analysis by Process, 2018 to 2033
Figure 14: Global Market Volume (MT) Analysis by Process, 2018 to 2033
Figure 15: Global Market Value Share (%) and BPS Analysis by Process, 2023 to 2033
Figure 16: Global Market Y-o-Y Growth (%) Projections by Process, 2023 to 2033
Figure 17: Global Market Value (US$ Million) Analysis by Sales Channel, 2018 to 2033
Figure 18: Global Market Volume (MT) Analysis by Sales Channel, 2018 to 2033
Figure 19: Global Market Value Share (%) and BPS Analysis by Sales Channel, 2023 to 2033
Figure 20: Global Market Y-o-Y Growth (%) Projections by Sales Channel, 2023 to 2033
Figure 21: Global Market Attractiveness by Type of Fish, 2023 to 2033
Figure 22: Global Market Attractiveness by Process, 2023 to 2033
Figure 23: Global Market Attractiveness by Sales Channel, 2023 to 2033
Figure 24: Global Market Attractiveness by Region, 2023 to 2033
Figure 25: North America Market Value (US$ Million) by Type of Fish, 2023 to 2033
Figure 26: North America Market Value (US$ Million) by Process, 2023 to 2033
Figure 27: North America Market Value (US$ Million) by Sales Channel, 2023 to 2033
Figure 28: North America Market Value (US$ Million) by Country, 2023 to 2033
Figure 29: North America Market Value (US$ Million) Analysis by Country, 2018 to 2033
Figure 30: North America Market Volume (MT) Analysis by Country, 2018 to 2033
Figure 31: North America Market Value Share (%) and BPS Analysis by Country, 2023 to 2033
Figure 32: North America Market Y-o-Y Growth (%) Projections by Country, 2023 to 2033
Figure 33: North America Market Value (US$ Million) Analysis by Type of Fish, 2018 to 2033
Figure 34: North America Market Volume (MT) Analysis by Type of Fish, 2018 to 2033
Figure 35: North America Market Value Share (%) and BPS Analysis by Type of Fish, 2023 to 2033
Figure 36: North America Market Y-o-Y Growth (%) Projections by Type of Fish, 2023 to 2033
Figure 37: North America Market Value (US$ Million) Analysis by Process, 2018 to 2033
Figure 38: North America Market Volume (MT) Analysis by Process, 2018 to 2033
Figure 39: North America Market Value Share (%) and BPS Analysis by Process, 2023 to 2033
Figure 40: North America Market Y-o-Y Growth (%) Projections by Process, 2023 to 2033
Figure 41: North America Market Value (US$ Million) Analysis by Sales Channel, 2018 to 2033
Figure 42: North America Market Volume (MT) Analysis by Sales Channel, 2018 to 2033
Figure 43: North America Market Value Share (%) and BPS Analysis by Sales Channel, 2023 to 2033
Figure 44: North America Market Y-o-Y Growth (%) Projections by Sales Channel, 2023 to 2033
Figure 45: North America Market Attractiveness by Type of Fish, 2023 to 2033
Figure 46: North America Market Attractiveness by Process, 2023 to 2033
Figure 47: North America Market Attractiveness by Sales Channel, 2023 to 2033
Figure 48: North America Market Attractiveness by Country, 2023 to 2033
Figure 49: Latin America Market Value (US$ Million) by Type of Fish, 2023 to 2033
Figure 50: Latin America Market Value (US$ Million) by Process, 2023 to 2033
Figure 51: Latin America Market Value (US$ Million) by Sales Channel, 2023 to 2033
Figure 52: Latin America Market Value (US$ Million) by Country, 2023 to 2033
Figure 53: Latin America Market Value (US$ Million) Analysis by Country, 2018 to 2033
Figure 54: Latin America Market Volume (MT) Analysis by Country, 2018 to 2033
Figure 55: Latin America Market Value Share (%) and BPS Analysis by Country, 2023 to 2033
Figure 56: Latin America Market Y-o-Y Growth (%) Projections by Country, 2023 to 2033
Figure 57: Latin America Market Value (US$ Million) Analysis by Type of Fish, 2018 to 2033
Figure 58: Latin America Market Volume (MT) Analysis by Type of Fish, 2018 to 2033
Figure 59: Latin America Market Value Share (%) and BPS Analysis by Type of Fish, 2023 to 2033
Figure 60: Latin America Market Y-o-Y Growth (%) Projections by Type of Fish, 2023 to 2033
Figure 61: Latin America Market Value (US$ Million) Analysis by Process, 2018 to 2033
Figure 62: Latin America Market Volume (MT) Analysis by Process, 2018 to 2033
Figure 63: Latin America Market Value Share (%) and BPS Analysis by Process, 2023 to 2033
Figure 64: Latin America Market Y-o-Y Growth (%) Projections by Process, 2023 to 2033
Figure 65: Latin America Market Value (US$ Million) Analysis by Sales Channel, 2018 to 2033
Figure 66: Latin America Market Volume (MT) Analysis by Sales Channel, 2018 to 2033
Figure 67: Latin America Market Value Share (%) and BPS Analysis by Sales Channel, 2023 to 2033
Figure 68: Latin America Market Y-o-Y Growth (%) Projections by Sales Channel, 2023 to 2033
Figure 69: Latin America Market Attractiveness by Type of Fish, 2023 to 2033
Figure 70: Latin America Market Attractiveness by Process, 2023 to 2033
Figure 71: Latin America Market Attractiveness by Sales Channel, 2023 to 2033
Figure 72: Latin America Market Attractiveness by Country, 2023 to 2033
Figure 73: Europe Market Value (US$ Million) by Type of Fish, 2023 to 2033
Figure 74: Europe Market Value (US$ Million) by Process, 2023 to 2033
Figure 75: Europe Market Value (US$ Million) by Sales Channel, 2023 to 2033
Figure 76: Europe Market Value (US$ Million) by Country, 2023 to 2033
Figure 77: Europe Market Value (US$ Million) Analysis by Country, 2018 to 2033
Figure 78: Europe Market Volume (MT) Analysis by Country, 2018 to 2033
Figure 79: Europe Market Value Share (%) and BPS Analysis by Country, 2023 to 2033
Figure 80: Europe Market Y-o-Y Growth (%) Projections by Country, 2023 to 2033
Figure 81: Europe Market Value (US$ Million) Analysis by Type of Fish, 2018 to 2033
Figure 82: Europe Market Volume (MT) Analysis by Type of Fish, 2018 to 2033
Figure 83: Europe Market Value Share (%) and BPS Analysis by Type of Fish, 2023 to 2033
Figure 84: Europe Market Y-o-Y Growth (%) Projections by Type of Fish, 2023 to 2033
Figure 85: Europe Market Value (US$ Million) Analysis by Process, 2018 to 2033
Figure 86: Europe Market Volume (MT) Analysis by Process, 2018 to 2033
Figure 87: Europe Market Value Share (%) and BPS Analysis by Process, 2023 to 2033
Figure 88: Europe Market Y-o-Y Growth (%) Projections by Process, 2023 to 2033
Figure 89: Europe Market Value (US$ Million) Analysis by Sales Channel, 2018 to 2033
Figure 90: Europe Market Volume (MT) Analysis by Sales Channel, 2018 to 2033
Figure 91: Europe Market Value Share (%) and BPS Analysis by Sales Channel, 2023 to 2033
Figure 92: Europe Market Y-o-Y Growth (%) Projections by Sales Channel, 2023 to 2033
Figure 93: Europe Market Attractiveness by Type of Fish, 2023 to 2033
Figure 94: Europe Market Attractiveness by Process, 2023 to 2033
Figure 95: Europe Market Attractiveness by Sales Channel, 2023 to 2033
Figure 96: Europe Market Attractiveness by Country, 2023 to 2033
Figure 97: East Asia Market Value (US$ Million) by Type of Fish, 2023 to 2033
Figure 98: East Asia Market Value (US$ Million) by Process, 2023 to 2033
Figure 99: East Asia Market Value (US$ Million) by Sales Channel, 2023 to 2033
Figure 100: East Asia Market Value (US$ Million) by Country, 2023 to 2033
Figure 101: East Asia Market Value (US$ Million) Analysis by Country, 2018 to 2033
Figure 102: East Asia Market Volume (MT) Analysis by Country, 2018 to 2033
Figure 103: East Asia Market Value Share (%) and BPS Analysis by Country, 2023 to 2033
Figure 104: East Asia Market Y-o-Y Growth (%) Projections by Country, 2023 to 2033
Figure 105: East Asia Market Value (US$ Million) Analysis by Type of Fish, 2018 to 2033
Figure 106: East Asia Market Volume (MT) Analysis by Type of Fish, 2018 to 2033
Figure 107: East Asia Market Value Share (%) and BPS Analysis by Type of Fish, 2023 to 2033
Figure 108: East Asia Market Y-o-Y Growth (%) Projections by Type of Fish, 2023 to 2033
Figure 109: East Asia Market Value (US$ Million) Analysis by Process, 2018 to 2033
Figure 110: East Asia Market Volume (MT) Analysis by Process, 2018 to 2033
Figure 111: East Asia Market Value Share (%) and BPS Analysis by Process, 2023 to 2033
Figure 112: East Asia Market Y-o-Y Growth (%) Projections by Process, 2023 to 2033
Figure 113: East Asia Market Value (US$ Million) Analysis by Sales Channel, 2018 to 2033
Figure 114: East Asia Market Volume (MT) Analysis by Sales Channel, 2018 to 2033
Figure 115: East Asia Market Value Share (%) and BPS Analysis by Sales Channel, 2023 to 2033
Figure 116: East Asia Market Y-o-Y Growth (%) Projections by Sales Channel, 2023 to 2033
Figure 117: East Asia Market Attractiveness by Type of Fish, 2023 to 2033
Figure 118: East Asia Market Attractiveness by Process, 2023 to 2033
Figure 119: East Asia Market Attractiveness by Sales Channel, 2023 to 2033
Figure 120: East Asia Market Attractiveness by Country, 2023 to 2033
Figure 121: South Asia Market Value (US$ Million) by Type of Fish, 2023 to 2033
Figure 122: South Asia Market Value (US$ Million) by Process, 2023 to 2033
Figure 123: South Asia Market Value (US$ Million) by Sales Channel, 2023 to 2033
Figure 124: South Asia Market Value (US$ Million) by Country, 2023 to 2033
Figure 125: South Asia Market Value (US$ Million) Analysis by Country, 2018 to 2033
Figure 126: South Asia Market Volume (MT) Analysis by Country, 2018 to 2033
Figure 127: South Asia Market Value Share (%) and BPS Analysis by Country, 2023 to 2033
Figure 128: South Asia Market Y-o-Y Growth (%) Projections by Country, 2023 to 2033
Figure 129: South Asia Market Value (US$ Million) Analysis by Type of Fish, 2018 to 2033
Figure 130: South Asia Market Volume (MT) Analysis by Type of Fish, 2018 to 2033
Figure 131: South Asia Market Value Share (%) and BPS Analysis by Type of Fish, 2023 to 2033
Figure 132: South Asia Market Y-o-Y Growth (%) Projections by Type of Fish, 2023 to 2033
Figure 133: South Asia Market Value (US$ Million) Analysis by Process, 2018 to 2033
Figure 134: South Asia Market Volume (MT) Analysis by Process, 2018 to 2033
Figure 135: South Asia Market Value Share (%) and BPS Analysis by Process, 2023 to 2033
Figure 136: South Asia Market Y-o-Y Growth (%) Projections by Process, 2023 to 2033
Figure 137: South Asia Market Value (US$ Million) Analysis by Sales Channel, 2018 to 2033
Figure 138: South Asia Market Volume (MT) Analysis by Sales Channel, 2018 to 2033
Figure 139: South Asia Market Value Share (%) and BPS Analysis by Sales Channel, 2023 to 2033
Figure 140: South Asia Market Y-o-Y Growth (%) Projections by Sales Channel, 2023 to 2033
Figure 141: South Asia Market Attractiveness by Type of Fish, 2023 to 2033
Figure 142: South Asia Market Attractiveness by Process, 2023 to 2033
Figure 143: South Asia Market Attractiveness by Sales Channel, 2023 to 2033
Figure 144: South Asia Market Attractiveness by Country, 2023 to 2033
Figure 145: Oceania Market Value (US$ Million) by Type of Fish, 2023 to 2033
Figure 146: Oceania Market Value (US$ Million) by Process, 2023 to 2033
Figure 147: Oceania Market Value (US$ Million) by Sales Channel, 2023 to 2033
Figure 148: Oceania Market Value (US$ Million) by Country, 2023 to 2033
Figure 149: Oceania Market Value (US$ Million) Analysis by Country, 2018 to 2033
Figure 150: Oceania Market Volume (MT) Analysis by Country, 2018 to 2033
Figure 151: Oceania Market Value Share (%) and BPS Analysis by Country, 2023 to 2033
Figure 152: Oceania Market Y-o-Y Growth (%) Projections by Country, 2023 to 2033
Figure 153: Oceania Market Value (US$ Million) Analysis by Type of Fish, 2018 to 2033
Figure 154: Oceania Market Volume (MT) Analysis by Type of Fish, 2018 to 2033
Figure 155: Oceania Market Value Share (%) and BPS Analysis by Type of Fish, 2023 to 2033
Figure 156: Oceania Market Y-o-Y Growth (%) Projections by Type of Fish, 2023 to 2033
Figure 157: Oceania Market Value (US$ Million) Analysis by Process, 2018 to 2033
Figure 158: Oceania Market Volume (MT) Analysis by Process, 2018 to 2033
Figure 159: Oceania Market Value Share (%) and BPS Analysis by Process, 2023 to 2033
Figure 160: Oceania Market Y-o-Y Growth (%) Projections by Process, 2023 to 2033
Figure 161: Oceania Market Value (US$ Million) Analysis by Sales Channel, 2018 to 2033
Figure 162: Oceania Market Volume (MT) Analysis by Sales Channel, 2018 to 2033
Figure 163: Oceania Market Value Share (%) and BPS Analysis by Sales Channel, 2023 to 2033
Figure 164: Oceania Market Y-o-Y Growth (%) Projections by Sales Channel, 2023 to 2033
Figure 165: Oceania Market Attractiveness by Type of Fish, 2023 to 2033
Figure 166: Oceania Market Attractiveness by Process, 2023 to 2033
Figure 167: Oceania Market Attractiveness by Sales Channel, 2023 to 2033
Figure 168: Oceania Market Attractiveness by Country, 2023 to 2033
Figure 169: MEA Market Value (US$ Million) by Type of Fish, 2023 to 2033
Figure 170: MEA Market Value (US$ Million) by Process, 2023 to 2033
Figure 171: MEA Market Value (US$ Million) by Sales Channel, 2023 to 2033
Figure 172: MEA Market Value (US$ Million) by Country, 2023 to 2033
Figure 173: MEA Market Value (US$ Million) Analysis by Country, 2018 to 2033
Figure 174: MEA Market Volume (MT) Analysis by Country, 2018 to 2033
Figure 175: MEA Market Value Share (%) and BPS Analysis by Country, 2023 to 2033
Figure 176: MEA Market Y-o-Y Growth (%) Projections by Country, 2023 to 2033
Figure 177: MEA Market Value (US$ Million) Analysis by Type of Fish, 2018 to 2033
Figure 178: MEA Market Volume (MT) Analysis by Type of Fish, 2018 to 2033
Figure 179: MEA Market Value Share (%) and BPS Analysis by Type of Fish, 2023 to 2033
Figure 180: MEA Market Y-o-Y Growth (%) Projections by Type of Fish, 2023 to 2033
Figure 181: MEA Market Value (US$ Million) Analysis by Process, 2018 to 2033
Figure 182: MEA Market Volume (MT) Analysis by Process, 2018 to 2033
Figure 183: MEA Market Value Share (%) and BPS Analysis by Process, 2023 to 2033
Figure 184: MEA Market Y-o-Y Growth (%) Projections by Process, 2023 to 2033
Figure 185: MEA Market Value (US$ Million) Analysis by Sales Channel, 2018 to 2033
Figure 186: MEA Market Volume (MT) Analysis by Sales Channel, 2018 to 2033
Figure 187: MEA Market Value Share (%) and BPS Analysis by Sales Channel, 2023 to 2033
Figure 188: MEA Market Y-o-Y Growth (%) Projections by Sales Channel, 2023 to 2033
Figure 189: MEA Market Attractiveness by Type of Fish, 2023 to 2033
Figure 190: MEA Market Attractiveness by Process, 2023 to 2033
Figure 191: MEA Market Attractiveness by Sales Channel, 2023 to 2033
Figure 192: MEA Market Attractiveness by Country, 2023 to 2033
The global market for fish fermentation is expected to reach a valuation of USD 544.3 Million in 2023.
Demand for fish fermentation is expected to rise at 5.6% CAGR between 2023 and 2033.
The global fish fermentation industry is forecast to surpass a valuation of USD 983.6 Million by the end of 2033.
The USA holds around 68% of the North American fish fermentation industry.
The USA, Canada, Mexico, Argentina, Brazil, Germany, the UK, France, Italy, Spain, Russia, China, Japan, India, and Australia are the major countries driving demand for fish fermentation.
LactoSpore, Danisco A/S, Advanced Biotechnologies Inc., Kerry Group plc., and Associated British Foods plc are the top 5 market players in the fish fermentation industry.
With a market valuation of USD 31.4 Million, China is expected to account for 32% of Asia Pacific market in 2023.
Explore Similar Insights
Thank you!
You will receive an email from our Business Development Manager. Please be sure to check your SPAM/JUNK folder too.