Zero-Fishmeal Feed Market Size and Share Forecast Outlook 2025 to 2035

The Zero-Fishmeal Feed Market is expected to record a valuation of USD 956.1 million in 2025 and USD 1,696.7 million in 2035, with an increase of USD 740.6 million, which equals a growth of ~77% over the decade. The overall expansion represents a CAGR of 5.9% and a ~1.8X increase in market size.
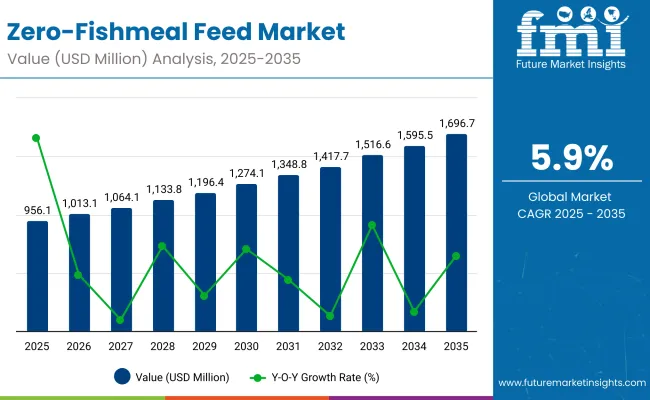
Quick Stats: Zero-Fishmeal Feed Market

  • Zero-Fishmeal Feed Market Value (2025): USD 0.956 billion
  • Zero-Fishmeal Feed Market Forecast Value (2035): USD 1.697 billion
  • Zero-Fishmeal Feed Market Forecast CAGR (2025 to 2035): 5.9%
  • Leading Segment in 2025: Plant-based proteins (35%)
  • Key Growth Regions: Asia-Pacific, Europe, North America
  • Top Key Players: (example list for template fit) Skretting, Cargill, BioMar, ADM, Green Plains, Calysta, Innovafeed, Protix, Ÿnsect, Corbion

Zero Fishmeal Feed Market

Zero-Fishmeal Feed Market Key Takeaways

Metric Value
Market Estimated Value in (2025E) USD 0.96 billion
Market Forecast Value in (2035F) USD 1.70 billion
Forecast CAGR (2025 to 2035) 5.9%

During the first five-year period from 2025 to 2030, the market increases from USD 0.95 billion to 1.27 billion adding USD 0.32 billion, which accounts for ~42.9% of the total decade growth. This phase records steady adoption in aquaculture, poultry, and swine nutrition, driven by sustainability mandates and the need to de-risk supply chains from volatile fishmeal costs. Plant-based proteins dominate this period as they cater to over 35% of formulations requiring scalable, affordable, and eco-efficient inputs.

The second half from 2030 to 2035 contributes USD 0.42 billion, equal to ~57.1% of total growth, as the market jumps from USD 1.27 billion to USD 1.70 billion. This acceleration is powered by the wider deployment of single-cell proteins, insect-based meals, and algae-derived ingredients in aqua feeds and specialty livestock diets. Blended/functional formulations together capture a larger share above XX% by the end of the decade. Circular-economy sourcing and compliance add recurring revenue, increasing the specialty ingredient share beyond XX% in total value.

From 2020 to 2024, the Zero-Fishmeal Feed Market expanded from USD 716.4 million to USD 902.6 million, supported by the rapid adoption of plant-based proteins such as soy, pea, and corn gluten. During this period, the competitive environment was dominated by large feed manufacturers and integrators controlling nearly 70% of revenue, with leaders such as Cargill, ADM, and BioMar advancing scalable plant-based formulations for poultry and aquaculture feed. Competitive differentiation relied on cost efficiency, protein digestibility, and amino acid balancing, while premium additives such as enzymes and probiotics were often bundled as complementary features rather than standalone revenue drivers.

Demand for Zero-Fishmeal Feed is projected to reach USD 956.1 million in 2025, and the revenue mix will shift as microbial, insect-based, and algae-derived proteins expand their share beyond 25%. Traditional plant-protein leaders face rising competition from specialty players leveraging fermentation, insect bioconversion, and algae cultivation platforms. Major incumbents are pivoting toward hybrid formulations that integrate multiple protein sources with additive fortification to maintain performance standards and meet sustainability mandates. New entrants specializing in precision fermentation, single-cell proteins, and circular-economy models are gaining visibility. The competitive advantage is moving away from reliance on commodity proteins alone toward ecosystem strength, sustainability compliance, and recurring value through functional and fortified feed solutions.

Why the Zero-Fishmeal Feed Market is Growing?

Advances in alternative protein technologies have expanded ingredient availability and improved feed efficiency, allowing more sustainable replacement of fishmeal in diverse applications. Plant-based proteins such as soy, pea, and corn gluten have gained widespread use due to their scalability, affordability, and ability to deliver balanced amino acid profiles. The rise of single-cell proteins and insect meals has contributed to enhanced digestibility, gut health benefits, and resilience against raw material volatility. Aquaculture and poultry nutrition are driving demand for zero-fishmeal feed solutions that can integrate seamlessly into existing production systems without compromising performance.

Expansion of functional formulations including enzyme fortification, probiotics, and omega-3 enrichment has further fueled market growth by enabling higher feed conversion efficiency and improved animal welfare outcomes. Innovations in algae-based proteins and fermentation-derived ingredients are expected to unlock new high-value applications. Segment growth is anticipated to be led by plant-based proteins in the near term, while insect- and microbial-derived proteins accelerate adoption later in the forecast due to their precision, adaptability, and strong sustainability credentials.

Segmental Analysis

The market is segmented by protein source, livestock/aquaculture species, functionality, form, additive integration, sales channel, and region. Protein sources include plant-based proteins such as soy, pea, corn gluten, wheat gluten, canola meal, and lupin meal, as well as algae-based proteins, insect-based proteins, single-cell proteins, fermentation-derived proteins, and blended protein systems. Live stock and aquaculture species segmentation spans poultry feed, swine feed, ruminant feed, and aquaculture, which includes shrimp, tilapia, salmonids, carp, and catfish.

Based on functionality, the market is classified into growth performance optimization, feed conversion ratio (FCR) improvement, gut health support, and sustainability-driven environmental impact reduction. By form, zero-fishmeal feed is offered as mash, pellets, crumbles, and extruded feed to match varying farm and hatchery requirements. Additive integration covers enzyme-fortified feed, probiotic and prebiotic fortified blends, omega-3 enriched formulations, and vitamin and mineral fortification.

Sales channels include direct distribution to farmers and integrators, through large feed manufacturers, and via regional distributors and agents. Regionally, the market scope spans North America, Europe, Asia-Pacific, Latin America, and the Middle East & Africa, with Asia-Pacific emerging as the fastest-growing hub due to strong aquaculture expansion and sustainability mandates.
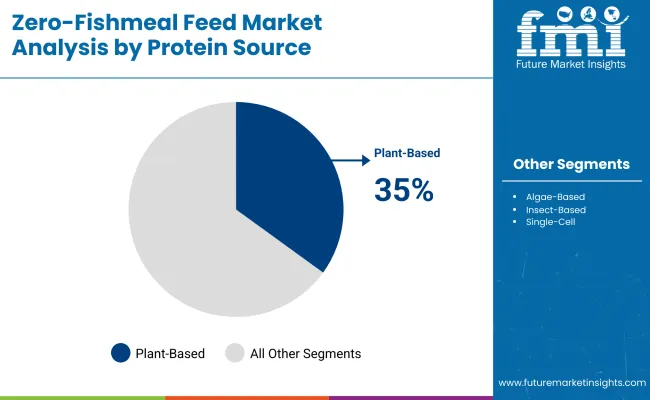
Insights into the Protein Source Segment with Plant-Based Proteins Leading in Market Share

Zero Fishmeal Feed Market By Protein

Protein Source Share (%)
Plant-based Proteins 35%
Algae-based Proteins 25%
Insect-based Proteins 15%
Single-cell Proteins 10%
Fermentation-derived Proteins 10%
Blended Protein Sources 5%

Plant-based proteins are projected to account for the dominant share of 35% in the Zero-Fishmeal Feed Market in 2025, driven by the large-scale use of soy protein concentrate, pea protein, and corn gluten meal in aquaculture and poultry diets. These ingredients offer balanced amino acid profiles, lower costs, and proven scalability across diverse geographies. Momentum is also being recorded in insect-based proteins, particularly black soldier fly larvae meal, which is increasingly recognized for its digestibility and sustainable lifecycle.

Algae-derived proteins are gaining traction for their omega-3 enrichment capacity, while single-cell and fermentation-derived proteins enhance gut health and reduce environmental impacts. Blended protein systems are expected to rise as integrators combine plant, insect, and microbial inputs to optimize feed performance. The dominance of plant-based proteins is forecasted to continue, though their relative share will narrow as novel sources gain adoption.
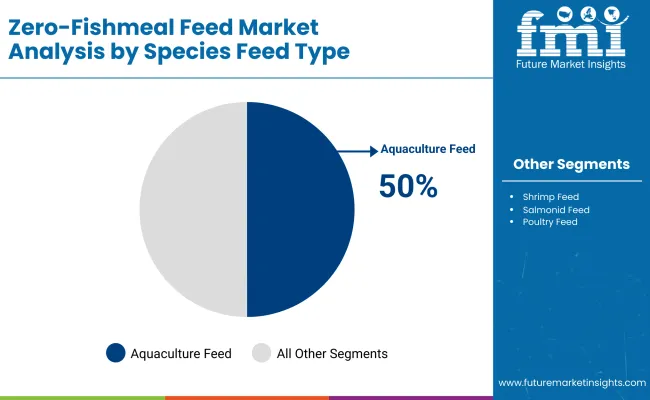
Insights into the Livestock/Aquaculture Species Segment with Aquaculture Feed Dominating the Demand

Zero Fishmeal Feed Market By Species

Species Feed Type Share (%)
Aquaculture Feed 50%
Shrimp Feed 20%
Salmonid Feed 10%
Poultry Feed 10%
Swine Feed 5%
Ruminant Feed 3%
Carp / Tilapia / Others 2%

The aquaculture feed segment is forecasted to hold 50% of the market share in 2025, driven by widespread adoption in shrimp, tilapia, and salmonid farming. Certifications promoting sustainable seafood have accelerated the integration of plant, insect, and microbial proteins into aquafeeds. Poultry feed is emerging as the second-largest user segment, where amino acid balancing and enzyme fortification allow plant-based formulations to substitute marine proteins effectively.

Swine feed adoption is growing steadily, driven by cost optimization and the need to maintain growth performance under sustainability mandates. Ruminant feed represents a smaller but steadily expanding share, particularly in regions promoting methane reduction strategies. Aquaculture is expected to remain the anchor species segment, but poultry and swine are projected to record higher growth rates, diversifying the demand base over the next decade.
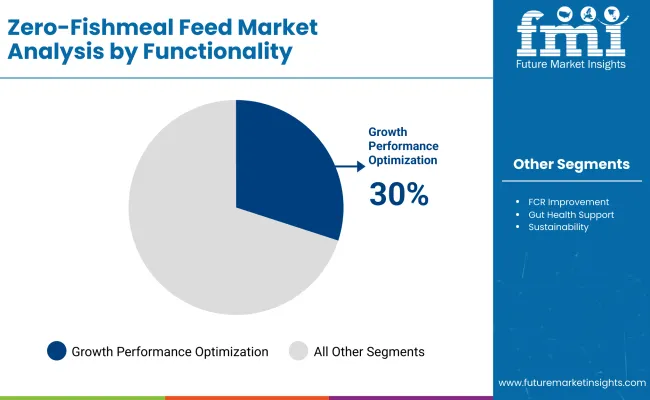
Insights into the Functionality Segment with Growth Performance Optimization Leading in Market Share

Zero Fishmeal Feed Market By Functionality

Functionality Share (%)
Growth Performance Optimization 30%
FCR Improvement 25%
Gut Health Support 20%
Sustainability / Environmental Impact 25%

The growth performance optimization segment is forecasted to hold 30% of the market share in 2025, anchored by poultry and aquaculture feed where balanced amino acid profiles and protein digestibility directly influence weight gain and output efficiency. Integrators are prioritizing plant-based and blended protein systems that ensure consistent performance across varied climatic and production conditions. Feed conversion ratio (FCR) improvement is estimated to follow closely, supported by enzyme fortification and microbial blends that reduce waste while enhancing nutrient absorption.

Gut health support is expected to rise as probiotics and prebiotics are increasingly included in insect- and microbial-based formulations. Sustainability and environmental impact reduction are becoming essential in aquaculture, where certification mandates require low-carbon, fishmeal-free solutions. Growth performance optimization will remain dominant, though its share is expected to gradually narrow as FCR efficiency gains and sustainability drivers accelerate adoption of novel proteins.

Drivers, Restraints, and Key Trends of the Zero-Fishmeal Feed Market?

Precision Nutrition through Alternative Proteins

A major growth driver is the transition toward precision nutrition, where zero-fishmeal formulations are engineered to deliver targeted amino acid and micronutrient profiles for different livestock and aquaculture species. Unlike traditional fishmeal, which has inherent variability in nutrient density and digestibility, plant-, insect-, and microbial-based proteins allow for standardized nutrient matrices.

Feed formulators are leveraging advanced enzyme fortification and probiotic integration to improve digestibility, reduce nitrogen waste, and enhance feed conversion ratios (FCR). This capability not only ensures consistent animal performance but also aligns with sustainability mandates from regulators and certification bodies. Precision-based formulation is expected to strengthen market adoption as producers seek predictable outcomes in high-value aquaculture and poultry systems.

Integration of Circular-Economy Sourcing Models

A significant trend reshaping the zero-fishmeal feed market is the integration of circular-economy models, where protein ingredients are sourced from waste streams such as agricultural residues, brewery by-products, and food waste bioconversion. Insect-based proteins like black soldier fly larvae and microbial proteins from fermentation side-streams are gaining traction for their dual benefits of nutrient density and waste valorization.

This shift not only reduces dependence on conventional raw materials but also contributes to carbon footprint reduction, supporting the environmental goals of both governments and multinational feed producers. As sustainability-linked financing grows, adoption of circular-economy inputs is projected to move from niche to mainstream, creating recurring value streams.
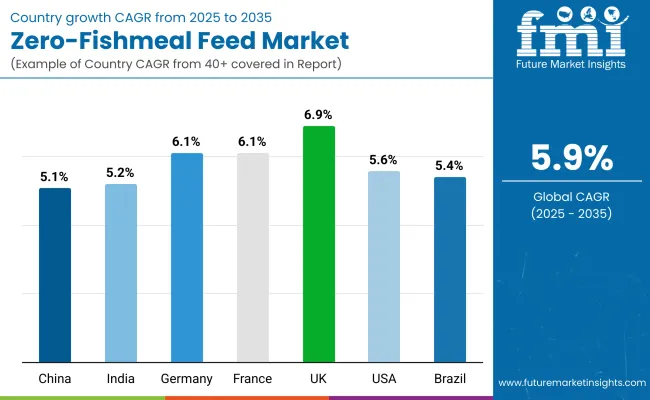
Analysis of Zero-Fishmeal Feed Market by Key Countries

Zero Fishmeal Feed Market By Country

Countries CAGR
China 5.16%
India 5.20%
Germany 6.19%
France 6.13%
UK 6.97%
USA 5.61%
Brazil 5.41%

The Zero-Fishmeal Feed Market demonstrates varied regional growth patterns, shaped by aquaculture reliance, livestock modernization, and regulatory momentum.

Asia-Pacific emerges as a key growth hub, anchored by China at 5.16% CAGR and India at 5.20% CAGR. In China, policy-backed sustainability programs and intensified aquaculture production, especially shrimp and tilapia, are accelerating adoption of plant- and microbial-based proteins. India reflects rising demand from poultry and aquaculture sectors, where hybrid blends of plant, insect, and fermentation-derived proteins are gaining traction to support both cost competitiveness and export-led growth.

Europe maintains robust momentum, with Germany at 6.19% CAGR, France at 6.13% CAGR, and the UK leading at 6.97% CAGR. Strong regulatory frameworks on sustainability, protein diversification mandates, and significant investment in insect protein facilities underpin growth in these markets. Europe is increasingly seen as a leader in high-value, certified aquafeeds, shifting value creation toward functional blends and fortified formulations. North America shows moderate yet steady expansion, with the USA at 5.61% CAGR.

Growth is being shaped by poultry and swine feed industries, where traceability, certification, and fortified formulations are emerging as differentiators. Latin America is also progressing, led by Brazil at 5.41% CAGR, where aquaculture feed demand, particularly for tilapia and shrimp, is driving zero-fishmeal adoption. The region is expected to strengthen its role as a cost-competitive supplier of alternative protein feeds across global export chains.
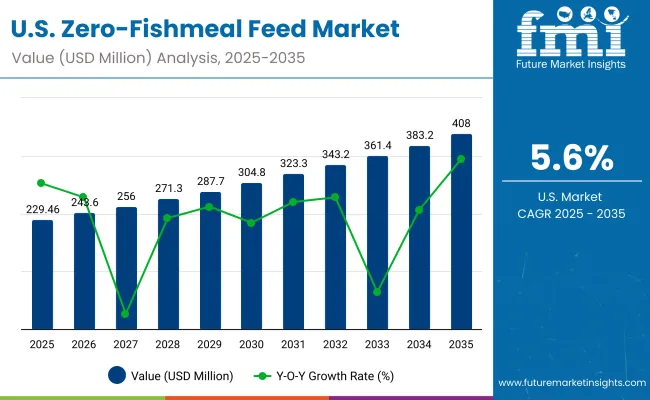
Sales Outlook for Zero-Fishmeal Feed in the United States

Zero Fishmeal Feed Market Usa

Year USA Zero-Fishmeal Feed Market (USD Million)
2025 229.46
2026 243.6
2027 256.0
2028 271.3
2029 287.7
2030 304.8
2031 323.3
2032 343.2
2033 361.4
2034 383.2
2035 408.0

The Zero-Fishmeal Feed Market in the United States is projected to grow at a CAGR of 6.0% (2025-2035), supported by strong momentum in poultry and aquaculture feed. Poultry producers are increasingly adopting soy- and pea-based protein blends, while the aquaculture sector is exploring insect meals and fermentation-derived proteins to reduce dependence on marine ingredients.

Value-added feed fortified with probiotics, enzymes, and vitamins is gaining relevance as producers target better gut health and feed conversion. Growing consumer demand for sustainably sourced animal protein is also encouraging integrators to prioritize zero-fishmeal formulations with verified traceability.

  • Poultry feed integrators are accelerating adoption of soy and pea protein concentrates.
  • Aquaculture producers are trialing insect- and single-cell protein blends in shrimp and salmon diets.
  • Enzyme- and probiotic-fortified feed is being positioned as a performance-enhancing, premium offering.

Growth and Expansion Outlook for Zero-Fishmeal Feed Market in the United Kingdom

The Zero-Fishmeal Feed Market in the United Kingdom is projected to expand at a CAGR of 6.97% (2025-2035), supported by sustainability mandates, aquaculture innovation, and rising demand for traceable protein sources. The aquaculture sector, particularly salmon and trout farming, is accelerating the adoption of insect-based proteins and algae-derived ingredients to meet net-zero commitments.

Poultry producers are increasingly incorporating blended plant proteins such as soy, pea, and wheat gluten to reduce reliance on imported fishmeal. Retail and foodservice channels are encouraging sustainability certifications, pushing integrators to innovate in feed formulations. Academic research collaborations and government-backed funding for circular economy projects are reinforcing the transition toward low-carbon, zero-fishmeal protein ecosystems.

  • Salmon and trout producers are piloting insect- and algae-based feed formulations.
  • Poultry producers are adopting soy-pea-wheat gluten blends as fishmeal alternatives.
  • Retail and foodservice firms are incentivizing traceable, certified sustainable feed solutions.

Growth and Expansion Outlook for Zero-Fishmeal Feed Market in India

The Zero-Fishmeal Feed Market in India is forecast to grow at a CAGR of 5.20% between 2025 and 2035, supported by rising aquaculture output and government-backed initiatives to reduce marine resource dependency. Shrimp farming, India’s largest aquaculture export sector, is increasingly incorporating soy protein concentrate, corn gluten meal, and pea protein in feed formulations.

Feed manufacturers are piloting microbial and insect-based protein inclusion to enhance digestibility and improve feed conversion ratios (FCR). Poultry and carp feed segments are adopting blended formulations fortified with probiotics, reflecting both cost efficiency and nutritional improvement. Public-private research collaborations and state-led blue economy programs are reinforcing demand for scalable, traceable zero-fishmeal protein sources.

  • Shrimp aquaculture is accelerating adoption of soy, corn gluten, and pea protein feeds.
  • Poultry and carp segments are integrating fortified blended protein formulations.
  • Government blue economy initiatives are promoting sustainable, traceable feed adoption.

Sales Outlook for Zero-Fishmeal Feed in China

The Zero-Fishmeal Feed Market in China is expected to grow at a CAGR of 5.16% from 2025 to 2035, supported by large-scale aquaculture production and rising demand for sustainable seafood exports. Shrimp, tilapia, and carp farming are driving strong adoption of plant-based proteins such as soy protein concentrate and wheat gluten, which are being fortified with enzymes for improved digestibility.

Insect-based proteins, particularly black soldier fly larvae meal, are gaining momentum with government-backed pilot projects and private investment. Algae- and microbial-derived proteins are also being introduced, aligning with national sustainability and carbon-reduction targets. Domestic feed producers are leveraging hybrid formulations to maintain nutritional performance while reducing marine dependency.

  • Shrimp, tilapia, and carp farms are leading demand for soy- and wheat-based protein feeds.
  • Insect protein adoption is supported by government pilots and private-sector funding.
  • Algae and microbial proteins are aligning with China’s carbon-reduction and sustainability goals.

In-depth Analysis of Zero-Fishmeal Feed in Germany

Countries / Sub-regions 2025
UK 19.02%
Germany 20.08%
Italy 11.06%
France 13.60%
Spain 11.79%
BENELUX 6.87%
Nordic 5.25%
Rest of Europe 12%
Countries / Sub-regions 2035
UK 20.06%
Germany 20.77%
Italy 10.00%
France 13.69%
Spain 10.30%
BENELUX 5.50%
Nordic 5.74%
Rest of Europe 14%

The Zero-Fishmeal Feed Market in Germany is projected to grow at a CAGR of 6.19% between 2025 and 2035, supported by the country’s leadership in sustainable livestock production and aquaculture innovation. Poultry and swine feed producers are increasingly adopting soy protein concentrate, pea protein, and lupin meal as scalable alternatives to marine proteins. Significant investment in insect farming, particularly black soldier fly larvae, is accelerating integration into feed formulations. Algae-based ingredients are also being trialed for omega-3 enrichment, addressing consumer demand for healthier, sustainable protein sources. Compliance with stringent EU sustainability directives and growing demand for certified, low-carbon food systems are reinforcing Germany’s position as a frontrunner in zero-fishmeal adoption.
  • Poultry and swine feed producers are scaling adoption of soy, pea, and lupin proteins.
  • Insect farming investments are enabling rapid expansion of black soldier fly meal.
  • Algae-based proteins are introduced for omega-3 enrichment in sustainable feed systems.

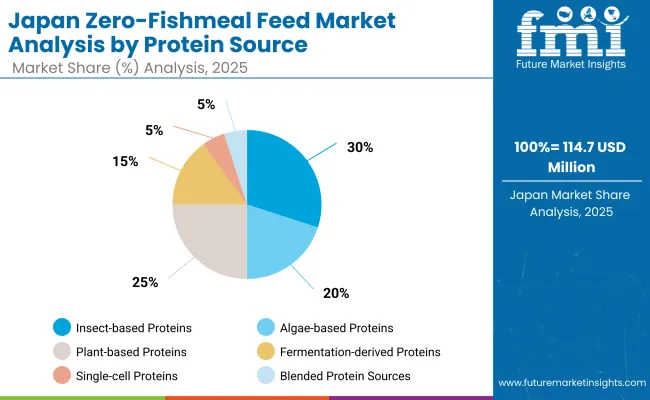
Growth Outlook for Zero-Fishmeal Feed Market in Japan

Zero Fishmeal Feed Market Japan

Protein Source Share (%)
Insect-based Proteins 30%
Algae-based Proteins 20%
Plant-based Proteins 25%
Fermentation-derived Proteins 15%
Single-cell Proteins 5%
Blended Protein Sources 5%

The Zero-Fishmeal Feed Market in Japan is projected at USD 114.7 million in 2025, expanding at a CAGR of 8.58% through 2035. Insect-based proteins contribute the highest share at 30%, while plant-based proteins follow at 25%, reflecting the balance between novel and traditional protein alternatives. This dominance of insect-based ingredients stems from their superior feed conversion ratios, amino acid profiles, and alignment with Japan’s aquaculture innovation. Plant-based proteins remain critical due to cost efficiency and wide availability, though growth is more modest compared to newer categories. Algae-based proteins (20%) and fermentation-derived proteins (15%) are increasingly favored for functional performance and sustainability credentials. As Japanese feed manufacturers emphasize environmental compliance and resource circularity, hybrid formulations blending insects, algae, and microbial proteins are projected to define the competitive landscape.
  • Market in Japan holds a CAGR of 8.58% (2025-2035)
  • Insect-based proteins lead with 30% share in 2025
  • Growth supported by aquaculture expansion and circular-economy sourcing

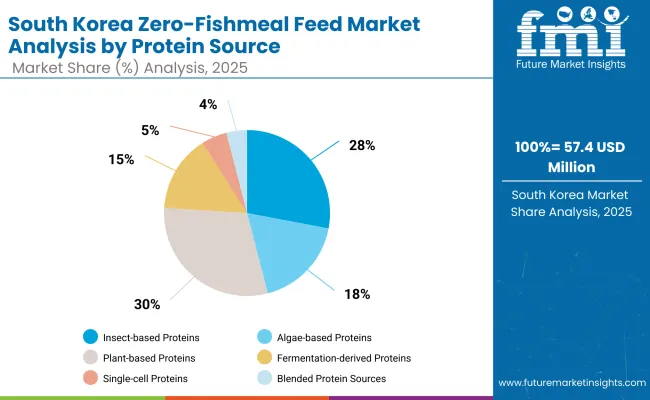
Opportunity Analysis of Zero-Fishmeal Feed South Korea Market

Zero Fishmeal Feed Market South Korea

Protein Source Share (%)
Insect-based Proteins 28%
Algae-based Proteins 18%
Plant-based Proteins 30%
Fermentation-derived Proteins 15%
Single-cell Proteins 5%
Blended Protein Sources 4%

The Zero-Fishmeal Feed Market in South Korea is valued at USD 57.4 million in 2025, reflecting the nation’s strong aquaculture and poultry feed sectors. Plant-based proteins lead with a 30% share, while insect-based proteins account for 28%, driven by growing acceptance of black soldier fly meal. Fermentation-derived and algae-based proteins are gaining traction, supported by the country’s biotechnology and marine resources. South Korea’s feed industry is expected to pivot toward hybrid formulations, integrating microbial and functional protein sources to meet sustainability goals and enhance feed conversion efficiency.
  • Weighted CAGR (2025-2035): ~8.40%
  • Leading 2025 share: Plant-based proteins 30% (insect-based 28%)
  • Performance enablers: Fermentation-derived + algae proteins drive FCR improvement and omega-3 enrichment

Competitive Landscape of Zero-Fishmeal Feed Market

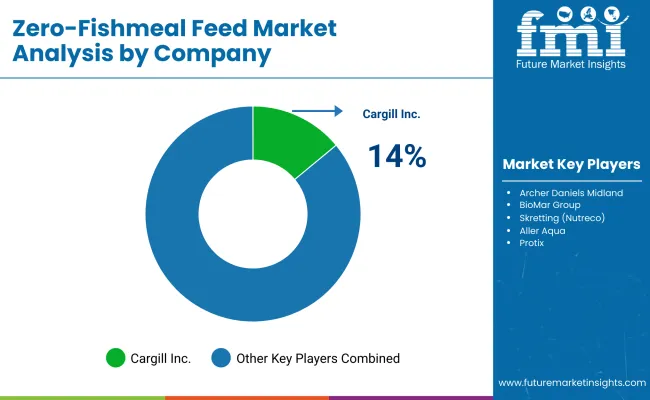
Zero Fishmeal Feed Market By Company

The Zero-Fishmeal Feed Market is moderately fragmented, with global leaders, mid-sized innovators, and specialized startups competing across protein source categories. Global feed giants such as Cargill, ADM, and Skretting command significant market share, leveraging scale, established supply chains, and investment in alternative protein R&D. Their strategies increasingly emphasize hybrid formulations combining plant-based proteins with novel inputs such as algae, insect meal, and single-cell proteins, alongside traceability and certification programs to meet sustainability standards.

Established mid-sized players, including BioMar, Aller Aqua, and Corbion, focus on targeted aquaculture and specialty livestock markets, accelerating adoption of insect-based and fermentation-derived proteins. These firms are aligning closely with regulatory frameworks and offering sustainability-driven differentiation.

Specialized providers such as Ÿnsect, Protix, and Calysta are pioneering insect bioconversion and single-cell protein production, often operating with strong regional adaptability and technology-intensive platforms. Their strength lies in innovation, vertical integration, and partnerships with aquafeed manufacturers.

Competitive differentiation is shifting away from commodity proteins toward ecosystem strength, sustainability compliance, and recurring value creation through fortified, functional formulations tailored to feed conversion efficiency and environmental goals.

Key Developments in Zero-Fishmeal Feed Market

  • On February 11, 2025, Cargill and Innovafeed announced the commercial rollout of insect-based protein in aquafeeds across Europe and Asia. The partnership enables large-scale substitution of fishmeal with black soldier fly larvae meal, strengthening sustainable feed adoption in shrimp and salmon farming.
  • On May 22, 2025, BioMar Group launched its first zero-fishmeal shrimp feed in India, incorporating a blend of plant proteins, microbial-derived inputs, and functional additives. The product targets both domestic aquaculture producers and export markets, positioning BioMar as a key innovator in sustainable shrimp nutrition.

Scope of the Report

Item Value
Quantitative Units USD 0.9561 billion
Protein Source Plant-based Proteins (Soy, Pea, Corn Gluten, Wheat Gluten, Canola, Lupin), Insect-based Proteins (Black Soldier Fly, Mealworm), Algae-based Proteins (Microalgae, Macroalgae), Fermentation-derived Proteins, Single-cell Proteins (Bacterial, Yeast, Fungal), Blended Protein Sources
Livestock / Aquaculture Species Poultry Feed, Swine Feed, Ruminant Feed, Aquaculture Feed (Shrimp, Tilapia, Salmonid, Carp, Catfish)
Functionality Growth Performance Optimization, Feed Conversion Ratio (FCR) Improvement, Gut Health Support, Sustainability & Environmental Impact Reduction
Form Mash, Pellets, Crumbles, Extruded Feed
Additive Integration Enzyme-fortified, Probiotic/Prebiotic-fortified, Omega-3 Enriched, Vitamin & Mineral Fortified
Regions Covered North America, Europe, Asia-Pacific, Latin America, Middle East & Africa
Country Covered United States, Canada, Germany, France, United Kingdom, China, Japan, India, Brazil, South Korea
Key Companies Profiled Cargill Inc., Archer Daniels Midland (ADM), BioMar Group, Skretting (Nutreco ), Aller Aqua, Ÿnsect, Protix, Innovafeed, Calysta, Corbion, Novozymes, Benson Hill, Enterra Feed, and Others
Additional Attributes Dollar sales by protein source and livestock species, adoption trends in aquaculture vs. poultry feed, scaling of insect bioconversion and fermentation-derived proteins, certification and traceability impacts, sustainability-driven procurement policies, regional dynamics in Asia-Pacific and Europe, innovations in algae cultivation, fermentation platforms, and blended protein formulations

Key Segments

By Protein Source:

  • Plant-based Proteins
    • Soy Protein Concentrate / Isolate
    • Pea Protein
    • Corn Gluten Meal
    • Wheat Gluten
    • Canola Meal
    • Lupin Meal
  • Algae-based Proteins
    • Microalgae
    • Macroalgae
  • Insect-based Proteins
    • Black Soldier Fly Larvae Meal
    • Mealworm Meal
  • Single-cell Proteins
    • Bacterial Protein Meal
    • Yeast Protein
    • Fungal Protein (Mycoprotein)
  • Other Novel Proteins
    • Fermentation-derived Proteins
    • Blended Protein Sources

By Livestock / Aquaculture Species:

  • Poultry Feed
  • Swine Feed
  • Ruminant Feed
  • Aquaculture Feed
    • Shrimp Feed
    • Tilapia Feed
    • Salmonid Feed
    • Carp Feed
    • Catfish Feed

By Functionality:

  • Growth Performance Optimization
  • Feed Conversion Ratio (FCR) Improvement
  • Gut Health Support
  • Sustainability & Environmental Impact Reduction

By Form:

  • Mash
  • Pellets
  • Crumbles
  • Extruded Feed

By Additive Integration:

  • Enzyme-fortified
  • Probiotic/Prebiotic-fortified
  • Omega-3 Enriched
  • Vitamin & Mineral Fortified

By Sales Channel:

  • Direct to Farmers / Integrators
  • Through Feed Manufacturers
  • Distributors & Agents

By Region:

  • North America
  • Latin America
  • Europe
  • East Asia
  • South Asia & Pacific
  • Middle East and Africa

Table of Content

  1. Executive Summary
    • Global Market Outlook
    • Demand-side Trends
    • Supply-side Trends
    • Technology Roadmap Analysis
    • Analysis and Recommendations
  2. Market Overview
    • Market Coverage / Taxonomy
    • Market Definition / Scope / Limitations
  3. Market Background
    • Market Dynamics
      • Drivers
      • Restraints
      • Opportunity
      • Trends
    • Scenario Forecast
      • Demand in Optimistic Scenario
      • Demand in Likely Scenario
      • Demand in Conservative Scenario
    • Opportunity Map Analysis
    • Product Life Cycle Analysis
    • Supply Chain Analysis
    • Investment Feasibility Matrix
    • Value Chain Analysis
    • PESTLE and Porter’s Analysis
    • Regulatory Landscape
    • Regional Parent Market Outlook
    • Production and Consumption Statistics
    • Import and Export Statistics
  4. Global Market Analysis 2020 to 2024 and Forecast, 2025 to 2035
    • Historical Market Size Value (USD Million) Analysis, 2020 to 2024
    • Current and Future Market Size Value (USD Million) Projections, 2025 to 2035
      • Y-o-Y Growth Trend Analysis
      • Absolute $ Opportunity Analysis
  5. Global Market Pricing Analysis 2020 to 2024 and Forecast 2025 to 2035
  6. Global Market Analysis 2020 to 2024 and Forecast 2025 to 2035, By Protein Source
    • Introduction / Key Findings
    • Historical Market Size Value (USD Million) Analysis By Protein Source, 2020 to 2024
    • Current and Future Market Size Value (USD Million) Analysis and Forecast By Protein Source, 2025 to 2035
      • Plant-based Proteins
        • Soy Protein Concentrate / Isolate
        • Pea Protein
        • Corn Gluten Meal
        • Wheat Gluten
        • Canola Meal
        • Lupin Meal
      • Algae-based Proteins
        • Microalgae
        • Macroalgae
      • Insect-based Proteins
        • Black Soldier Fly Larvae Meal
        • Mealworm Meal
      • Single-cell Proteins
        • Bacterial Protein Meal
        • Yeast Protein
        • Fungal Protein (Mycoprotein)
      • Other Novel Proteins
        • Fermentation-derived Proteins
        • Blended Protein Sources
    • Y-o-Y Growth Trend Analysis By Protein Source, 2020 to 2024
    • Absolute $ Opportunity Analysis By Protein Source, 2025 to 2035
  7. Global Market Analysis 2020 to 2024 and Forecast 2025 to 2035, By Livestock / Aquaculture Species
    • Introduction / Key Findings
    • Historical Market Size Value (USD Million) Analysis By Livestock / Aquaculture Species, 2020 to 2024
    • Current and Future Market Size Value (USD Million) Analysis and Forecast By Livestock / Aquaculture Species, 2025 to 2035
      • Poultry Feed
      • Swine Feed
      • Ruminant Feed
      • Aquaculture Feed
        • Shrimp Feed
        • Tilapia Feed
        • Salmonid Feed
        • Carp Feed
        • Catfish Feed
    • Y-o-Y Growth Trend Analysis By Livestock / Aquaculture Species, 2020 to 2024
    • Absolute $ Opportunity Analysis By Livestock / Aquaculture Species, 2025 to 2035
  8. Global Market Analysis 2020 to 2024 and Forecast 2025 to 2035, By Functionality
    • Introduction / Key Findings
    • Historical Market Size Value (USD Million) Analysis By Functionality, 2020 to 2024
    • Current and Future Market Size Value (USD Million) Analysis and Forecast By Functionality, 2025 to 2035
      • Growth Performance Optimization
      • Feed Conversion Ratio (FCR) Improvement
      • Gut Health Support
      • Sustainability & Environmental Impact Reduction
    • Y-o-Y Growth Trend Analysis By Functionality, 2020 to 2024
    • Absolute $ Opportunity Analysis By Functionality, 2025 to 2035
  9. Global Market Analysis 2020 to 2024 and Forecast 2025 to 2035, By Form
    • Introduction / Key Findings
    • Historical Market Size Value (USD Million) Analysis By Form, 2020 to 2024
    • Current and Future Market Size Value (USD Million) Analysis and Forecast By Form, 2025 to 2035
      • Mash
      • Pellets
      • Crumbles
      • Extruded Feed
    • Y-o-Y Growth Trend Analysis By Form, 2020 to 2024
    • Absolute $ Opportunity Analysis By Form, 2025 to 2035
  10. Global Market Analysis 2020 to 2024 and Forecast 2025 to 2035, By Additive Integration
    • Introduction / Key Findings
    • Historical Market Size Value (USD Million) Analysis By Additive Integration, 2020 to 2024
    • Current and Future Market Size Value (USD Million) Analysis and Forecast By Additive Integration, 2025 to 2035
      • Enzyme-fortified
      • Probiotic/Prebiotic-fortified
      • Omega-3 Enriched
      • Vitamin & Mineral Fortified
    • Y-o-Y Growth Trend Analysis By Additive Integration, 2020 to 2024
    • Absolute $ Opportunity Analysis By Additive Integration, 2025 to 2035
  11. Global Market Analysis 2020 to 2024 and Forecast 2025 to 2035, By Sales Channel
    • Introduction / Key Findings
    • Historical Market Size Value (USD Million) Analysis By Sales Channel, 2020 to 2024
    • Current and Future Market Size Value (USD Million) Analysis and Forecast By Sales Channel, 2025 to 2035
      • Direct to Farmers / Integrators
      • Through Feed Manufacturers
      • Distributors & Agents
    • Y-o-Y Growth Trend Analysis By Sales Channel, 2020 to 2024
    • Absolute $ Opportunity Analysis By Sales Channel, 2025 to 2035
  12. Global Market Analysis 2020 to 2024 and Forecast 2025 to 2035, By Region
    • Introduction
    • Historical Market Size Value (USD Million) Analysis By Region, 2020 to 2024
    • Current Market Size Value (USD Million) Analysis and Forecast By Region, 2025 to 2035
      • North America
      • Latin America
      • Europe
      • East Asia
      • South Asia & Pacific
      • Middle East and Africa
    • Market Attractiveness Analysis By Region
  13. North America Market Analysis 2020 to 2024 and Forecast 2025 to 2035, By Country
    • Historical Market Size Value (USD Million) Trend Analysis By Market Taxonomy, 2020 to 2024
    • Market Size Value (USD Million) Forecast By Market Taxonomy, 2025 to 2035
      • By Country
        • USA
        • Canada
      • By Protein Source
      • By Livestock / Aquaculture Species
      • By Functionality
      • By Form
      • By Additive Integration
      • By Sales Channel
    • Market Attractiveness Analysis
      • By Country
      • By Protein Source
      • By Livestock / Aquaculture Species
      • By Functionality
      • By Form
      • By Additive Integration
      • By Sales Channel
    • Key Takeaways
  14. Latin America Market Analysis 2020 to 2024 and Forecast 2025 to 2035, By Country
    • Historical Market Size Value (USD Million) Trend Analysis By Market Taxonomy, 2020 to 2024
    • Market Size Value (USD Million) Forecast By Market Taxonomy, 2025 to 2035
      • By Country
        • Brazil
        • Mexico
        • Colombia
        • Rest of Latin America
      • By Protein Source
      • By Livestock / Aquaculture Species
      • By Functionality
      • By Form
      • By Additive Integration
      • By Sales Channel
    • Market Attractiveness Analysis
      • By Country
      • By Protein Source
      • By Livestock / Aquaculture Species
      • By Functionality
      • By Form
      • By Additive Integration
      • By Sales Channel
    • Key Takeaways
  15. Europe Market Analysis 2020 to 2024 and Forecast 2025 to 2035, By Country
    • Historical Market Size Value (USD Million) Trend Analysis By Market Taxonomy, 2020 to 2024
    • Market Size Value (USD Million) Forecast By Market Taxonomy, 2025 to 2035
      • By Country
        • Germany
        • UK
        • France
        • Italy
        • Spain
        • Belgium
        • Netherlands
        • Nordic
        • Switzerland
        • Russia
        • Poland
        • Rest of Europe
      • By Protein Source
      • By Livestock / Aquaculture Species
      • By Functionality
      • By Form
      • By Additive Integration
      • By Sales Channel
    • Market Attractiveness Analysis
      • By Country
      • By Protein Source
      • By Livestock / Aquaculture Species
      • By Functionality
      • By Form
      • By Additive Integration
      • By Sales Channel
    • Key Takeaways
  16. East Asia Market Analysis 2020 to 2024 and Forecast 2025 to 2035, By Country
    • Historical Market Size Value (USD Million) Trend Analysis By Market Taxonomy, 2020 to 2024
    • Market Size Value (USD Million) Forecast By Market Taxonomy, 2025 to 2035
      • By Country
        • China
        • Japan
        • South Korea
      • By Protein Source
      • By Livestock / Aquaculture Species
      • By Functionality
      • By Form
      • By Additive Integration
      • By Sales Channel
    • Market Attractiveness Analysis
      • By Country
      • By Protein Source
      • By Livestock / Aquaculture Species
      • By Functionality
      • By Form
      • By Additive Integration
      • By Sales Channel
    • Key Takeaways
  17. South Asia & Pacific Market Analysis 2020 to 2024 and Forecast 2025 to 2035, By Country
    • Historical Market Size Value (USD Million) Trend Analysis By Market Taxonomy, 2020 to 2024
    • Market Size Value (USD Million) Forecast By Market Taxonomy, 2025 to 2035
      • By Country
        • India
        • Thailand
        • Malaysia
        • Indonesia
        • Singapore
        • Vietnam
        • Australia
        • New Zealand
        • Rest of South Asia
      • By Protein Source
      • By Livestock / Aquaculture Species
      • By Functionality
      • By Form
      • By Additive Integration
      • By Sales Channel
    • Market Attractiveness Analysis
      • By Country
      • By Protein Source
      • By Livestock / Aquaculture Species
      • By Functionality
      • By Form
      • By Additive Integration
      • By Sales Channel
    • Key Takeaways
  18. Middle East and Africa Market Analysis 2020 to 2024 and Forecast 2025 to 2035, By Country
    • Historical Market Size Value (USD Million) Trend Analysis By Market Taxonomy, 2020 to 2024
    • Market Size Value (USD Million) Forecast By Market Taxonomy, 2025 to 2035
      • By Country
        • Turkey
        • UAE
        • Saudi Arabia
        • Israel
        • Other GCC Countries
        • North Africa
        • South Africa
      • By Protein Source
      • By Livestock / Aquaculture Species
      • By Functionality
      • By Form
      • By Additive Integration
      • By Sales Channel
    • Market Attractiveness Analysis
      • By Country
      • By Protein Source
      • By Livestock / Aquaculture Species
      • By Functionality
      • By Form
      • By Additive Integration
      • By Sales Channel
    • Key Takeaways
  19. Key Countries Market Analysis
    • USA
      • Pricing Analysis
      • Market Share Analysis, 2024
        • By Protein Source
        • By Livestock / Aquaculture Species
        • By Functionality
        • By Form
        • By Additive Integration
        • By Sales Channel
    • Canada
      • Pricing Analysis
      • Market Share Analysis, 2024
        • By Protein Source
        • By Livestock / Aquaculture Species
        • By Functionality
        • By Form
        • By Additive Integration
        • By Sales Channel
    • Brazil
      • Pricing Analysis
      • Market Share Analysis, 2024
        • By Protein Source
        • By Livestock / Aquaculture Species
        • By Functionality
        • By Form
        • By Additive Integration
        • By Sales Channel
    • Mexico
      • Pricing Analysis
      • Market Share Analysis, 2024
        • By Protein Source
        • By Livestock / Aquaculture Species
        • By Functionality
        • By Form
        • By Additive Integration
        • By Sales Channel
    • Colombia
      • Pricing Analysis
      • Market Share Analysis, 2024
        • By Protein Source
        • By Livestock / Aquaculture Species
        • By Functionality
        • By Form
        • By Additive Integration
        • By Sales Channel
    • Rest of Latin America
      • Pricing Analysis
      • Market Share Analysis, 2024
        • By Protein Source
        • By Livestock / Aquaculture Species
        • By Functionality
        • By Form
        • By Additive Integration
        • By Sales Channel
    • Germany
      • Pricing Analysis
      • Market Share Analysis, 2024
        • By Protein Source
        • By Livestock / Aquaculture Species
        • By Functionality
        • By Form
        • By Additive Integration
        • By Sales Channel
    • UK
      • Pricing Analysis
      • Market Share Analysis, 2024
        • By Protein Source
        • By Livestock / Aquaculture Species
        • By Functionality
        • By Form
        • By Additive Integration
        • By Sales Channel
    • France
      • Pricing Analysis
      • Market Share Analysis, 2024
        • By Protein Source
        • By Livestock / Aquaculture Species
        • By Functionality
        • By Form
        • By Additive Integration
        • By Sales Channel
    • Italy
      • Pricing Analysis
      • Market Share Analysis, 2024
        • By Protein Source
        • By Livestock / Aquaculture Species
        • By Functionality
        • By Form
        • By Additive Integration
        • By Sales Channel
    • Spain
      • Pricing Analysis
      • Market Share Analysis, 2024
        • By Protein Source
        • By Livestock / Aquaculture Species
        • By Functionality
        • By Form
        • By Additive Integration
        • By Sales Channel
    • Belgium
      • Pricing Analysis
      • Market Share Analysis, 2024
        • By Protein Source
        • By Livestock / Aquaculture Species
        • By Functionality
        • By Form
        • By Additive Integration
        • By Sales Channel
    • Netherlands
      • Pricing Analysis
      • Market Share Analysis, 2024
        • By Protein Source
        • By Livestock / Aquaculture Species
        • By Functionality
        • By Form
        • By Additive Integration
        • By Sales Channel
    • Nordic
      • Pricing Analysis
      • Market Share Analysis, 2024
        • By Protein Source
        • By Livestock / Aquaculture Species
        • By Functionality
        • By Form
        • By Additive Integration
        • By Sales Channel
    • Switzerland
      • Pricing Analysis
      • Market Share Analysis, 2024
        • By Protein Source
        • By Livestock / Aquaculture Species
        • By Functionality
        • By Form
        • By Additive Integration
        • By Sales Channel
    • Russia
      • Pricing Analysis
      • Market Share Analysis, 2024
        • By Protein Source
        • By Livestock / Aquaculture Species
        • By Functionality
        • By Form
        • By Additive Integration
        • By Sales Channel
    • Poland
      • Pricing Analysis
      • Market Share Analysis, 2024
        • By Protein Source
        • By Livestock / Aquaculture Species
        • By Functionality
        • By Form
        • By Additive Integration
        • By Sales Channel
    • Rest of Europe
      • Pricing Analysis
      • Market Share Analysis, 2024
        • By Protein Source
        • By Livestock / Aquaculture Species
        • By Functionality
        • By Form
        • By Additive Integration
        • By Sales Channel
    • China
      • Pricing Analysis
      • Market Share Analysis, 2024
        • By Protein Source
        • By Livestock / Aquaculture Species
        • By Functionality
        • By Form
        • By Additive Integration
        • By Sales Channel
    • Japan
      • Pricing Analysis
      • Market Share Analysis, 2024
        • By Protein Source
        • By Livestock / Aquaculture Species
        • By Functionality
        • By Form
        • By Additive Integration
        • By Sales Channel
    • South Korea
      • Pricing Analysis
      • Market Share Analysis, 2024
        • By Protein Source
        • By Livestock / Aquaculture Species
        • By Functionality
        • By Form
        • By Additive Integration
        • By Sales Channel
    • India
      • Pricing Analysis
      • Market Share Analysis, 2024
        • By Protein Source
        • By Livestock / Aquaculture Species
        • By Functionality
        • By Form
        • By Additive Integration
        • By Sales Channel
    • Thailand
      • Pricing Analysis
      • Market Share Analysis, 2024
        • By Protein Source
        • By Livestock / Aquaculture Species
        • By Functionality
        • By Form
        • By Additive Integration
        • By Sales Channel
    • Malaysia
      • Pricing Analysis
      • Market Share Analysis, 2024
        • By Protein Source
        • By Livestock / Aquaculture Species
        • By Functionality
        • By Form
        • By Additive Integration
        • By Sales Channel
    • Indonesia
      • Pricing Analysis
      • Market Share Analysis, 2024
        • By Protein Source
        • By Livestock / Aquaculture Species
        • By Functionality
        • By Form
        • By Additive Integration
        • By Sales Channel
    • Singapore
      • Pricing Analysis
      • Market Share Analysis, 2024
        • By Protein Source
        • By Livestock / Aquaculture Species
        • By Functionality
        • By Form
        • By Additive Integration
        • By Sales Channel
    • Vietnam
      • Pricing Analysis
      • Market Share Analysis, 2024
        • By Protein Source
        • By Livestock / Aquaculture Species
        • By Functionality
        • By Form
        • By Additive Integration
        • By Sales Channel
    • Australia
      • Pricing Analysis
      • Market Share Analysis, 2024
        • By Protein Source
        • By Livestock / Aquaculture Species
        • By Functionality
        • By Form
        • By Additive Integration
        • By Sales Channel
    • New Zealand
      • Pricing Analysis
      • Market Share Analysis, 2024
        • By Protein Source
        • By Livestock / Aquaculture Species
        • By Functionality
        • By Form
        • By Additive Integration
        • By Sales Channel
    • Rest of South Asia
      • Pricing Analysis
      • Market Share Analysis, 2024
        • By Protein Source
        • By Livestock / Aquaculture Species
        • By Functionality
        • By Form
        • By Additive Integration
        • By Sales Channel
  20. Market Structure Analysis
    • Competition Dashboard
    • Competition Benchmarking
    • Market Share Analysis of Top Players
      • By Regional
      • By Protein Source
      • By Livestock / Aquaculture Species
      • By Functionality
      • By Form
      • By Additive Integration
      • By Sales Channel
  21. Competition Analysis
    • Competition Deep Dive
      • Cargill
        • Overview
        • Product Portfolio
        • Profitability by Market Segments (Product/Age /Sales Channel/Region)
        • Sales Footprint
        • Strategy Overview
        • Skretting (Nutreco)
        • BioMar Group
        • ADM
        • Ridley Corporation
        • Charoen Pokphand Foods (CPF)
        • Aller Aqua
        • De Heus Animal Nutrition
        • Grobest Group
        • Biomin
        • Others
    • Assumptions & Acronyms Used
    • Research Methodology

List of Tables

  • Table 1: Global Market Value (USD Million) Forecast by Region, 2020-2035
  • Table 2: Global Market Value (USD Million) Forecast by Protein Source, 2020-2035
  • Table 3: Global Market Value (USD Million) Forecast by Livestock / Aquaculture Species, 2020-2035
  • Table 4: Global Market Value (USD Million) Forecast by Functionality, 2020-2035
  • Table 5: Global Market Value (USD Million) Forecast by Form, 2020-2035
  • Table 6: Global Market Value (USD Million) Forecast by Additive Integration, 2020-2035
  • Table 7: Global Market Value (USD Million) Forecast by Sales Channel, 2020-2035
  • Table 8: North America Market Value (USD Million) Forecast by Country, 2020-2035
  • Table 9: North America Market Value (USD Million) Forecast by Protein Source, 2020-2035
  • Table 10: North America Market Value (USD Million) Forecast by Livestock / Aquaculture Species, 2020-2035
  • Table 11: North America Market Value (USD Million) Forecast by Functionality, 2020-2035
  • Table 12: North America Market Value (USD Million) Forecast by Form, 2020-2035
  • Table 13: North America Market Value (USD Million) Forecast by Additive Integration, 2020-2035
  • Table 14: North America Market Value (USD Million) Forecast by Sales Channel, 2020-2035
  • Table 15: Latin America Market Value (USD Million) Forecast by Country, 2020-2035
  • Table 16: Latin America Market Value (USD Million) Forecast by Protein Source, 2020-2035
  • Table 17: Latin America Market Value (USD Million) Forecast by Livestock / Aquaculture Species, 2020-2035
  • Table 18: Latin America Market Value (USD Million) Forecast by Functionality, 2020-2035
  • Table 19: Latin America Market Value (USD Million) Forecast by Form, 2020-2035
  • Table 20: Latin America Market Value (USD Million) Forecast by Additive Integration, 2020-2035
  • Table 21: Latin America Market Value (USD Million) Forecast by Sales Channel, 2020-2035
  • Table 22: Europe Market Value (USD Million) Forecast by Country, 2020-2035
  • Table 23: Europe Market Value (USD Million) Forecast by Protein Source, 2020-2035
  • Table 24: Europe Market Value (USD Million) Forecast by Livestock / Aquaculture Species, 2020-2035
  • Table 25: Europe Market Value (USD Million) Forecast by Functionality, 2020-2035
  • Table 26: Europe Market Value (USD Million) Forecast by Form, 2020-2035
  • Table 27: Europe Market Value (USD Million) Forecast by Additive Integration, 2020-2035
  • Table 28: Europe Market Value (USD Million) Forecast by Sales Channel, 2020-2035
  • Table 29: East Asia Market Value (USD Million) Forecast by Country, 2020-2035
  • Table 30: East Asia Market Value (USD Million) Forecast by Protein Source, 2020-2035
  • Table 31: East Asia Market Value (USD Million) Forecast by Livestock / Aquaculture Species, 2020-2035
  • Table 32: East Asia Market Value (USD Million) Forecast by Functionality, 2020-2035
  • Table 33: East Asia Market Value (USD Million) Forecast by Form, 2020-2035
  • Table 34: East Asia Market Value (USD Million) Forecast by Additive Integration, 2020-2035
  • Table 35: East Asia Market Value (USD Million) Forecast by Sales Channel, 2020-2035
  • Table 36: South Asia & Pacific Market Value (USD Million) Forecast by Country, 2020-2035
  • Table 37: South Asia & Pacific Market Value (USD Million) Forecast by Protein Source, 2020-2035
  • Table 38: South Asia & Pacific Market Value (USD Million) Forecast by Livestock / Aquaculture Species, 2020-2035
  • Table 39: South Asia & Pacific Market Value (USD Million) Forecast by Functionality, 2020-2035
  • Table 40: South Asia & Pacific Market Value (USD Million) Forecast by Form, 2020-2035
  • Table 41: South Asia & Pacific Market Value (USD Million) Forecast by Additive Integration, 2020-2035
  • Table 42: South Asia & Pacific Market Value (USD Million) Forecast by Sales Channel, 2020-2035
  • Table 43: Middle East and Africa Market Value (USD Million) Forecast by Country, 2020-2035
  • Table 44: Middle East and Africa Market Value (USD Million) Forecast by Protein Source, 2020-2035
  • Table 45: Middle East and Africa Market Value (USD Million) Forecast by Livestock / Aquaculture Species, 2020-2035
  • Table 46: Middle East and Africa Market Value (USD Million) Forecast by Functionality, 2020-2035
  • Table 47: Middle East and Africa Market Value (USD Million) Forecast by Form, 2020-2035
  • Table 48: Middle East and Africa Market Value (USD Million) Forecast by Additive Integration, 2020-2035
  • Table 49: Middle East and Africa Market Value (USD Million) Forecast by Sales Channel, 2020-2035

List of Figures

  • Figure 1: Global Market Pricing Analysis
  • Figure 2: Global Market Value (USD Million) Forecast 2020-2035
  • Figure 3: Global Market Value Share and BPS Analysis by Protein Source, 2025 and 2035
  • Figure 4: Global Market Y-o-Y Growth Comparison by Protein Source, 2025-2035
  • Figure 5: Global Market Attractiveness Analysis by Protein Source
  • Figure 6: Global Market Value Share and BPS Analysis by Livestock / Aquaculture Species, 2025 and 2035
  • Figure 7: Global Market Y-o-Y Growth Comparison by Livestock / Aquaculture Species, 2025-2035
  • Figure 8: Global Market Attractiveness Analysis by Livestock / Aquaculture Species
  • Figure 9: Global Market Value Share and BPS Analysis by Functionality, 2025 and 2035
  • Figure 10: Global Market Y-o-Y Growth Comparison by Functionality, 2025-2035
  • Figure 11: Global Market Attractiveness Analysis by Functionality
  • Figure 12: Global Market Value Share and BPS Analysis by Form, 2025 and 2035
  • Figure 13: Global Market Y-o-Y Growth Comparison by Form, 2025-2035
  • Figure 14: Global Market Attractiveness Analysis by Form
  • Figure 15: Global Market Value Share and BPS Analysis by Additive Integration, 2025 and 2035
  • Figure 16: Global Market Y-o-Y Growth Comparison by Additive Integration, 2025-2035
  • Figure 17: Global Market Attractiveness Analysis by Additive Integration
  • Figure 18: Global Market Value Share and BPS Analysis by Sales Channel, 2025 and 2035
  • Figure 19: Global Market Y-o-Y Growth Comparison by Sales Channel, 2025-2035
  • Figure 20: Global Market Attractiveness Analysis by Sales Channel
  • Figure 21: Global Market Value (USD Million) Share and BPS Analysis by Region, 2025 and 2035
  • Figure 22: Global Market Y-o-Y Growth Comparison by Region, 2025-2035
  • Figure 23: Global Market Attractiveness Analysis by Region
  • Figure 24: North America Market Incremental $ Opportunity, 2025-2035
  • Figure 25: Latin America Market Incremental $ Opportunity, 2025-2035
  • Figure 26: Europe Market Incremental $ Opportunity, 2025-2035
  • Figure 27: East Asia Market Incremental $ Opportunity, 2025-2035
  • Figure 28: South Asia & Pacific Market Incremental $ Opportunity, 2025-2035
  • Figure 29: Middle East and Africa Market Incremental $ Opportunity, 2025-2035
  • Figure 30: North America Market Value Share and BPS Analysis by Country, 2025 and 2035
  • Figure 31: North America Market Value Share and BPS Analysis by Protein Source, 2025 and 2035
  • Figure 32: North America Market Y-o-Y Growth Comparison by Protein Source, 2025-2035
  • Figure 33: North America Market Attractiveness Analysis by Protein Source
  • Figure 34: North America Market Value Share and BPS Analysis by Livestock / Aquaculture Species, 2025 and 2035
  • Figure 35: North America Market Y-o-Y Growth Comparison by Livestock / Aquaculture Species, 2025-2035
  • Figure 36: North America Market Attractiveness Analysis by Livestock / Aquaculture Species
  • Figure 37: North America Market Value Share and BPS Analysis by Functionality, 2025 and 2035
  • Figure 38: North America Market Y-o-Y Growth Comparison by Functionality, 2025-2035
  • Figure 39: North America Market Attractiveness Analysis by Functionality
  • Figure 40: North America Market Value Share and BPS Analysis by Form, 2025 and 2035
  • Figure 41: North America Market Y-o-Y Growth Comparison by Form, 2025-2035
  • Figure 42: North America Market Attractiveness Analysis by Form
  • Figure 43: North America Market Value Share and BPS Analysis by Additive Integration, 2025 and 2035
  • Figure 44: North America Market Y-o-Y Growth Comparison by Additive Integration, 2025-2035
  • Figure 45: North America Market Attractiveness Analysis by Additive Integration
  • Figure 46: North America Market Value Share and BPS Analysis by Sales Channel, 2025 and 2035
  • Figure 47: North America Market Y-o-Y Growth Comparison by Sales Channel, 2025-2035
  • Figure 48: North America Market Attractiveness Analysis by Sales Channel
  • Figure 49: Latin America Market Value Share and BPS Analysis by Country, 2025 and 2035
  • Figure 50: Latin America Market Value Share and BPS Analysis by Protein Source, 2025 and 2035
  • Figure 51: Latin America Market Y-o-Y Growth Comparison by Protein Source, 2025-2035
  • Figure 52: Latin America Market Attractiveness Analysis by Protein Source
  • Figure 53: Latin America Market Value Share and BPS Analysis by Livestock / Aquaculture Species, 2025 and 2035
  • Figure 54: Latin America Market Y-o-Y Growth Comparison by Livestock / Aquaculture Species, 2025-2035
  • Figure 55: Latin America Market Attractiveness Analysis by Livestock / Aquaculture Species
  • Figure 56: Latin America Market Value Share and BPS Analysis by Functionality, 2025 and 2035
  • Figure 57: Latin America Market Y-o-Y Growth Comparison by Functionality, 2025-2035
  • Figure 58: Latin America Market Attractiveness Analysis by Functionality
  • Figure 59: Latin America Market Value Share and BPS Analysis by Form, 2025 and 2035
  • Figure 60: Latin America Market Y-o-Y Growth Comparison by Form, 2025-2035
  • Figure 61: Latin America Market Attractiveness Analysis by Form
  • Figure 62: Latin America Market Value Share and BPS Analysis by Additive Integration, 2025 and 2035
  • Figure 63: Latin America Market Y-o-Y Growth Comparison by Additive Integration, 2025-2035
  • Figure 64: Latin America Market Attractiveness Analysis by Additive Integration
  • Figure 65: Latin America Market Value Share and BPS Analysis by Sales Channel, 2025 and 2035
  • Figure 66: Latin America Market Y-o-Y Growth Comparison by Sales Channel, 2025-2035
  • Figure 67: Latin America Market Attractiveness Analysis by Sales Channel
  • Figure 68: Europe Market Value Share and BPS Analysis by Country, 2025 and 2035
  • Figure 69: Europe Market Value Share and BPS Analysis by Protein Source, 2025 and 2035
  • Figure 70: Europe Market Y-o-Y Growth Comparison by Protein Source, 2025-2035
  • Figure 71: Europe Market Attractiveness Analysis by Protein Source
  • Figure 72: Europe Market Value Share and BPS Analysis by Livestock / Aquaculture Species, 2025 and 2035
  • Figure 73: Europe Market Y-o-Y Growth Comparison by Livestock / Aquaculture Species, 2025-2035
  • Figure 74: Europe Market Attractiveness Analysis by Livestock / Aquaculture Species
  • Figure 75: Europe Market Value Share and BPS Analysis by Functionality, 2025 and 2035
  • Figure 76: Europe Market Y-o-Y Growth Comparison by Functionality, 2025-2035
  • Figure 77: Europe Market Attractiveness Analysis by Functionality
  • Figure 78: Europe Market Value Share and BPS Analysis by Form, 2025 and 2035
  • Figure 79: Europe Market Y-o-Y Growth Comparison by Form, 2025-2035
  • Figure 80: Europe Market Attractiveness Analysis by Form
  • Figure 81: Europe Market Value Share and BPS Analysis by Additive Integration, 2025 and 2035
  • Figure 82: Europe Market Y-o-Y Growth Comparison by Additive Integration, 2025-2035
  • Figure 83: Europe Market Attractiveness Analysis by Additive Integration
  • Figure 84: Europe Market Value Share and BPS Analysis by Sales Channel, 2025 and 2035
  • Figure 85: Europe Market Y-o-Y Growth Comparison by Sales Channel, 2025-2035
  • Figure 86: Europe Market Attractiveness Analysis by Sales Channel
  • Figure 87: East Asia Market Value Share and BPS Analysis by Country, 2025 and 2035
  • Figure 88: East Asia Market Value Share and BPS Analysis by Protein Source, 2025 and 2035
  • Figure 89: East Asia Market Y-o-Y Growth Comparison by Protein Source, 2025-2035
  • Figure 90: East Asia Market Attractiveness Analysis by Protein Source
  • Figure 91: East Asia Market Value Share and BPS Analysis by Livestock / Aquaculture Species, 2025 and 2035
  • Figure 92: East Asia Market Y-o-Y Growth Comparison by Livestock / Aquaculture Species, 2025-2035
  • Figure 93: East Asia Market Attractiveness Analysis by Livestock / Aquaculture Species
  • Figure 94: East Asia Market Value Share and BPS Analysis by Functionality, 2025 and 2035
  • Figure 95: East Asia Market Y-o-Y Growth Comparison by Functionality, 2025-2035
  • Figure 96: East Asia Market Attractiveness Analysis by Functionality
  • Figure 97: East Asia Market Value Share and BPS Analysis by Form, 2025 and 2035
  • Figure 98: East Asia Market Y-o-Y Growth Comparison by Form, 2025-2035
  • Figure 99: East Asia Market Attractiveness Analysis by Form
  • Figure 100: East Asia Market Value Share and BPS Analysis by Additive Integration, 2025 and 2035
  • Figure 101: East Asia Market Y-o-Y Growth Comparison by Additive Integration, 2025-2035
  • Figure 102: East Asia Market Attractiveness Analysis by Additive Integration
  • Figure 103: East Asia Market Value Share and BPS Analysis by Sales Channel, 2025 and 2035
  • Figure 104: East Asia Market Y-o-Y Growth Comparison by Sales Channel, 2025-2035
  • Figure 105: East Asia Market Attractiveness Analysis by Sales Channel
  • Figure 106: South Asia & Pacific Market Value Share and BPS Analysis by Country, 2025 and 2035
  • Figure 107: South Asia & Pacific Market Value Share and BPS Analysis by Protein Source, 2025 and 2035
  • Figure 108: South Asia & Pacific Market Y-o-Y Growth Comparison by Protein Source, 2025-2035
  • Figure 109: South Asia & Pacific Market Attractiveness Analysis by Protein Source
  • Figure 110: South Asia & Pacific Market Value Share and BPS Analysis by Livestock / Aquaculture Species, 2025 and 2035
  • Figure 111: South Asia & Pacific Market Y-o-Y Growth Comparison by Livestock / Aquaculture Species, 2025-2035
  • Figure 112: South Asia & Pacific Market Attractiveness Analysis by Livestock / Aquaculture Species
  • Figure 113: South Asia & Pacific Market Value Share and BPS Analysis by Functionality, 2025 and 2035
  • Figure 114: South Asia & Pacific Market Y-o-Y Growth Comparison by Functionality, 2025-2035
  • Figure 115: South Asia & Pacific Market Attractiveness Analysis by Functionality
  • Figure 116: South Asia & Pacific Market Value Share and BPS Analysis by Form, 2025 and 2035
  • Figure 117: South Asia & Pacific Market Y-o-Y Growth Comparison by Form, 2025-2035
  • Figure 118: South Asia & Pacific Market Attractiveness Analysis by Form
  • Figure 119: South Asia & Pacific Market Value Share and BPS Analysis by Additive Integration, 2025 and 2035
  • Figure 120: South Asia & Pacific Market Y-o-Y Growth Comparison by Additive Integration, 2025-2035
  • Figure 121: South Asia & Pacific Market Attractiveness Analysis by Additive Integration
  • Figure 122: South Asia & Pacific Market Value Share and BPS Analysis by Sales Channel, 2025 and 2035
  • Figure 123: South Asia & Pacific Market Y-o-Y Growth Comparison by Sales Channel, 2025-2035
  • Figure 124: South Asia & Pacific Market Attractiveness Analysis by Sales Channel
  • Figure 125: Middle East and Africa Market Value Share and BPS Analysis by Country, 2025 and 2035
  • Figure 126: Middle East and Africa Market Value Share and BPS Analysis by Protein Source, 2025 and 2035
  • Figure 127: Middle East and Africa Market Y-o-Y Growth Comparison by Protein Source, 2025-2035
  • Figure 128: Middle East and Africa Market Attractiveness Analysis by Protein Source
  • Figure 129: Middle East and Africa Market Value Share and BPS Analysis by Livestock / Aquaculture Species, 2025 and 2035
  • Figure 130: Middle East and Africa Market Y-o-Y Growth Comparison by Livestock / Aquaculture Species, 2025-2035
  • Figure 131: Middle East and Africa Market Attractiveness Analysis by Livestock / Aquaculture Species
  • Figure 132: Middle East and Africa Market Value Share and BPS Analysis by Functionality, 2025 and 2035
  • Figure 133: Middle East and Africa Market Y-o-Y Growth Comparison by Functionality, 2025-2035
  • Figure 134: Middle East and Africa Market Attractiveness Analysis by Functionality
  • Figure 135: Middle East and Africa Market Value Share and BPS Analysis by Form, 2025 and 2035
  • Figure 136: Middle East and Africa Market Y-o-Y Growth Comparison by Form, 2025-2035
  • Figure 137: Middle East and Africa Market Attractiveness Analysis by Form
  • Figure 138: Middle East and Africa Market Value Share and BPS Analysis by Additive Integration, 2025 and 2035
  • Figure 139: Middle East and Africa Market Y-o-Y Growth Comparison by Additive Integration, 2025-2035
  • Figure 140: Middle East and Africa Market Attractiveness Analysis by Additive Integration
  • Figure 141: Middle East and Africa Market Value Share and BPS Analysis by Sales Channel, 2025 and 2035
  • Figure 142: Middle East and Africa Market Y-o-Y Growth Comparison by Sales Channel, 2025-2035
  • Figure 143: Middle East and Africa Market Attractiveness Analysis by Sales Channel
  • Figure 144: Global Market - Tier Structure Analysis
  • Figure 145: Global Market - Company Share Analysis

Frequently Asked Questions

How big is the Zero-Fishmeal Feed Market in 2025?

The global Zero-Fishmeal Feed Market is estimated to be valued at USD 0.96 billion in 2025.

What will be the size of the Zero-Fishmeal Feed Market in 2035?

The market size for the Zero-Fishmeal Feed Market is projected to reach USD 1.70 billion by 2035.

How much will the Zero-Fishmeal Feed Market grow between 2025 and 2035?

The Zero-Fishmeal Feed Market is expected to grow at a CAGR of 5.9% between 2025 and 2035.

What are the key product types in the Zero-Fishmeal Feed Market?

The key protein types in the Zero-Fishmeal Feed Market include plant-based proteins (soy, pea, corn gluten, wheat gluten, canola, lupin), insect-based proteins (black soldier fly larvae, mealworm), algae-based proteins, fermentation-derived proteins, single-cell proteins (bacterial, yeast, fungal), and blended protein sources.

Which protein source segment is expected to contribute the largest share in the Zero-Fishmeal Feed Market in 2025?

In terms of protein source, plant-based proteins are expected to command the largest share at 35% in 2025, followed closely by insect-based proteins.

Explore Similar Insights

Future Market Insights

Zero-Fishmeal Feed Market