Meat Alternative Market Outlook from 2024 to 2034

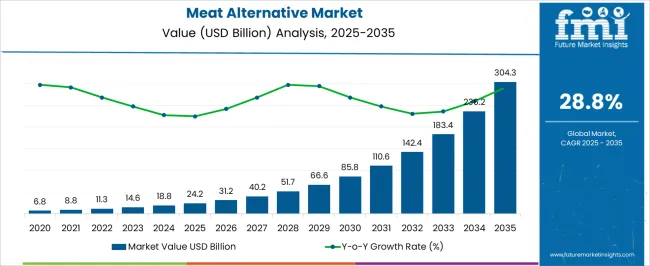
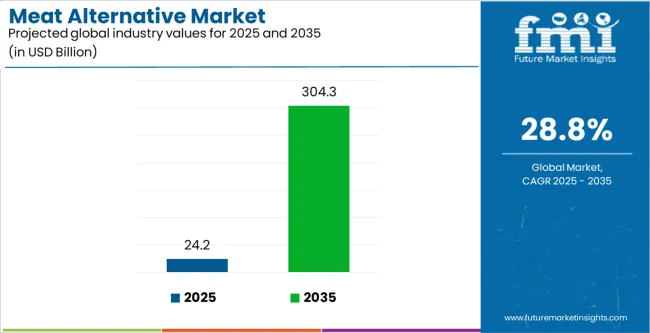
The global meat alternative market is estimated to reach a valuation of USD 18.8 billion in 2024. The market is projected to reach a value of USD 299 billion by 2034, expanding at a CAGR of 28.8% over the assessment period.

Consumption Analysis of Meat Alternatives

  • Rise in the number of global vegan/vegetarian population
  • Surge in the demand for meat alternatives from the sports nutrition industry
  • Rising concerns regarding the ever-growing obese population spur the demand for meat alternatives that are fewer in calories
  • Substituting lupines with soybeans in tempeh production
  • Aggressive marketing efforts to make plant-based foods mainstream
  • Major food processing industries are investing in meat alternatives to capture the emerging segment of health-conscious and ethical consumers
  • Going forward, plant-based meat sales are likely to account for a significant part of demand in the global market for meat alternatives
Attributes Key Insights
Meat Alternative Market Size (2024E) USD 18.8 billion
Projected Market Value (2034F) USD 299 billion
Value-based CAGR (2024 to 2034) 28.8%
Collective Value Share: Top 3 Countries 38%

Key Trends Boosting the Meat Alternative Market

  • The rising trend of following a vegan lifestyle is fueling the demand for meat alternatives.
  • The growing trend toward clean eating, wherein customers seek to comprehend and understand what they are actually eating, is gaining significant ground. More consumers are purchasing products with clear labels and distinguishable ingredients. Producers are thus exploiting this situation by choosing basic ingredients extracted from minimally processed foods to increase the application and performance of product ingredients.
  • Similar to plant-based proteins, plant-based meat replacements also contain fibers, starches, gums, and other stabilizers. They are not only natural but also multi-functional. Hence, their demand is rising as people continue to shop for natural and clean-label products.
  • Rising product developments in the chilled, diffused, and frozen categories, sparked by increasing demand for novel items. Consumers thus have a broad selection of goods and brands thanks to innovation. A wide variety of meat analogs with a prolonged shelf life is projected to be met by consumer recognition.

Emerging Opportunities in the Meat Alternative Market

Reshaping Meat Industries with Innovative Meat Alternative Proteins

Technological advancements are expected to be a game-changer for meat alternative producers. A lot has been achieved in the past couple of years, with the development of mock meat, mycoprotein, and impossible burgers, which has paved a path for plant-based meat out of the trough.

Previously available meat alternatives did not taste or look like meat, despite their name. However, with an increase in research and development in the meat alternative market several new and unique products have been introduced. The availability of clean-label and plant-based products in the market such as tofu, tempeh, TVP, seitan, Quorn, soy, and wheat are the best meat alternatives.

Making Gluten-free, Sustainable Lifestyle a Reality

A growing number of vegans and flexitarians is projected to drive the market’s growth. A substantial portion of the population is focused on restraining animal protein consumption and more than 50% aim to make this a lasting change. The consumption of vegan food is ubiquitous like in restaurants, grocery stores, bakeries, and vegan lunches at school and home. The rise in the use of meat alternatives to support the trend of a gluten-free, sustainable lifestyle is inevitable.

Country-wise Insights

The table below sheds a light on the growth opportunities in the selected countries.

Countries CAGR
United States 10.3%
United Kingdom 8.1%
China 6.2%
India 3%
Japan 2.4%

Rise in Meat Alternatives in the Indian Market

India has exhibited positive trends in the expansion of the manufacturing base of meat alternatives due to the 100% FDI opportunity in the food processing industry, while the consumer market is largely driven by rising health concerns and veganism vogue.

Indian diet is deficient in protein despite producing protein-rich foods like legumes, soybeans, beans, dairy, meat, fish, and poultry. Plant-based protein sources can play a vital role in the treatment of deficiency because they are not only diverse but also easy to use.

India has a sizeable consumer base and a significant market share. This country is also expected to have fast growth during the forecast period, owing to an increase in demand for vegan products. The government has taken major steps to increase the market share of meat alternatives. In the future, plant-based meat analogs and cultured meat are expected to emerge as promising protein sources to develop meat alternatives.
Continuous Innovative Flavors and Varieties Boosting Sales of Alternative Meat in the United States

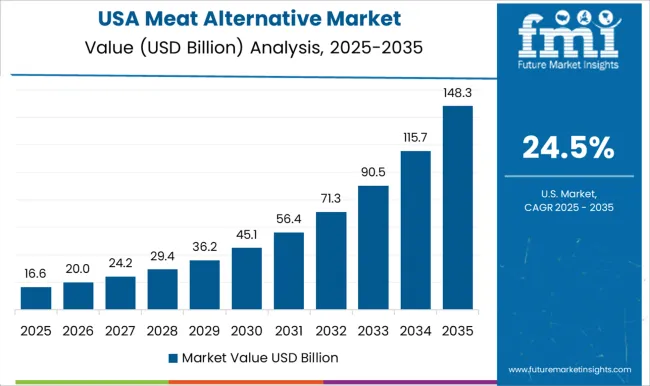
Meat and dairy products are staples of the Western diet, but there has been a shift from an animal meat-based diet to a plant-based one due to rising health concerns like obesity, high cholesterol levels, heart risk, and even cancer. Seeking a healthy alternative to meat, and veganism are drivers for the meat alternative market in the United States in recent years.

Various big companies and start-ups have taken steps to drive the market towards meat alternative products. For example, KFC introduced Beyond Fried Chicken, a line of plant-based meats, in several locations across the world. The data shows a surety of the rising meat alternative market in the United States.

Availability of Products at Competitive Prices Elevating Meat Alternative Sales in China

Industrialization in China has increased discretionary income for the region's middle classes. This has increased consumer demand for nutritious, high-quality, high-protein food products. Consumer eating habits are changing, and more people are removing meat from their diets.

Food products like wheat, soybeans, and peas can easily be incorporated into classic Chinese dishes like dumplings and rolls and are significantly cheaper. As a result, the increased demand for meat alternatives in the region has driven the meat Alternative market trend.

Pre-prepared Plant-based Meat Alternatives Gaining Consumers in the United Kingdom

A busy lifestyle drives the popularity of meat alternatives for its convenience, especially with the rise in global culinary trends. The foodservice industry benefits from the efficiency of using pre-prepared meat alternatives. Increased accessibility through supermarkets and online platforms contributes to the growth in sales revenue.

Local Customization of Meat Alternatives to Support the Market in Japan

In Japan, manufacturers are focusing on innovation and marketing efforts to meet consumer preferences, while e-commerce facilitates easy access. The acceptance of meat alternatives in Japan is influenced by culinary trends, convenience, and competitive pricing, supported by favorable trade policies, local customization, and adherence to culinary traditions.

Category-wise Insights

Tofu is the Preferential Source of the Meat Alternative

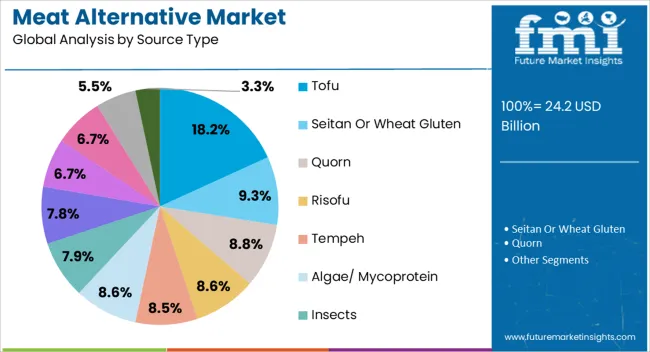
Top Source Type Tofu
Market Share in 2024 14.2%

The tofu segment is estimated to garner a market share of 14.2% in 2024. Tofu is the first choice of consumers seeking cheaper plant-based meat alternatives. Increasing demand for classic vegetarian staples such as tofu is anticipated to compel manufacturers to come up with their frozen variants.

Online Channels Facilitate Higher Sales of Meat Alternatives

Top Distribution Channel Online Sales Channel
Market Share in 2024 17.3%

The online sales channel is projected to account for a 17.3% market share in 2024. People are increasingly opting for online channels to make their food-related purchases due to access to a wider product range from different brands on a fingertip.

Home delivery convenience offered by online platforms is particularly appealing factor for busy people. Thus, the target segment is poised to witness significant growth through 2034.

Competitive Landscape

Market players are emphasizing the innovation of plant-based meat alternatives as they gain consumers’ perspectives on the constant need for change. To distinguish themselves from the crowd, top companies are narrowing down their focus on the taste, texture, and dietary requirements of customers, like providing gluten-free, low-fat, and allergen-free options.

Industry participants are further investing in marketing and brand building to increase their recognition power among potential customers. Adding onto this, brands are strengthening their ties with different distributors to ensure wide visibility on store shelves.

To make the shift towards meat alternatives easy, market players are competitively pricing their offerings so that price doesn’t remain the issue while choosing vegetarian substitutes for meat.

Recent Developments in the Meat Alternative Market

  • In August 2023, Shelf-stable plant-based products are introduced by Nestlé. The soy-based Maggi faux-meat items are 'certified as vegan.' The line includes the first plant-based minced beef from the company that is shelf-stable. SKUs that blend vegan 'mincemeat' with spice for tacos, empanadas, spaghetti bolognese, and lentil soup are among Nestlé's new offerings.
  • In September 2023, Vertera ProBite, a plant-based meat substitute, is released by Novozymes. Vertera ProBite is a new product from biosolutions business Novozymes designed for producers of meat substitutes. The product's formulation was intended to improve plant-based goods' texture. The liquid product Vertera ProBite is likely to have advantages like straightforward labelling and convenience of use.
  • In November 2023, new mushroom-based meat substitutes are released by Meati. Meati, a company that makes meat substitutes using its mushroom component, has released four new goods. Italian-Seasoned Cutlet, Garlic & Black Pepper Steak, Crispy Bites, and Spicy Crispy Cutlet are the latest offerings.
  • Kuleana, a San Francisco start-up, has combined plants and biotechnology to develop sushi-grade food. In 2021, TIME Magazine featured Kuleana’s plant-based Tuna as one of the best creations that are free from harmful substances found in fish.
  • In May 2021, Unilever partnered with the food tech company ENOUGH to develop new plant-based meat products, starting in the United Kingdom. The technology involves a unique zero-waste fermentation process to grow a high-quality protein. The raw materials include wheat and corn, which eventually produce mycoprotein, a complete food ingredient containing all essential amino acids.

Key Companies in the Meat Alternative Market

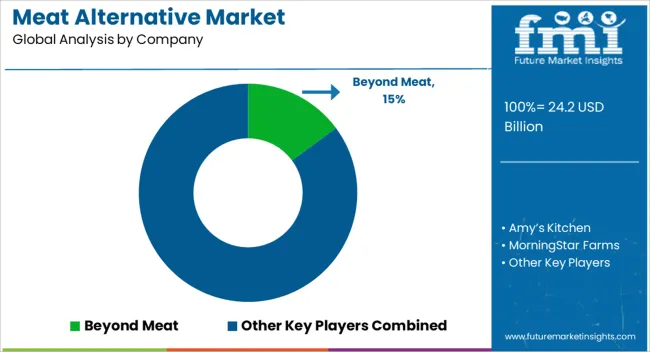
  • Beyond Meat
  • Amy’s Kitchen
  • MorningStar Farms
  • Tofurky
  • Field Roast
  • VBites
  • Maple Leaf Foods
  • Kellogg
  • Pinnacle Foods

Key Market Segmentation

By Type:

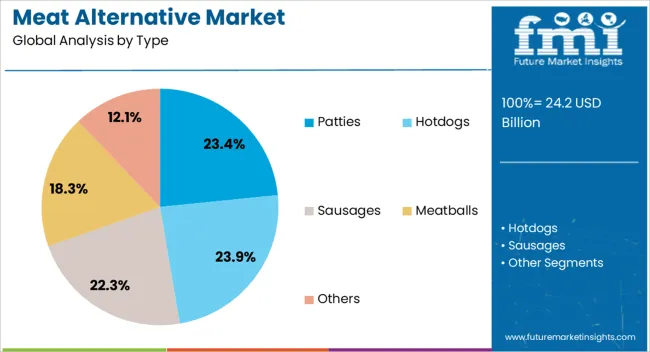
  • Patties
  • Hotdogs
  • Sausages
  • Meatballs
  • Others

By Nature:

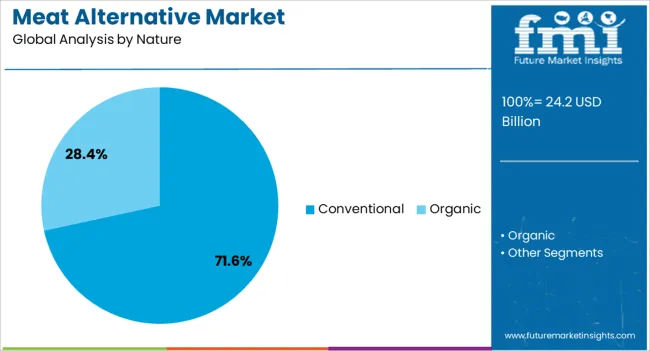
  • Organic
  • Conventional

By Source Type:

  • Seitan or Wheat gluten
  • Tofu
  • Quorn
  • Risofu
  • Tempeh
  • Algae/ Mycoprotein
  • Insects
  • Textured Vegetable Protein
  • Fermented proteins
  • Fish Protein
  • Cultured or ‘clean’ meat
  • Others (Yaso, Nato and Miso)

By Application:

  • Frozen Food
  • Bakeries
  • Pet Food
  • Supplements
  • Others

By Distribution Channel:

  • Supermarkets
  • Departmental Store
  • Modern Trade
  • Food Chain Services
  • Online Stores
  • Others

By Region:

  • North America
  • Latin America
  • Europe
  • Middle East and Africa
  • East Asia
  • South Asia
  • Oceania

Table of Content

  • 1. Executive Summary
  • 2. Market Overview
  • 3. Market Background
  • 4. Global Market Analysis 2019 to 2023 and Forecast, 2024 to 2034
  • 5. Global Market Analysis 2019 to 2023 and Forecast 2024 to 2034, By Product Type
    • 5.1. Patties
    • 5.2. Hotdogs
    • 5.3. Sausages
    • 5.4. Nuggets
    • 5.5. Meatballs
  • 6. Global Market Analysis 2019 to 2023 and Forecast 2024 to 2034, By Nature
    • 6.1. Organic
    • 6.2. Conventional
  • 7. Global Market Analysis 2019 to 2023 and Forecast 2024 to 2034, By Category
    • 7.1. Seitan or Wheat Gluten
    • 7.2. Tofu
    • 7.3. Quorn
    • 7.4. Risofu
    • 7.5. Tempeh
    • 7.6. Algae/ Mycoprotein
    • 7.7. Insects
    • 7.8. Textured Vegetable Protein
    • 7.9. Fermented Proteins
    • 7.10. Fish Protein
    • 7.11. Cultured or ‘Clean’ Meat
    • 7.12. Others (Yaso, Nato and Miso)
  • 8. Global Market Analysis 2019 to 2023 and Forecast 2024 to 2034, By Application
    • 8.1. Frozen Food
    • 8.2. Bakeries
    • 8.3. Pet Food
    • 8.4. Supplements
    • 8.5. Others
  • 9. Global Market Analysis 2019 to 2023 and Forecast 2024 to 2034, By Distribution Channel
    • 9.1. Supermarkets
    • 9.2. Departmental Stores
    • 9.3. Modern Trade
    • 9.4. Food Chain Services
    • 9.5. Online Stores
    • 9.6. Others
  • 10. Global Market Analysis 2019 to 2023 and Forecast 2024 to 2034, By Region
    • 10.1. North America
    • 10.2. Latin America
    • 10.3. Europe
    • 10.4. East Asia
    • 10.5. South Asia
    • 10.6. Oceania
    • 10.7. Middle East and Africa
  • 11. North America Market Analysis 2019 to 2023 and Forecast 2024 to 2034, By Country
  • 12. Latin America Market Analysis 2019 to 2023 and Forecast 2024 to 2034, By Country
  • 13. Europe Market Analysis 2019 to 2023 and Forecast 2024 to 2034, By Country
  • 14. East Asia Market Analysis 2019 to 2023 and Forecast 2024 to 2034, By Country
  • 15. South Asia Market Analysis 2019 to 2023 and Forecast 2024 to 2034, By Country
  • 16. Oceania Market Analysis 2019 to 2023 and Forecast 2024 to 2034, By Country
  • 17. Middle East and Africa Market Analysis 2019 to 2023 and Forecast 2024 to 2034, By Country
  • 18. Key Countries Market Analysis
  • 19. Market Structure Analysis
  • 20. Competition Analysis
    • 20.1. Nestle
    • 20.2. Raised and Rooted Inc
    • 20.3. Kellogg’s
    • 20.4. Beyond Meat
    • 20.5. Gardien
    • 20.6. Select Harvests Limited
    • 20.7. Durak Findik
    • 20.8. Grower Direct Nut Co. Ltd
    • 20.9. Sun-Maid Growers of California
    • 20.10. Nichols Farms
    • 20.11. John B. Sanfilippo & Son
    • 20.12. Borges Agricultural & Industrial Nuts
    • 20.13. The Wonderful Company LLC
    • 20.14. Other
  • 21. Assumptions & Acronyms Used
  • 22. Research Methodology

List of Tables

Table 1: Global Market Value (US$ Million) Forecast by Region, 2019 to 2034

Table 2: Global Market Volume (MT) Forecast by Region, 2019 to 2034

Table 3: Global Market Value (US$ Million) Forecast by Product Type, 2019 to 2034

Table 4: Global Market Volume (MT) Forecast by Product Type, 2019 to 2034

Table 5: Global Market Value (US$ Million) Forecast by Nature, 2019 to 2034

Table 6: Global Market Volume (MT) Forecast by Nature, 2019 to 2034

Table 7: Global Market Value (US$ Million) Forecast by Form, 2019 to 2034

Table 8: Global Market Volume (MT) Forecast by Form, 2019 to 2034

Table 9: Global Market Value (US$ Million) Forecast by End Use Application, 2019 to 2034

Table 10: Global Market Volume (MT) Forecast by End Use Application, 2019 to 2034

Table 11: Global Market Value (US$ Million) Forecast by Retail, 2019 to 2034

Table 12: Global Market Volume (MT) Forecast by Retail, 2019 to 2034

Table 13: North America Market Value (US$ Million) Forecast by Country, 2019 to 2034

Table 14: North America Market Volume (MT) Forecast by Country, 2019 to 2034

Table 15: North America Market Value (US$ Million) Forecast by Product Type, 2019 to 2034

Table 16: North America Market Volume (MT) Forecast by Product Type, 2019 to 2034

Table 17: North America Market Value (US$ Million) Forecast by Nature, 2019 to 2034

Table 18: North America Market Volume (MT) Forecast by Nature, 2019 to 2034

Table 19: North America Market Value (US$ Million) Forecast by Form, 2019 to 2034

Table 20: North America Market Volume (MT) Forecast by Form, 2019 to 2034

Table 21: North America Market Value (US$ Million) Forecast by End Use Application, 2019 to 2034

Table 22: North America Market Volume (MT) Forecast by End Use Application, 2019 to 2034

Table 23: North America Market Value (US$ Million) Forecast by Retail, 2019 to 2034

Table 24: North America Market Volume (MT) Forecast by Retail, 2019 to 2034

Table 25: Latin America Market Value (US$ Million) Forecast by Country, 2019 to 2034

Table 26: Latin America Market Volume (MT) Forecast by Country, 2019 to 2034

Table 27: Latin America Market Value (US$ Million) Forecast by Product Type, 2019 to 2034

Table 28: Latin America Market Volume (MT) Forecast by Product Type, 2019 to 2034

Table 29: Latin America Market Value (US$ Million) Forecast by Nature, 2019 to 2034

Table 30: Latin America Market Volume (MT) Forecast by Nature, 2019 to 2034

Table 31: Latin America Market Value (US$ Million) Forecast by Form, 2019 to 2034

Table 32: Latin America Market Volume (MT) Forecast by Form, 2019 to 2034

Table 33: Latin America Market Value (US$ Million) Forecast by End Use Application, 2019 to 2034

Table 34: Latin America Market Volume (MT) Forecast by End Use Application, 2019 to 2034

Table 35: Latin America Market Value (US$ Million) Forecast by Retail, 2019 to 2034

Table 36: Latin America Market Volume (MT) Forecast by Retail, 2019 to 2034

Table 37: Europe Market Value (US$ Million) Forecast by Country, 2019 to 2034

Table 38: Europe Market Volume (MT) Forecast by Country, 2019 to 2034

Table 39: Europe Market Value (US$ Million) Forecast by Product Type, 2019 to 2034

Table 40: Europe Market Volume (MT) Forecast by Product Type, 2019 to 2034

Table 41: Europe Market Value (US$ Million) Forecast by Nature, 2019 to 2034

Table 42: Europe Market Volume (MT) Forecast by Nature, 2019 to 2034

Table 43: Europe Market Value (US$ Million) Forecast by Form, 2019 to 2034

Table 44: Europe Market Volume (MT) Forecast by Form, 2019 to 2034

Table 45: Europe Market Value (US$ Million) Forecast by End Use Application, 2019 to 2034

Table 46: Europe Market Volume (MT) Forecast by End Use Application, 2019 to 2034

Table 47: Europe Market Value (US$ Million) Forecast by Retail, 2019 to 2034

Table 48: Europe Market Volume (MT) Forecast by Retail, 2019 to 2034

Table 49: East Asia Market Value (US$ Million) Forecast by Country, 2019 to 2034

Table 50: East Asia Market Volume (MT) Forecast by Country, 2019 to 2034

Table 51: East Asia Market Value (US$ Million) Forecast by Product Type, 2019 to 2034

Table 52: East Asia Market Volume (MT) Forecast by Product Type, 2019 to 2034

Table 53: East Asia Market Value (US$ Million) Forecast by Nature, 2019 to 2034

Table 54: East Asia Market Volume (MT) Forecast by Nature, 2019 to 2034

Table 55: East Asia Market Value (US$ Million) Forecast by Form, 2019 to 2034

Table 56: East Asia Market Volume (MT) Forecast by Form, 2019 to 2034

Table 57: East Asia Market Value (US$ Million) Forecast by End Use Application, 2019 to 2034

Table 58: East Asia Market Volume (MT) Forecast by End Use Application, 2019 to 2034

Table 59: East Asia Market Value (US$ Million) Forecast by Retail, 2019 to 2034

Table 60: East Asia Market Volume (MT) Forecast by Retail, 2019 to 2034

Table 61: South Asia Market Value (US$ Million) Forecast by Country, 2019 to 2034

Table 62: South Asia Market Volume (MT) Forecast by Country, 2019 to 2034

Table 63: South Asia Market Value (US$ Million) Forecast by Product Type, 2019 to 2034

Table 64: South Asia Market Volume (MT) Forecast by Product Type, 2019 to 2034

Table 65: South Asia Market Value (US$ Million) Forecast by Nature, 2019 to 2034

Table 66: South Asia Market Volume (MT) Forecast by Nature, 2019 to 2034

Table 67: South Asia Market Value (US$ Million) Forecast by Form, 2019 to 2034

Table 68: South Asia Market Volume (MT) Forecast by Form, 2019 to 2034

Table 69: South Asia Market Value (US$ Million) Forecast by End Use Application, 2019 to 2034

Table 70: South Asia Market Volume (MT) Forecast by End Use Application, 2019 to 2034

Table 71: South Asia Market Value (US$ Million) Forecast by Retail, 2019 to 2034

Table 72: South Asia Market Volume (MT) Forecast by Retail, 2019 to 2034

Table 73: Oceania Market Value (US$ Million) Forecast by Country, 2019 to 2034

Table 74: Oceania Market Volume (MT) Forecast by Country, 2019 to 2034

Table 75: Oceania Market Value (US$ Million) Forecast by Product Type, 2019 to 2034

Table 76: Oceania Market Volume (MT) Forecast by Product Type, 2019 to 2034

Table 77: Oceania Market Value (US$ Million) Forecast by Nature, 2019 to 2034

Table 78: Oceania Market Volume (MT) Forecast by Nature, 2019 to 2034

Table 79: Oceania Market Value (US$ Million) Forecast by Form, 2019 to 2034

Table 80: Oceania Market Volume (MT) Forecast by Form, 2019 to 2034

Table 81: Oceania Market Value (US$ Million) Forecast by End Use Application, 2019 to 2034

Table 82: Oceania Market Volume (MT) Forecast by End Use Application, 2019 to 2034

Table 83: Oceania Market Value (US$ Million) Forecast by Retail, 2019 to 2034

Table 84: Oceania Market Volume (MT) Forecast by Retail, 2019 to 2034

Table 85: MEA Market Value (US$ Million) Forecast by Country, 2019 to 2034

Table 86: MEA Market Volume (MT) Forecast by Country, 2019 to 2034

Table 87: MEA Market Value (US$ Million) Forecast by Product Type, 2019 to 2034

Table 88: MEA Market Volume (MT) Forecast by Product Type, 2019 to 2034

Table 89: MEA Market Value (US$ Million) Forecast by Nature, 2019 to 2034

Table 90: MEA Market Volume (MT) Forecast by Nature, 2019 to 2034

Table 91: MEA Market Value (US$ Million) Forecast by Form, 2019 to 2034

Table 92: MEA Market Volume (MT) Forecast by Form, 2019 to 2034

Table 93: MEA Market Value (US$ Million) Forecast by End Use Application, 2019 to 2034

Table 94: MEA Market Volume (MT) Forecast by End Use Application, 2019 to 2034

Table 95: MEA Market Value (US$ Million) Forecast by Retail, 2019 to 2034

Table 96: MEA Market Volume (MT) Forecast by Retail, 2019 to 2034

List of Figures

Figure 1: Global Market Value (US$ Million) by Product Type, 2019 to 2034

Figure 2: Global Market Value (US$ Million) by Nature, 2019 to 2034

Figure 3: Global Market Value (US$ Million) by Form, 2019 to 2034

Figure 4: Global Market Value (US$ Million) by End Use Application, 2019 to 2034

Figure 5: Global Market Value (US$ Million) by Retail, 2019 to 2034

Figure 6: Global Market Value (US$ Million) by Region, 2019 to 2034

Figure 7: Global Market Value (US$ Million) Analysis by Region, 2019 to 2034

Figure 8: Global Market Volume (MT) Analysis by Region, 2019 to 2034

Figure 9: Global Market Value Share (%) and BPS Analysis by Region, 2019 to 2034

Figure 10: Global Market Y-o-Y Growth (%) Projections by Region, 2019 to 2034

Figure 11: Global Market Value (US$ Million) Analysis by Product Type, 2019 to 2034

Figure 12: Global Market Volume (MT) Analysis by Product Type, 2019 to 2034

Figure 13: Global Market Value Share (%) and BPS Analysis by Product Type, 2019 to 2034

Figure 14: Global Market Y-o-Y Growth (%) Projections by Product Type, 2019 to 2034

Figure 15: Global Market Value (US$ Million) Analysis by Nature, 2019 to 2034

Figure 16: Global Market Volume (MT) Analysis by Nature, 2019 to 2034

Figure 17: Global Market Value Share (%) and BPS Analysis by Nature, 2019 to 2034

Figure 18: Global Market Y-o-Y Growth (%) Projections by Nature, 2019 to 2034

Figure 19: Global Market Value (US$ Million) Analysis by Form, 2019 to 2034

Figure 20: Global Market Volume (MT) Analysis by Form, 2019 to 2034

Figure 21: Global Market Value Share (%) and BPS Analysis by Form, 2019 to 2034

Figure 22: Global Market Y-o-Y Growth (%) Projections by Form, 2019 to 2034

Figure 23: Global Market Value (US$ Million) Analysis by End Use Application, 2019 to 2034

Figure 24: Global Market Volume (MT) Analysis by End Use Application, 2019 to 2034

Figure 25: Global Market Value Share (%) and BPS Analysis by End Use Application, 2019 to 2034

Figure 26: Global Market Y-o-Y Growth (%) Projections by End Use Application, 2019 to 2034

Figure 27: Global Market Value (US$ Million) Analysis by Retail, 2019 to 2034

Figure 28: Global Market Volume (MT) Analysis by Retail, 2019 to 2034

Figure 29: Global Market Value Share (%) and BPS Analysis by Retail, 2019 to 2034

Figure 30: Global Market Y-o-Y Growth (%) Projections by Retail, 2019 to 2034

Figure 31: Global Market Attractiveness by Product Type, 2019 to 2034

Figure 32: Global Market Attractiveness by Nature, 2019 to 2034

Figure 33: Global Market Attractiveness by Form, 2019 to 2034

Figure 34: Global Market Attractiveness by End Use Application, 2019 to 2034

Figure 35: Global Market Attractiveness by Retail, 2019 to 2034

Figure 36: Global Market Attractiveness by Region, 2019 to 2034

Figure 37: North America Market Value (US$ Million) by Product Type, 2019 to 2034

Figure 38: North America Market Value (US$ Million) by Nature, 2019 to 2034

Figure 39: North America Market Value (US$ Million) by Form, 2019 to 2034

Figure 40: North America Market Value (US$ Million) by End Use Application, 2019 to 2034

Figure 41: North America Market Value (US$ Million) by Retail, 2019 to 2034

Figure 42: North America Market Value (US$ Million) by Country, 2019 to 2034

Figure 43: North America Market Value (US$ Million) Analysis by Country, 2019 to 2034

Figure 44: North America Market Volume (MT) Analysis by Country, 2019 to 2034

Figure 45: North America Market Value Share (%) and BPS Analysis by Country, 2019 to 2034

Figure 46: North America Market Y-o-Y Growth (%) Projections by Country, 2019 to 2034

Figure 47: North America Market Value (US$ Million) Analysis by Product Type, 2019 to 2034

Figure 48: North America Market Volume (MT) Analysis by Product Type, 2019 to 2034

Figure 49: North America Market Value Share (%) and BPS Analysis by Product Type, 2019 to 2034

Figure 50: North America Market Y-o-Y Growth (%) Projections by Product Type, 2019 to 2034

Figure 51: North America Market Value (US$ Million) Analysis by Nature, 2019 to 2034

Figure 52: North America Market Volume (MT) Analysis by Nature, 2019 to 2034

Figure 53: North America Market Value Share (%) and BPS Analysis by Nature, 2019 to 2034

Figure 54: North America Market Y-o-Y Growth (%) Projections by Nature, 2019 to 2034

Figure 55: North America Market Value (US$ Million) Analysis by Form, 2019 to 2034

Figure 56: North America Market Volume (MT) Analysis by Form, 2019 to 2034

Figure 57: North America Market Value Share (%) and BPS Analysis by Form, 2019 to 2034

Figure 58: North America Market Y-o-Y Growth (%) Projections by Form, 2019 to 2034

Figure 59: North America Market Value (US$ Million) Analysis by End Use Application, 2019 to 2034

Figure 60: North America Market Volume (MT) Analysis by End Use Application, 2019 to 2034

Figure 61: North America Market Value Share (%) and BPS Analysis by End Use Application, 2019 to 2034

Figure 62: North America Market Y-o-Y Growth (%) Projections by End Use Application, 2019 to 2034

Figure 63: North America Market Value (US$ Million) Analysis by Retail, 2019 to 2034

Figure 64: North America Market Volume (MT) Analysis by Retail, 2019 to 2034

Figure 65: North America Market Value Share (%) and BPS Analysis by Retail, 2019 to 2034

Figure 66: North America Market Y-o-Y Growth (%) Projections by Retail, 2019 to 2034

Figure 67: North America Market Attractiveness by Product Type, 2019 to 2034

Figure 68: North America Market Attractiveness by Nature, 2019 to 2034

Figure 69: North America Market Attractiveness by Form, 2019 to 2034

Figure 70: North America Market Attractiveness by End Use Application, 2019 to 2034

Figure 71: North America Market Attractiveness by Retail, 2019 to 2034

Figure 72: North America Market Attractiveness by Country, 2019 to 2034

Figure 73: Latin America Market Value (US$ Million) by Product Type, 2019 to 2034

Figure 74: Latin America Market Value (US$ Million) by Nature, 2019 to 2034

Figure 75: Latin America Market Value (US$ Million) by Form, 2019 to 2034

Figure 76: Latin America Market Value (US$ Million) by End Use Application, 2019 to 2034

Figure 77: Latin America Market Value (US$ Million) by Retail, 2019 to 2034

Figure 78: Latin America Market Value (US$ Million) by Country, 2019 to 2034

Figure 79: Latin America Market Value (US$ Million) Analysis by Country, 2019 to 2034

Figure 80: Latin America Market Volume (MT) Analysis by Country, 2019 to 2034

Figure 81: Latin America Market Value Share (%) and BPS Analysis by Country, 2019 to 2034

Figure 82: Latin America Market Y-o-Y Growth (%) Projections by Country, 2019 to 2034

Figure 83: Latin America Market Value (US$ Million) Analysis by Product Type, 2019 to 2034

Figure 84: Latin America Market Volume (MT) Analysis by Product Type, 2019 to 2034

Figure 85: Latin America Market Value Share (%) and BPS Analysis by Product Type, 2019 to 2034

Figure 86: Latin America Market Y-o-Y Growth (%) Projections by Product Type, 2019 to 2034

Figure 87: Latin America Market Value (US$ Million) Analysis by Nature, 2019 to 2034

Figure 88: Latin America Market Volume (MT) Analysis by Nature, 2019 to 2034

Figure 89: Latin America Market Value Share (%) and BPS Analysis by Nature, 2019 to 2034

Figure 90: Latin America Market Y-o-Y Growth (%) Projections by Nature, 2019 to 2034

Figure 91: Latin America Market Value (US$ Million) Analysis by Form, 2019 to 2034

Figure 92: Latin America Market Volume (MT) Analysis by Form, 2019 to 2034

Figure 93: Latin America Market Value Share (%) and BPS Analysis by Form, 2019 to 2034

Figure 94: Latin America Market Y-o-Y Growth (%) Projections by Form, 2019 to 2034

Figure 95: Latin America Market Value (US$ Million) Analysis by End Use Application, 2019 to 2034

Figure 96: Latin America Market Volume (MT) Analysis by End Use Application, 2019 to 2034

Figure 97: Latin America Market Value Share (%) and BPS Analysis by End Use Application, 2019 to 2034

Figure 98: Latin America Market Y-o-Y Growth (%) Projections by End Use Application, 2019 to 2034

Figure 99: Latin America Market Value (US$ Million) Analysis by Retail, 2019 to 2034

Figure 100: Latin America Market Volume (MT) Analysis by Retail, 2019 to 2034

Figure 101: Latin America Market Value Share (%) and BPS Analysis by Retail, 2019 to 2034

Figure 102: Latin America Market Y-o-Y Growth (%) Projections by Retail, 2019 to 2034

Figure 103: Latin America Market Attractiveness by Product Type, 2019 to 2034

Figure 104: Latin America Market Attractiveness by Nature, 2019 to 2034

Figure 105: Latin America Market Attractiveness by Form, 2019 to 2034

Figure 106: Latin America Market Attractiveness by End Use Application, 2019 to 2034

Figure 107: Latin America Market Attractiveness by Retail, 2019 to 2034

Figure 108: Latin America Market Attractiveness by Country, 2019 to 2034

Figure 109: Europe Market Value (US$ Million) by Product Type, 2019 to 2034

Figure 110: Europe Market Value (US$ Million) by Nature, 2019 to 2034

Figure 111: Europe Market Value (US$ Million) by Form, 2019 to 2034

Figure 112: Europe Market Value (US$ Million) by End Use Application, 2019 to 2034

Figure 113: Europe Market Value (US$ Million) by Retail, 2019 to 2034

Figure 114: Europe Market Value (US$ Million) by Country, 2019 to 2034

Figure 115: Europe Market Value (US$ Million) Analysis by Country, 2019 to 2034

Figure 116: Europe Market Volume (MT) Analysis by Country, 2019 to 2034

Figure 117: Europe Market Value Share (%) and BPS Analysis by Country, 2019 to 2034

Figure 118: Europe Market Y-o-Y Growth (%) Projections by Country, 2019 to 2034

Figure 119: Europe Market Value (US$ Million) Analysis by Product Type, 2019 to 2034

Figure 120: Europe Market Volume (MT) Analysis by Product Type, 2019 to 2034

Figure 121: Europe Market Value Share (%) and BPS Analysis by Product Type, 2019 to 2034

Figure 122: Europe Market Y-o-Y Growth (%) Projections by Product Type, 2019 to 2034

Figure 123: Europe Market Value (US$ Million) Analysis by Nature, 2019 to 2034

Figure 124: Europe Market Volume (MT) Analysis by Nature, 2019 to 2034

Figure 125: Europe Market Value Share (%) and BPS Analysis by Nature, 2019 to 2034

Figure 126: Europe Market Y-o-Y Growth (%) Projections by Nature, 2019 to 2034

Figure 127: Europe Market Value (US$ Million) Analysis by Form, 2019 to 2034

Figure 128: Europe Market Volume (MT) Analysis by Form, 2019 to 2034

Figure 129: Europe Market Value Share (%) and BPS Analysis by Form, 2019 to 2034

Figure 130: Europe Market Y-o-Y Growth (%) Projections by Form, 2019 to 2034

Figure 131: Europe Market Value (US$ Million) Analysis by End Use Application, 2019 to 2034

Figure 132: Europe Market Volume (MT) Analysis by End Use Application, 2019 to 2034

Figure 133: Europe Market Value Share (%) and BPS Analysis by End Use Application, 2019 to 2034

Figure 134: Europe Market Y-o-Y Growth (%) Projections by End Use Application, 2019 to 2034

Figure 135: Europe Market Value (US$ Million) Analysis by Retail, 2019 to 2034

Figure 136: Europe Market Volume (MT) Analysis by Retail, 2019 to 2034

Figure 137: Europe Market Value Share (%) and BPS Analysis by Retail, 2019 to 2034

Figure 138: Europe Market Y-o-Y Growth (%) Projections by Retail, 2019 to 2034

Figure 139: Europe Market Attractiveness by Product Type, 2019 to 2034

Figure 140: Europe Market Attractiveness by Nature, 2019 to 2034

Figure 141: Europe Market Attractiveness by Form, 2019 to 2034

Figure 142: Europe Market Attractiveness by End Use Application, 2019 to 2034

Figure 143: Europe Market Attractiveness by Retail, 2019 to 2034

Figure 144: Europe Market Attractiveness by Country, 2019 to 2034

Figure 145: East Asia Market Value (US$ Million) by Product Type, 2019 to 2034

Figure 146: East Asia Market Value (US$ Million) by Nature, 2019 to 2034

Figure 147: East Asia Market Value (US$ Million) by Form, 2019 to 2034

Figure 148: East Asia Market Value (US$ Million) by End Use Application, 2019 to 2034

Figure 149: East Asia Market Value (US$ Million) by Retail, 2019 to 2034

Figure 150: East Asia Market Value (US$ Million) by Country, 2019 to 2034

Figure 151: East Asia Market Value (US$ Million) Analysis by Country, 2019 to 2034

Figure 152: East Asia Market Volume (MT) Analysis by Country, 2019 to 2034

Figure 153: East Asia Market Value Share (%) and BPS Analysis by Country, 2019 to 2034

Figure 154: East Asia Market Y-o-Y Growth (%) Projections by Country, 2019 to 2034

Figure 155: East Asia Market Value (US$ Million) Analysis by Product Type, 2019 to 2034

Figure 156: East Asia Market Volume (MT) Analysis by Product Type, 2019 to 2034

Figure 157: East Asia Market Value Share (%) and BPS Analysis by Product Type, 2019 to 2034

Figure 158: East Asia Market Y-o-Y Growth (%) Projections by Product Type, 2019 to 2034

Figure 159: East Asia Market Value (US$ Million) Analysis by Nature, 2019 to 2034

Figure 160: East Asia Market Volume (MT) Analysis by Nature, 2019 to 2034

Figure 161: East Asia Market Value Share (%) and BPS Analysis by Nature, 2019 to 2034

Figure 162: East Asia Market Y-o-Y Growth (%) Projections by Nature, 2019 to 2034

Figure 163: East Asia Market Value (US$ Million) Analysis by Form, 2019 to 2034

Figure 164: East Asia Market Volume (MT) Analysis by Form, 2019 to 2034

Figure 165: East Asia Market Value Share (%) and BPS Analysis by Form, 2019 to 2034

Figure 166: East Asia Market Y-o-Y Growth (%) Projections by Form, 2019 to 2034

Figure 167: East Asia Market Value (US$ Million) Analysis by End Use Application, 2019 to 2034

Figure 168: East Asia Market Volume (MT) Analysis by End Use Application, 2019 to 2034

Figure 169: East Asia Market Value Share (%) and BPS Analysis by End Use Application, 2019 to 2034

Figure 170: East Asia Market Y-o-Y Growth (%) Projections by End Use Application, 2019 to 2034

Figure 171: East Asia Market Value (US$ Million) Analysis by Retail, 2019 to 2034

Figure 172: East Asia Market Volume (MT) Analysis by Retail, 2019 to 2034

Figure 173: East Asia Market Value Share (%) and BPS Analysis by Retail, 2019 to 2034

Figure 174: East Asia Market Y-o-Y Growth (%) Projections by Retail, 2019 to 2034

Figure 175: East Asia Market Attractiveness by Product Type, 2019 to 2034

Figure 176: East Asia Market Attractiveness by Nature, 2019 to 2034

Figure 177: East Asia Market Attractiveness by Form, 2019 to 2034

Figure 178: East Asia Market Attractiveness by End Use Application, 2019 to 2034

Figure 179: East Asia Market Attractiveness by Retail, 2019 to 2034

Figure 180: East Asia Market Attractiveness by Country, 2019 to 2034

Figure 181: South Asia Market Value (US$ Million) by Product Type, 2019 to 2034

Figure 182: South Asia Market Value (US$ Million) by Nature, 2019 to 2034

Figure 183: South Asia Market Value (US$ Million) by Form, 2019 to 2034

Figure 184: South Asia Market Value (US$ Million) by End Use Application, 2019 to 2034

Figure 185: South Asia Market Value (US$ Million) by Retail, 2019 to 2034

Figure 186: South Asia Market Value (US$ Million) by Country, 2019 to 2034

Figure 187: South Asia Market Value (US$ Million) Analysis by Country, 2019 to 2034

Figure 188: South Asia Market Volume (MT) Analysis by Country, 2019 to 2034

Figure 189: South Asia Market Value Share (%) and BPS Analysis by Country, 2019 to 2034

Figure 190: South Asia Market Y-o-Y Growth (%) Projections by Country, 2019 to 2034

Figure 191: South Asia Market Value (US$ Million) Analysis by Product Type, 2019 to 2034

Figure 192: South Asia Market Volume (MT) Analysis by Product Type, 2019 to 2034

Figure 193: South Asia Market Value Share (%) and BPS Analysis by Product Type, 2019 to 2034

Figure 194: South Asia Market Y-o-Y Growth (%) Projections by Product Type, 2019 to 2034

Figure 195: South Asia Market Value (US$ Million) Analysis by Nature, 2019 to 2034

Figure 196: South Asia Market Volume (MT) Analysis by Nature, 2019 to 2034

Figure 197: South Asia Market Value Share (%) and BPS Analysis by Nature, 2019 to 2034

Figure 198: South Asia Market Y-o-Y Growth (%) Projections by Nature, 2019 to 2034

Figure 199: South Asia Market Value (US$ Million) Analysis by Form, 2019 to 2034

Figure 200: South Asia Market Volume (MT) Analysis by Form, 2019 to 2034

Figure 201: South Asia Market Value Share (%) and BPS Analysis by Form, 2019 to 2034

Figure 202: South Asia Market Y-o-Y Growth (%) Projections by Form, 2019 to 2034

Figure 203: South Asia Market Value (US$ Million) Analysis by End Use Application, 2019 to 2034

Figure 204: South Asia Market Volume (MT) Analysis by End Use Application, 2019 to 2034

Figure 205: South Asia Market Value Share (%) and BPS Analysis by End Use Application, 2019 to 2034

Figure 206: South Asia Market Y-o-Y Growth (%) Projections by End Use Application, 2019 to 2034

Figure 207: South Asia Market Value (US$ Million) Analysis by Retail, 2019 to 2034

Figure 208: South Asia Market Volume (MT) Analysis by Retail, 2019 to 2034

Figure 209: South Asia Market Value Share (%) and BPS Analysis by Retail, 2019 to 2034

Figure 210: South Asia Market Y-o-Y Growth (%) Projections by Retail, 2019 to 2034

Figure 211: South Asia Market Attractiveness by Product Type, 2019 to 2034

Figure 212: South Asia Market Attractiveness by Nature, 2019 to 2034

Figure 213: South Asia Market Attractiveness by Form, 2019 to 2034

Figure 214: South Asia Market Attractiveness by End Use Application, 2019 to 2034

Figure 215: South Asia Market Attractiveness by Retail, 2019 to 2034

Figure 216: South Asia Market Attractiveness by Country, 2019 to 2034

Figure 217: Oceania Market Value (US$ Million) by Product Type, 2019 to 2034

Figure 218: Oceania Market Value (US$ Million) by Nature, 2019 to 2034

Figure 219: Oceania Market Value (US$ Million) by Form, 2019 to 2034

Figure 220: Oceania Market Value (US$ Million) by End Use Application, 2019 to 2034

Figure 221: Oceania Market Value (US$ Million) by Retail, 2019 to 2034

Figure 222: Oceania Market Value (US$ Million) by Country, 2019 to 2034

Figure 223: Oceania Market Value (US$ Million) Analysis by Country, 2019 to 2034

Figure 224: Oceania Market Volume (MT) Analysis by Country, 2019 to 2034

Figure 225: Oceania Market Value Share (%) and BPS Analysis by Country, 2019 to 2034

Figure 226: Oceania Market Y-o-Y Growth (%) Projections by Country, 2019 to 2034

Figure 227: Oceania Market Value (US$ Million) Analysis by Product Type, 2019 to 2034

Figure 228: Oceania Market Volume (MT) Analysis by Product Type, 2019 to 2034

Figure 229: Oceania Market Value Share (%) and BPS Analysis by Product Type, 2019 to 2034

Figure 230: Oceania Market Y-o-Y Growth (%) Projections by Product Type, 2019 to 2034

Figure 231: Oceania Market Value (US$ Million) Analysis by Nature, 2019 to 2034

Figure 232: Oceania Market Volume (MT) Analysis by Nature, 2019 to 2034

Figure 233: Oceania Market Value Share (%) and BPS Analysis by Nature, 2019 to 2034

Figure 234: Oceania Market Y-o-Y Growth (%) Projections by Nature, 2019 to 2034

Figure 235: Oceania Market Value (US$ Million) Analysis by Form, 2019 to 2034

Figure 236: Oceania Market Volume (MT) Analysis by Form, 2019 to 2034

Figure 237: Oceania Market Value Share (%) and BPS Analysis by Form, 2019 to 2034

Figure 238: Oceania Market Y-o-Y Growth (%) Projections by Form, 2019 to 2034

Figure 239: Oceania Market Value (US$ Million) Analysis by End Use Application, 2019 to 2034

Figure 240: Oceania Market Volume (MT) Analysis by End Use Application, 2019 to 2034

Figure 241: Oceania Market Value Share (%) and BPS Analysis by End Use Application, 2019 to 2034

Figure 242: Oceania Market Y-o-Y Growth (%) Projections by End Use Application, 2019 to 2034

Figure 243: Oceania Market Value (US$ Million) Analysis by Retail, 2019 to 2034

Figure 244: Oceania Market Volume (MT) Analysis by Retail, 2019 to 2034

Figure 245: Oceania Market Value Share (%) and BPS Analysis by Retail, 2019 to 2034

Figure 246: Oceania Market Y-o-Y Growth (%) Projections by Retail, 2019 to 2034

Figure 247: Oceania Market Attractiveness by Product Type, 2019 to 2034

Figure 248: Oceania Market Attractiveness by Nature, 2019 to 2034

Figure 249: Oceania Market Attractiveness by Form, 2019 to 2034

Figure 250: Oceania Market Attractiveness by End Use Application, 2019 to 2034

Figure 251: Oceania Market Attractiveness by Retail, 2019 to 2034

Figure 252: Oceania Market Attractiveness by Country, 2019 to 2034

Figure 253: MEA Market Value (US$ Million) by Product Type, 2019 to 2034

Figure 254: MEA Market Value (US$ Million) by Nature, 2019 to 2034

Figure 255: MEA Market Value (US$ Million) by Form, 2019 to 2034

Figure 256: MEA Market Value (US$ Million) by End Use Application, 2019 to 2034

Figure 257: MEA Market Value (US$ Million) by Retail, 2019 to 2034

Figure 258: MEA Market Value (US$ Million) by Country, 2019 to 2034

Figure 259: MEA Market Value (US$ Million) Analysis by Country, 2019 to 2034

Figure 260: MEA Market Volume (MT) Analysis by Country, 2019 to 2034

Figure 261: MEA Market Value Share (%) and BPS Analysis by Country, 2019 to 2034

Figure 262: MEA Market Y-o-Y Growth (%) Projections by Country, 2019 to 2034

Figure 263: MEA Market Value (US$ Million) Analysis by Product Type, 2019 to 2034

Figure 264: MEA Market Volume (MT) Analysis by Product Type, 2019 to 2034

Figure 265: MEA Market Value Share (%) and BPS Analysis by Product Type, 2019 to 2034

Figure 266: MEA Market Y-o-Y Growth (%) Projections by Product Type, 2019 to 2034

Figure 267: MEA Market Value (US$ Million) Analysis by Nature, 2019 to 2034

Figure 268: MEA Market Volume (MT) Analysis by Nature, 2019 to 2034

Figure 269: MEA Market Value Share (%) and BPS Analysis by Nature, 2019 to 2034

Figure 270: MEA Market Y-o-Y Growth (%) Projections by Nature, 2019 to 2034

Figure 271: MEA Market Value (US$ Million) Analysis by Form, 2019 to 2034

Figure 272: MEA Market Volume (MT) Analysis by Form, 2019 to 2034

Figure 273: MEA Market Value Share (%) and BPS Analysis by Form, 2019 to 2034

Figure 274: MEA Market Y-o-Y Growth (%) Projections by Form, 2019 to 2034

Figure 275: MEA Market Value (US$ Million) Analysis by End Use Application, 2019 to 2034

Figure 276: MEA Market Volume (MT) Analysis by End Use Application, 2019 to 2034

Figure 277: MEA Market Value Share (%) and BPS Analysis by End Use Application, 2019 to 2034

Figure 278: MEA Market Y-o-Y Growth (%) Projections by End Use Application, 2019 to 2034

Figure 279: MEA Market Value (US$ Million) Analysis by Retail, 2019 to 2034

Figure 280: MEA Market Volume (MT) Analysis by Retail, 2019 to 2034

Figure 281: MEA Market Value Share (%) and BPS Analysis by Retail, 2019 to 2034

Figure 282: MEA Market Y-o-Y Growth (%) Projections by Retail, 2019 to 2034

Figure 283: MEA Market Attractiveness by Product Type, 2019 to 2034

Figure 284: MEA Market Attractiveness by Nature, 2019 to 2034

Figure 285: MEA Market Attractiveness by Form, 2019 to 2034

Figure 286: MEA Market Attractiveness by End Use Application, 2019 to 2034

Figure 287: MEA Market Attractiveness by Retail, 2019 to 2034

Figure 288: MEA Market Attractiveness by Country, 2019 to 2034

Frequently Asked Questions

At What Rate is the Meat Alternative Market Expected to Grow?

the meat alternative market is expected to grow at a CAGR of 28.8% through 2034.

What is the Expected Valuation of the Meat Alternative Market by 2034?

By 2034, the meat alternative market is expected to be worth USD 299 billion.

What are the Key Factors Driving the Meat Alternative Market?

Shift in people’s lifestyle to a vegan and/or vegetarian diet with low-fat and protein-rich ingredients.

Which Regions Dominates the Meat Alternative Market?

North America and Europe have lucrative growth opportunities, holding notable market shares.

Which Product Type is Likely to Contribute to the Market’s Growth?

The patties segment is predicted to dominate the market by product type.

Explore Similar Insights

Future Market Insights

Meat Alternative Market