Meat Processing Equipment Market Outlook (2023 to 2033)

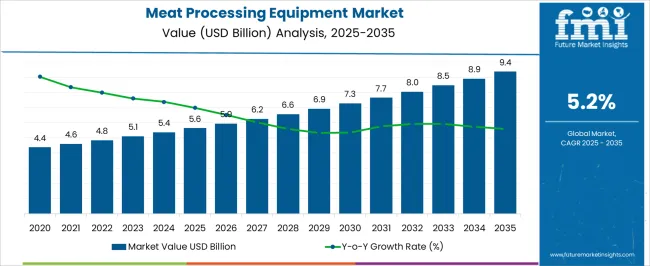
During the projected period (2023 to 2033), the global meat processing equipment market is expected to grow at a CAGR of 5.2%. The meat processing equipment market is projected to be valued at US$ 8,467.0 Million by 2033 and is likely to reach US$ 5,100.0 Million in 2023.

Changing customer preferences and way of life are expected to push demand in the global meat processing equipment market. The market is also expanding due to the increasing need for packaged food and processed meat products, as well as rising consumer demand for high food safety.

Based on the unique needs of customers, meat processing equipment is being developed by key manufacturers. These tools are employed to reduce toxins and improve meat consistency. The prevalence of meat-based cultures in many nations continues to increase the demand for meat-processing machinery.

The need for processed meat with a long shelf life and high durability has surged as a result of the increased trade in the field of meat, and this trend is projected to support the meat processing equipment market in the next ten years. However, it is projected that high machine costs may obstruct growth in the forecast period.

Also, the premiumization of meat products, especially in developed countries is expected to propel the global market in the evaluation period. Many start-up firms in emerging economies like India and China are coming up with unique meat products to expand their client base.

In July 2023, for instance, Selina, a renowned experiential hospitality brand, announced its collaboration with the global pioneer of New Meat, Redefine Meat. The partnership is aimed at shifting menus to more plant-based options.

Similarly, in October 2023, Pescafresh, a D2C fresh seafood and meat brand, developed a new distribution hub and processing facility in Mumbai, India for its meats, seafood, eggs, ready-to-eat (RTE), and ready-to-cook (RTC) processing operations.

Increasing demand for plant-based meat owing to the rapid adoption of veganism in both developed and developing countries are expected to foster sales of meat processing equipment in the next ten years. Licious, in October 2023, entered the plant-based meat segment in India by unveiling UnCrave, its first portfolio brand. It contains protein-rich vegetarian seekh kebabs. The ready-to-cook products are free of monosodium glutamate (MSG), trans fat, and artificial preservatives.

In December 2021, ITC Ltd. declared that it will soon introduce a range of plant-based meat products in anticipation of the surging demand for vegan meals and meat substitutes in India. The company also aims to launch these products by keeping in mind rising consumer awareness about the environment, animal welfare, and health.

Attributes Key Insights
Global Meat Processing Equipment Market Estimated Size (2023E) US$ 5,100.0 Million
Projected Market Valuation (2033F) US$ 8,467.0 Million
Value-based CAGR (2023 to 2033) 5.2%

Don't pay for what you don't need

Customize your report by selecting specific countries or regions and save 30%!

2017 to 2021 Global Meat Processing Equipment Market Outlook Compared to 2023 to 2033 Demand Forecast

As per FMI, the global meat processing equipment market exhibited considerable growth at a CAGR of 4.3% in the historical period from 2017 to 2021. Rising food security concerns are anticipated to push growth in the global market. High disposable income, rapid urbanization, and the busy lifestyles of consumers have positively influenced sales of processed meats.

This, combined with the rising premiumization of meat items and expanding purchaser admittance to coordinated retail locations like grocery stores, is fortifying the market development. Besides, key players are significantly putting their resources into the development of new processing technologies. They are also aiming to automate meat processing hardware solutions with an inbuilt sensor framework to hold a strategic advantage in the business.

They are likewise engaging in essential acquisitions and mergers for expanding their production volume and broadening their distribution channels. Apart from that, increasing demand for protein-rich food items like meat with rising awareness about the benefits of consuming such food items is expected to boost the global meat processing equipment market in the assessment period.
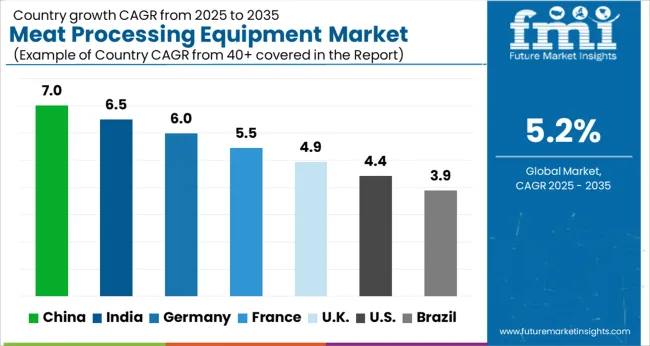
Country-wise Insights

How are Meat Processing Equipment Companies Faring in the USA?

Meat Processors like Tyson Foods are Investing in Advanced Meat Cutting Machines in the USA
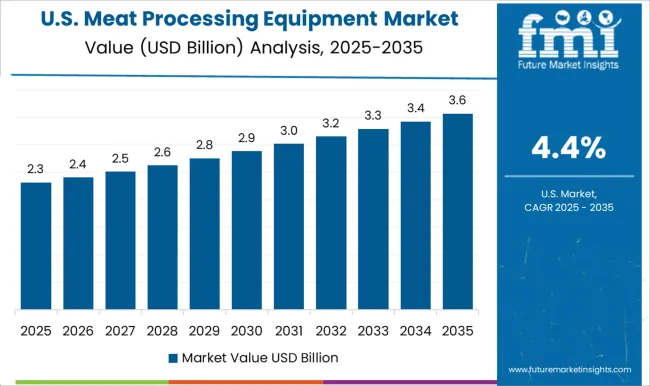
The meat processing equipment market in the USA is set to exhibit growth at a CAGR of 68% during the forecast period, says FMI. Increasing investments by key meat processing companies in automating their facilities and burgeoning demand for processed meat are expected to drive the USA market. Besides, the presence of various reputed meat processing companies such as JBS USA, Tyson Foods, and Cargill Meat Solutions Corp. is another vital factor that would push the USA market.

What are the Strategies Adopted by Meat Processing Equipment Firms in the UK?

High Production of Beef in the UK to Push the Demand for Slaughtering Machines

The UK meat processing equipment market is projected to showcase steady growth throughout the forecast period, finds FMI. As to the UK Government, veal and beef production was 74,000 tons, which is 1.2% higher than that in May 2020. Also, prime cattle (young bulls, heifers, and steers) slaughtering were down 2.0% at 165,000 head in May 2021. These numbers are projected to grow at a fast pace in the next ten years, thereby augmenting sales of meat processing equipment in the UK

Why is the Demand for Meat Processing Equipment Surging in India?

High Demand for Ready-to-eat Food in India to Drive Sales of Butcher Equipment

In India, the adoption of meat processing equipment is anticipated to surge owing to rising demand for ready-to-eat food products, stable economic growth, and changing lifestyles of consumers. The Indian government is also expected to put forward favorable norms to support the manufacturing of processed food items, which is expected to push the trade of processed meat.

Vee Tech International, Cactus Profiles Pvt. Ltd, Dr. Froeb Pvt. Ltd, JD Engineering, ATS Food Equipment India Pvt. Ltd, Bresco India, BSA India Food Ingredients Pvt. Ltd, A.S. Engineers, Sunniva Engineering, Chishtiya Poultry Services, Marine Industrial Machines, Deepak Engineers, and Vinod Industries are some of the leading companies in the India meat processing equipment market in India.

Nandini Roy Choudhury

Principal Consultant

Talk to Analyst

Find your sweet spots for generating winning opportunities in this market.

Category-wise Insights

Which is the Most Preferred Type of Meat Processing Equipment?

Meat Grinding Equipment to Showcase Lucrative Growth by the End of 2033

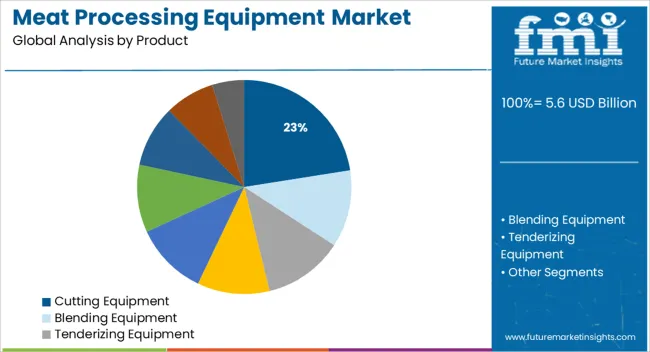
Based on product type, the grinding equipment segment is anticipated to remain at the forefront in terms of share in the global meat processing equipment market. Grinding equipment is mainly used to grind large pieces of tenderized meat into smaller pieces. Some of the commonly used grinders are utilized to separate connective tissues and bone pieces such as tendons from the muscle meat. Increasing the use of grinding equipment for processing various products such as hamburgers, sausages, and minced meat is expected to drive the segment.

Competitive Landscape

The global meat processing equipment market is highly fragmented and competitive due to the presence of several local and regional companies. Key players are adopting a wide range of marketing strategies such as partnerships, expansions, mergers & acquisitions, and collaborations.

Some of the leading companies operating in the meat processing equipment market are GEA Group, BT Corporation, Marel, Illinois Tools Work, The Middleby Corporation, Bettcher Industries, Equipamientos Carnicos, Biro Manufacturing Company, Braher, RZPO, Bizerba, Riopel Industries, Minerva Omega Group, Risco, Millard Manufacturing Corporation, Apache Stainless Equipment Corporation, Gee Gee Foods & Packaging, PSS Svidnik, Ross Industries Inc., and Metalbud Nowicki among others.

Don’t Be a Jerky Manufacturer: Go for The Best Meat Processing Equipment from Duravant, Prime Equipment Group, And BAADER

The meat processing equipment industry is booming. As more people are interested in healthy living, more companies are turning to meat processing equipment for their benefit. Not only do these machines save food from going to waste, but they also provide a healthier option for consumers. Companies like Duravant, Prime Equipment Group, and BADDER provide superior meat processing equipment to meet end-user needs.

Duravant is a global producer and manufacturer of engineered equipment for the food processing, packaging, and material handling sectors. The business is divided into three divisions: food processing, packaging machinery, and material handling.

Duravant's Food Processing sector goods are mostly utilized in the processing of pig, beef, and poultry products for large food corporations and are classified into three key categories: pumps, fillers/dicers, and heat equipment.

The Packaging Machinery segment's product line includes components and systems for filling, closing, weighing, and handling open-mouth bags. The business operates internationally under the Fischbein brand name, offering a variety of products ranging from manual to semi-automated to fully automated equipment. These items are used in a wide range of end-use sectors, including agriculture, food, pet food, chemicals, and construction materials.

In April 2021, Duravant LLC announced the signing of a definitive agreement to acquire Foodmate, a leading manufacturer of poultry processing equipment with offices in Ball Ground, Georgia, and Numansdorp, the Netherlands. Foodmate's automated secondary processing systems for chicken are widely regarded as the industry's gold standard.

Another leading player, Prime Equipment Group, Inc. is a poultry processing equipment manufacturer established in the USA that has won the industry's confidence for more than two decades by providing creative, dependable, and hard-working solutions for practically every point on the contemporary processing line.

In June 2019, JBT Corporation, a global technology solutions supplier to high-value areas of the food and beverage industry, announced the completion of its purchase of Prime Equipment Group, Inc.

BAADER Group is a globally recognized producer and provider of high-quality food processing machinery and solutions for the fish, poultry, meat, fruit, and vegetable processing industries. From the handling of live and raw protein sources to the completed food products, the firm designs and engineers unique and holistic solutions that provide intelligent, safe, efficient, and sustainable food processing in all phases.

In April 2021, BAADER announced the introduction of the new BAADER 608 machine, which is the most powerful and biggest member of the BAADERING technology machine family. This machine is the most innovative and sanitary of its kind due to its upgraded design. It establishes new norms for food quality, value generation, process dependability, and user-friendliness.

Get the data you need at a Fraction of the cost

Personalize your report by choosing insights you need
and save 40%!

Scope of the Meat Processing Equipment Market Report

Attribute Details
Estimated Market Size (2023) US$ 5,100.0 Million
Projected Market Valuation (2033) US$ 8,467.0 Million
Value-based CAGR (2023 to 2033) 5.2%
Forecast Period 2023 to 2033
Historical Data Available for 2017 to 2021
Market Analysis Value (US$ Million)
Key Regions Covered North America; Latin America; Europe; Asia Pacific; Oceania; Middle East and Africa (MEA)
Key Countries Covered USA, Canada, Mexico, Germany, UK, France, Italy, Spain, China, Japan, India, South Korea, Australia, Brazil, Argentina, South Africa, UAE
Key Segments Covered Product Type, Application, Automation, Meat Type, Region
Key Companies Profiled Duravant; Prime Equipment Group, Inc.; BAADER; BANSS; Stephan Machinery GmbH; GEA Group; BT Corporation; Marel; Illinois Tools Work; The Middleby Corporation; Bettcher Industries; Equipamientos Carnicos; Biro Manufacturing Company; Braher; RZPO; Bizerba; Riopel Industries; Minerva Omega Group; Risco; Millard Manufacturing Corporation; Apache Stainless Equipment Corporation; Gee Foods & Packaging; PSS Svidnik; Ross Industries Inc; Metalbud Nowicki
Report Coverage Market Forecast, Company Share Analysis, Competitive Landscape, Drivers, Restraints, Opportunities and Threats Analysis, Market Dynamics and Challenges, and Strategic Growth Initiatives

Meat Processing Equipment Market Outlook by Category

By Product:

  • Cutting Equipment
  • Blending Equipment
  • Tenderizing Equipment
  • Filling Equipment
  • Slicing Equipment
  • Grinding Equipment
  • Smoking Equipment
  • Massaging Equipment
  • Other Types (Brine Injectors, Emulsifying Machines, and Ice Flakers)

By Application:

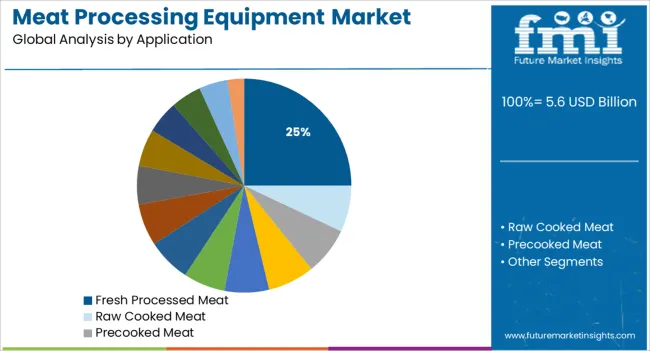
  • Fresh Processed Meat
  • Raw Cooked Meat
  • Precooked Meat
  • Raw Fermented Sausage
  • Cured Meat
  • Dried Meat
  • Catering
  • Meat Shop
  • Hotel
  • Restaurant
  • Meat Processing Unit
  • Poultry Industries
  • Further Processing
  • Other (Sun-Drying Meat, Mincing, and Grinding Meat)

By Meat Type:

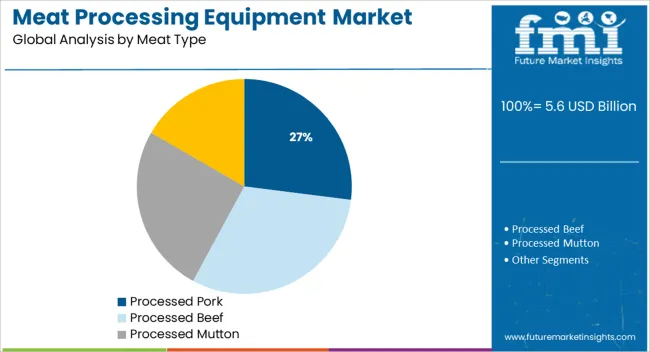
  • Processed Pork
  • Processed Beef
  • Processed Mutton
  • Others (Horses, rabbits, Camels, and Yak)

By Automation:

  • Automatic
  • Semi-Automatic

By Region:

  • North America
  • Latin America
  • Europe
  • East Asia
  • South Asia
  • Oceania
  • Middle East and Africa (MEA)

Frequently Asked Questions

How big is the global meat processing equipment market?

The meat processing equipment market size is expected to reach a valuation of US$ 5,100.0 Million by 2023.

At what rate is the global meat processing equipment market expected to rise?

The meat processing equipment market is expected to rise at a CAGR of 5.2% in the forecast period.

What is the North America meat processing equipment market outlook?

The North America meat processing equipment market is expected to register a 38% CAGR between 2023 and 2033.

Which are the major countries driving demand in the meat processing equipment market?

The USA, China, Canada, Germany, and Mexico are the major countries driving demand in the meat processing equipment market.

At what rate will the China meat processing equipment market grow?

The China meat processing equipment market is projected to grow at a CAGR of around 32% over the next ten years.

At what rate will the Europe meat processing equipment market grow?

The Europe meat processing equipment market is expected to grow at 40% CAGR between 2023 and 2033.

Who are the top 5 players operating in the meat processing equipment market?

Duravant, Prime Equipment Group, Inc., BAADER, BANSS, and Stephan Machinery GmbH are expected to be the top players driving the meat processing equipment market.

What is the demand outlook forecast for the meat processing equipment market?

The global meat processing equipment market is expected to surpass US$ 8,467.0 Million by the end of 2033.

Table of Content
1. Executive Summary | Meat Processing Equipment Market
    1.1. Global Market Outlook
    1.2. Demand-side Trends
    1.3. Supply-side Trends
    1.4. Technology Roadmap Analysis
    1.5. Analysis and Recommendations
2. Market Overview
    2.1. Market Coverage / Taxonomy
    2.2. Market Definition / Scope / Limitations
3. Market Background
    3.1. Market Dynamics
        3.1.1. Drivers
        3.1.2. Restraints
        3.1.3. Opportunity
        3.1.4. Trends
    3.2. Scenario Forecast
        3.2.1. Demand in Optimistic Scenario
        3.2.2. Demand in Likely Scenario
        3.2.3. Demand in Conservative Scenario
    3.3. Product launches & Recent Developments
    3.4. Product Life Cycle Analysis
    3.5. Value Chain Analysis
        3.5.1. Supply Side Participants and their Roles
            3.5.1.1. Producers
            3.5.1.2. Mid-Level Participants (Traders/ Agents/ Brokers)
            3.5.1.3. Wholesalers and Distributors
        3.5.2. % of Operating Margin Analysis
        3.5.3. List of Raw Material Suppliers
        3.5.4. List of Existing and Potential Buyers
    3.6. Global Market - Pricing Analysis
        3.6.1. Price Point Assessment by Region
        3.6.2. Price Point Assessment by Product Type
        3.6.3. Price Forecast till 2033
        3.6.4. Factors affecting pricing
    3.7. Forecast Factors - Relevance & Impact
    3.8. PESTLE and Porter’s Analysis
    3.9. Regulatory Landscape
        3.9.1. Packaging & Labelling Regulations
        3.9.2. Certifications and Certifying Agency Overview
        3.9.3. Import/Export Policies
    3.10. Regional Parent Market Outlook
    3.11. Production and Consumption Statistics
    3.12. Import and Export Statistics
    3.13. Consumers Survey Analysis
    3.14. Macro-Economic Factors
    3.15. Product Claims & Nutritional Information scanned by Buyers
4. Global Analysis 2018 to 2022 and Forecast, 2023 to 2033
    4.1. Historical Market Size Value (US$ Million) & Volume (MT) Analysis, 2018 to 2022
    4.2. Current and Future Market Size Value (US$ Million) & Volume (MT) Projections, 2023 to 2033
        4.2.1. Y-o-Y Growth Trend Analysis
        4.2.2. Absolute $ Opportunity Analysis
5. Global Analysis 2018 to 2022 and Forecast 2023 to 2033, By Product
    5.1. Introduction / Key Findings
    5.2. Historical Market Size Value (US$ Million) & Volume (MT) Analysis By Product, 2018 to 2022
    5.3. Current and Future Market Size Value (US$ Million) & Volume (MT) Analysis and Forecast By Product, 2023 to 2033
        5.3.1. Cutting Equipment
        5.3.2. Blending Equipment
        5.3.3. Tenderizing Equipment
        5.3.4. Filling Equipment
        5.3.5. Slicing Equipment
        5.3.6. Grinding Equipment
        5.3.7. Smoking Equipment
        5.3.8. Massaging Equipment
    5.4. Y-o-Y Growth Trend Analysis By Product, 2018 to 2022
    5.5. Absolute $ Opportunity Analysis By Product, 2023 to 2033
6. Global Analysis 2018 to 2022 and Forecast 2023 to 2033, By Application
    6.1. Introduction / Key Findings
    6.2. Historical Market Size Value (US$ Million) & Volume (MT) Analysis By Application, 2018 to 2022
    6.3. Current and Future Market Size Value (US$ Million) & Volume (MT) Analysis and Forecast By Application, 2023 to 2033
        6.3.1. Fresh Processed Meat
        6.3.2. Raw Cooked Meat
        6.3.3. Precooked Meat
        6.3.4. Raw Fermented Sausage
        6.3.5. Cured Meat
        6.3.6. Dried Meat
        6.3.7. Catering
        6.3.8. Meat Shop
        6.3.9. Hotel
        6.3.10. Restaurant
        6.3.11. Meat Processing Value (US$ Million) & Volume (MT)
        6.3.12. Poultry Industries
    6.4. Y-o-Y Growth Trend Analysis By Application, 2018 to 2022
    6.5. Absolute $ Opportunity Analysis By Application, 2023 to 2033
7. Global Analysis 2018 to 2022 and Forecast 2023 to 2033, By Meat type
    7.1. Introduction / Key Findings
    7.2. Historical Market Size Value (US$ Million) & Volume (MT) Analysis By Meat type, 2018 to 2022
    7.3. Current and Future Market Size Value (US$ Million) & Volume (MT) Analysis and Forecast By Meat type, 2023 to 2033
        7.3.1. Processed Pork
        7.3.2. Processed Beef
        7.3.3. Processed Mutton
    7.4. Y-o-Y Growth Trend Analysis By Meat type, 2018 to 2022
    7.5. Absolute $ Opportunity Analysis By Meat type, 2023 to 2033
8. Global Analysis 2018 to 2022 and Forecast 2023 to 2033, By Automation
    8.1. Introduction / Key Findings
    8.2. Historical Market Size Value (US$ Million) & Volume (MT) Analysis By Automation, 2018 to 2022
    8.3. Current and Future Market Size Value (US$ Million) & Volume (MT) Analysis and Forecast By Automation, 2023 to 2033
        8.3.1. Automatic
        8.3.2. Semi-Automatic
    8.4. Y-o-Y Growth Trend Analysis By Automation, 2018 to 2022
    8.5. Absolute $ Opportunity Analysis By Automation, 2023 to 2033
9. Global Analysis 2018 to 2022 and Forecast 2023 to 2033, By Region
    9.1. Introduction
    9.2. Historical Market Size Value (US$ Million) & Volume (MT) Analysis By Region, 2018 to 2022
    9.3. Current Market Size Value (US$ Million) & Volume (MT) Analysis and Forecast By Region, 2023 to 2033
        9.3.1. North America
        9.3.2. Latin America
        9.3.3. Europe
        9.3.4. East Asia
        9.3.5. South Asia
        9.3.6. Oceania
        9.3.7. MEA
    9.4. Market Attractiveness Analysis By Region
10. North America Analysis 2018 to 2022 and Forecast 2023 to 2033, By Country
    10.1. Historical Market Size Value (US$ Million) & Volume (MT) Trend Analysis By Market Taxonomy, 2018 to 2022
    10.2. Market Size Value (US$ Million) & Volume (MT) Forecast By Market Taxonomy, 2023 to 2033
        10.2.1. By Country
            10.2.1.1. United States of America
            10.2.1.2. Canada
        10.2.2. By Product
        10.2.3. By Application
        10.2.4. By Meat type
        10.2.5. By Automation
    10.3. Market Attractiveness Analysis
        10.3.1. By Country
        10.3.2. By Product
        10.3.3. By Application
        10.3.4. By Meat type
        10.3.5. By Automation
    10.4. Key Takeaways
11. Latin America Analysis 2018 to 2022 and Forecast 2023 to 2033, By Country
    11.1. Historical Market Size Value (US$ Million) & Volume (MT) Trend Analysis By Market Taxonomy, 2018 to 2022
    11.2. Market Size Value (US$ Million) & Volume (MT) Forecast By Market Taxonomy, 2023 to 2033
        11.2.1. By Country
            11.2.1.1. Brazil
            11.2.1.2. Mexico
            11.2.1.3. Argentina
            11.2.1.4. Chile
            11.2.1.5. Peru
            11.2.1.6. Rest of Latin America
        11.2.2. By Product
        11.2.3. By Application
        11.2.4. By Meat type
        11.2.5. By Automation
    11.3. Market Attractiveness Analysis
        11.3.1. By Country
        11.3.2. By Product
        11.3.3. By Application
        11.3.4. By Meat type
        11.3.5. By Automation
    11.4. Key Takeaways
12. Europe Analysis 2018 to 2022 and Forecast 2023 to 2033, By Country
    12.1. Historical Market Size Value (US$ Million) & Volume (MT) Trend Analysis By Market Taxonomy, 2018 to 2022
    12.2. Market Size Value (US$ Million) & Volume (MT) Forecast By Market Taxonomy, 2023 to 2033
        12.2.1. By Country
            12.2.1.1. Germany
            12.2.1.2. Italy
            12.2.1.3. France
            12.2.1.4. United Kingdom
            12.2.1.5. Spain
            12.2.1.6. Russia
            12.2.1.7. BENELUX
            12.2.1.8. Poland
            12.2.1.9. Nordic Countries
            12.2.1.10. Rest of Europe
        12.2.2. By Product
        12.2.3. By Application
        12.2.4. By Meat type
        12.2.5. By Automation
    12.3. Market Attractiveness Analysis
        12.3.1. By Country
        12.3.2. By Product
        12.3.3. By Application
        12.3.4. By Meat type
        12.3.5. By Automation
    12.4. Key Takeaways
13. East Asia Analysis 2018 to 2022 and Forecast 2023 to 2033, By Country
    13.1. Historical Market Size Value (US$ Million) & Volume (MT) Trend Analysis By Market Taxonomy, 2018 to 2022
    13.2. Market Size Value (US$ Million) & Volume (MT) Forecast By Market Taxonomy, 2023 to 2033
        13.2.1. By Country
            13.2.1.1. China
            13.2.1.2. Japan
            13.2.1.3. South Korea
        13.2.2. By Product
        13.2.3. By Application
        13.2.4. By Meat type
        13.2.5. By Automation
    13.3. Market Attractiveness Analysis
        13.3.1. By Country
        13.3.2. By Product
        13.3.3. By Application
        13.3.4. By Meat type
        13.3.5. By Automation
    13.4. Key Takeaways
14. South Asia Analysis 2018 to 2022 and Forecast 2023 to 2033, By Country
    14.1. Historical Market Size Value (US$ Million) & Volume (MT) Trend Analysis By Market Taxonomy, 2018 to 2022
    14.2. Market Size Value (US$ Million) & Volume (MT) Forecast By Market Taxonomy, 2023 to 2033
        14.2.1. By Country
            14.2.1.1. India
            14.2.1.2. Thailand
            14.2.1.3. Malaysia
            14.2.1.4. Indonesia
            14.2.1.5. Singapore
            14.2.1.6. Rest of South Asia
        14.2.2. By Product
        14.2.3. By Application
        14.2.4. By Meat type
        14.2.5. By Automation
    14.3. Market Attractiveness Analysis
        14.3.1. By Country
        14.3.2. By Product
        14.3.3. By Application
        14.3.4. By Meat type
        14.3.5. By Automation
    14.4. Key Takeaways
15. Oceania Analysis 2018 to 2022 and Forecast 2023 to 2033, By Country
    15.1. Historical Market Size Value (US$ Million) & Volume (MT) Trend Analysis By Market Taxonomy, 2018 to 2022
    15.2. Market Size Value (US$ Million) & Volume (MT) Forecast By Market Taxonomy, 2023 to 2033
        15.2.1. By Country
            15.2.1.1. Australia
            15.2.1.2. New Zealand
        15.2.2. By Product
        15.2.3. By Application
        15.2.4. By Meat type
        15.2.5. By Automation
    15.3. Market Attractiveness Analysis
        15.3.1. By Country
        15.3.2. By Product
        15.3.3. By Application
        15.3.4. By Meat type
        15.3.5. By Automation
    15.4. Key Takeaways
16. MEA Analysis 2018 to 2022 and Forecast 2023 to 2033, By Country
    16.1. Historical Market Size Value (US$ Million) & Volume (MT) Trend Analysis By Market Taxonomy, 2018 to 2022
    16.2. Market Size Value (US$ Million) & Volume (MT) Forecast By Market Taxonomy, 2023 to 2033
        16.2.1. By Country
            16.2.1.1. GCC Countries
            16.2.1.2. South Africa
            16.2.1.3. Central Africa
            16.2.1.4. North Africa
        16.2.2. By Product
        16.2.3. By Application
        16.2.4. By Meat type
        16.2.5. By Automation
    16.3. Market Attractiveness Analysis
        16.3.1. By Country
        16.3.2. By Product
        16.3.3. By Application
        16.3.4. By Meat type
        16.3.5. By Automation
    16.4. Key Takeaways
17. Key Countries Analysis
    17.1. United States of America
        17.1.1. Pricing Analysis
        17.1.2. Market Share Analysis, 2022
            17.1.2.1. By Product
            17.1.2.2. By Application
            17.1.2.3. By Meat type
            17.1.2.4. By Automation
    17.2. Canada
        17.2.1. Pricing Analysis
        17.2.2. Market Share Analysis, 2022
            17.2.2.1. By Product
            17.2.2.2. By Application
            17.2.2.3. By Meat type
            17.2.2.4. By Automation
    17.3. Brazil
        17.3.1. Pricing Analysis
        17.3.2. Market Share Analysis, 2022
            17.3.2.1. By Product
            17.3.2.2. By Application
            17.3.2.3. By Meat type
            17.3.2.4. By Automation
    17.4. Mexico
        17.4.1. Pricing Analysis
        17.4.2. Market Share Analysis, 2022
            17.4.2.1. By Product
            17.4.2.2. By Application
            17.4.2.3. By Meat type
            17.4.2.4. By Automation
    17.5. Argentina
        17.5.1. Pricing Analysis
        17.5.2. Market Share Analysis, 2022
            17.5.2.1. By Product
            17.5.2.2. By Application
            17.5.2.3. By Meat type
            17.5.2.4. By Automation
    17.6. Chile
        17.6.1. Pricing Analysis
        17.6.2. Market Share Analysis, 2022
            17.6.2.1. By Product
            17.6.2.2. By Application
            17.6.2.3. By Meat type
            17.6.2.4. By Automation
    17.7. Peru
        17.7.1. Pricing Analysis
        17.7.2. Market Share Analysis, 2022
            17.7.2.1. By Product
            17.7.2.2. By Application
            17.7.2.3. By Meat type
            17.7.2.4. By Automation
    17.8. Germany
        17.8.1. Pricing Analysis
        17.8.2. Market Share Analysis, 2022
            17.8.2.1. By Product
            17.8.2.2. By Application
            17.8.2.3. By Meat type
            17.8.2.4. By Automation
    17.9. Italy
        17.9.1. Pricing Analysis
        17.9.2. Market Share Analysis, 2022
            17.9.2.1. By Product
            17.9.2.2. By Application
            17.9.2.3. By Meat type
            17.9.2.4. By Automation
    17.10. France
        17.10.1. Pricing Analysis
        17.10.2. Market Share Analysis, 2022
            17.10.2.1. By Product
            17.10.2.2. By Application
            17.10.2.3. By Meat type
            17.10.2.4. By Automation
    17.11. Spain
        17.11.1. Pricing Analysis
        17.11.2. Market Share Analysis, 2022
            17.11.2.1. By Product
            17.11.2.2. By Application
            17.11.2.3. By Meat type
            17.11.2.4. By Automation
    17.12. United Kingdom
        17.12.1. Pricing Analysis
        17.12.2. Market Share Analysis, 2022
            17.12.2.1. By Product
            17.12.2.2. By Application
            17.12.2.3. By Meat type
            17.12.2.4. By Automation
    17.13. Russia
        17.13.1. Pricing Analysis
        17.13.2. Market Share Analysis, 2022
            17.13.2.1. By Product
            17.13.2.2. By Application
            17.13.2.3. By Meat type
            17.13.2.4. By Automation
    17.14. Poland
        17.14.1. Pricing Analysis
        17.14.2. Market Share Analysis, 2022
            17.14.2.1. By Product
            17.14.2.2. By Application
            17.14.2.3. By Meat type
            17.14.2.4. By Automation
    17.15. BENELUX
        17.15.1. Pricing Analysis
        17.15.2. Market Share Analysis, 2022
            17.15.2.1. By Product
            17.15.2.2. By Application
            17.15.2.3. By Meat type
            17.15.2.4. By Automation
    17.16. Nordic Countries
        17.16.1. Pricing Analysis
        17.16.2. Market Share Analysis, 2022
            17.16.2.1. By Product
            17.16.2.2. By Application
            17.16.2.3. By Meat type
            17.16.2.4. By Automation
    17.17. China
        17.17.1. Pricing Analysis
        17.17.2. Market Share Analysis, 2022
            17.17.2.1. By Product
            17.17.2.2. By Application
            17.17.2.3. By Meat type
            17.17.2.4. By Automation
    17.18. Japan
        17.18.1. Pricing Analysis
        17.18.2. Market Share Analysis, 2022
            17.18.2.1. By Product
            17.18.2.2. By Application
            17.18.2.3. By Meat type
            17.18.2.4. By Automation
    17.19. South Korea
        17.19.1. Pricing Analysis
        17.19.2. Market Share Analysis, 2022
            17.19.2.1. By Product
            17.19.2.2. By Application
            17.19.2.3. By Meat type
            17.19.2.4. By Automation
    17.20. India
        17.20.1. Pricing Analysis
        17.20.2. Market Share Analysis, 2022
            17.20.2.1. By Product
            17.20.2.2. By Application
            17.20.2.3. By Meat type
            17.20.2.4. By Automation
    17.21. Thailand
        17.21.1. Pricing Analysis
        17.21.2. Market Share Analysis, 2022
            17.21.2.1. By Product
            17.21.2.2. By Application
            17.21.2.3. By Meat type
            17.21.2.4. By Automation
    17.22. Indonesia
        17.22.1. Pricing Analysis
        17.22.2. Market Share Analysis, 2022
            17.22.2.1. By Product
            17.22.2.2. By Application
            17.22.2.3. By Meat type
            17.22.2.4. By Automation
    17.23. Malaysia
        17.23.1. Pricing Analysis
        17.23.2. Market Share Analysis, 2022
            17.23.2.1. By Product
            17.23.2.2. By Application
            17.23.2.3. By Meat type
            17.23.2.4. By Automation
    17.24. Singapore
        17.24.1. Pricing Analysis
        17.24.2. Market Share Analysis, 2022
            17.24.2.1. By Product
            17.24.2.2. By Application
            17.24.2.3. By Meat type
            17.24.2.4. By Automation
    17.25. Australia
        17.25.1. Pricing Analysis
        17.25.2. Market Share Analysis, 2022
            17.25.2.1. By Product
            17.25.2.2. By Application
            17.25.2.3. By Meat type
            17.25.2.4. By Automation
    17.26. New Zealand
        17.26.1. Pricing Analysis
        17.26.2. Market Share Analysis, 2022
            17.26.2.1. By Product
            17.26.2.2. By Application
            17.26.2.3. By Meat type
            17.26.2.4. By Automation
    17.27. GCC Countries
        17.27.1. Pricing Analysis
        17.27.2. Market Share Analysis, 2022
            17.27.2.1. By Product
            17.27.2.2. By Application
            17.27.2.3. By Meat type
            17.27.2.4. By Automation
    17.28. South Africa
        17.28.1. Pricing Analysis
        17.28.2. Market Share Analysis, 2022
            17.28.2.1. By Product
            17.28.2.2. By Application
            17.28.2.3. By Meat type
            17.28.2.4. By Automation
    17.29. North Africa
        17.29.1. Pricing Analysis
        17.29.2. Market Share Analysis, 2022
            17.29.2.1. By Product
            17.29.2.2. By Application
            17.29.2.3. By Meat type
            17.29.2.4. By Automation
    17.30. Central Africa
        17.30.1. Pricing Analysis
        17.30.2. Market Share Analysis, 2022
            17.30.2.1. By Product
            17.30.2.2. By Application
            17.30.2.3. By Meat type
            17.30.2.4. By Automation
18. Market Structure Analysis
    18.1. Competition Dashboard
    18.2. Competition Benchmarking
    18.3. Market Share Analysis of Top Players
        18.3.1. By Regional
        18.3.2. By Product
        18.3.3. By Application
        18.3.4. By Meat type
        18.3.5. By Automation
19. Competition Analysis
    19.1. Competition Deep Dive
        19.1.1. Duravant
            19.1.1.1. Overview
            19.1.1.2. Product Portfolio
            19.1.1.3. Profitability by Market Segments (Product/Meat Type /Automation/Application/Region)
            19.1.1.4. Sales Footprint
            19.1.1.5. Strategy Overview
                19.1.1.5.1. Marketing Strategy
                19.1.1.5.2. Product Strategy
                19.1.1.5.3. Channel Strategy
        19.1.2. Prime Equipment Group, Inc.
            19.1.2.1. Overview
            19.1.2.2. Product Portfolio
            19.1.2.3. Profitability by Market Segments (Product/Meat Type /Automation/Application/Region)
            19.1.2.4. Sales Footprint
            19.1.2.5. Strategy Overview
                19.1.2.5.1. Marketing Strategy
                19.1.2.5.2. Product Strategy
                19.1.2.5.3. Channel Strategy
        19.1.3. BAADER
            19.1.3.1. Overview
            19.1.3.2. Product Portfolio
            19.1.3.3. Profitability by Market Segments (Product/Meat Type /Automation/Application/Region)
            19.1.3.4. Sales Footprint
            19.1.3.5. Strategy Overview
                19.1.3.5.1. Marketing Strategy
                19.1.3.5.2. Product Strategy
                19.1.3.5.3. Channel Strategy
        19.1.4. BANSS
            19.1.4.1. Overview
            19.1.4.2. Product Portfolio
            19.1.4.3. Profitability by Market Segments (Product/Meat Type /Automation/Application/Region)
            19.1.4.4. Sales Footprint
            19.1.4.5. Strategy Overview
                19.1.4.5.1. Marketing Strategy
                19.1.4.5.2. Product Strategy
                19.1.4.5.3. Channel Strategy
        19.1.5. Stephan Machinery GmbH
            19.1.5.1. Overview
            19.1.5.2. Product Portfolio
            19.1.5.3. Profitability by Market Segments (Product/Meat Type /Automation/Application/Region)
            19.1.5.4. Sales Footprint
            19.1.5.5. Strategy Overview
                19.1.5.5.1. Marketing Strategy
                19.1.5.5.2. Product Strategy
                19.1.5.5.3. Channel Strategy
        19.1.6. GEA Group
            19.1.6.1. Overview
            19.1.6.2. Product Portfolio
            19.1.6.3. Profitability by Market Segments (Product/Meat Type /Automation/Application/Region)
            19.1.6.4. Sales Footprint
            19.1.6.5. Strategy Overview
                19.1.6.5.1. Marketing Strategy
                19.1.6.5.2. Product Strategy
                19.1.6.5.3. Channel Strategy
        19.1.7. BT Corporation
            19.1.7.1. Overview
            19.1.7.2. Product Portfolio
            19.1.7.3. Profitability by Market Segments (Product/Meat Type /Automation/Application/Region)
            19.1.7.4. Sales Footprint
            19.1.7.5. Strategy Overview
                19.1.7.5.1. Marketing Strategy
                19.1.7.5.2. Product Strategy
                19.1.7.5.3. Channel Strategy
        19.1.8. Marel
            19.1.8.1. Overview
            19.1.8.2. Product Portfolio
            19.1.8.3. Profitability by Market Segments (Product/Meat Type /Automation/Application/Region)
            19.1.8.4. Sales Footprint
            19.1.8.5. Strategy Overview
                19.1.8.5.1. Marketing Strategy
                19.1.8.5.2. Product Strategy
                19.1.8.5.3. Channel Strategy
        19.1.9. Illinois Tools Work
            19.1.9.1. Overview
            19.1.9.2. Product Portfolio
            19.1.9.3. Profitability by Market Segments (Product/Meat Type /Automation/Application/Region)
            19.1.9.4. Sales Footprint
            19.1.9.5. Strategy Overview
                19.1.9.5.1. Marketing Strategy
                19.1.9.5.2. Product Strategy
                19.1.9.5.3. Channel Strategy
        19.1.10. The Middleby Corporation
            19.1.10.1. Overview
            19.1.10.2. Product Portfolio
            19.1.10.3. Profitability by Market Segments (Product/Meat Type /Automation/Application/Region)
            19.1.10.4. Sales Footprint
            19.1.10.5. Strategy Overview
                19.1.10.5.1. Marketing Strategy
                19.1.10.5.2. Product Strategy
                19.1.10.5.3. Channel Strategy
        19.1.11. Bettcher Industries
            19.1.11.1. Overview
            19.1.11.2. Product Portfolio
            19.1.11.3. Profitability by Market Segments (Product/Meat Type /Automation/Application/Region)
            19.1.11.4. Sales Footprint
            19.1.11.5. Strategy Overview
                19.1.11.5.1. Marketing Strategy
                19.1.11.5.2. Product Strategy
                19.1.11.5.3. Channel Strategy
        19.1.12. Equipamientos Carnicos
            19.1.12.1. Overview
            19.1.12.2. Product Portfolio
            19.1.12.3. Profitability by Market Segments (Product/Meat Type /Automation/Application/Region)
            19.1.12.4. Sales Footprint
            19.1.12.5. Strategy Overview
                19.1.12.5.1. Marketing Strategy
                19.1.12.5.2. Product Strategy
                19.1.12.5.3. Channel Strategy
        19.1.13. Biro Manufacturing Company
            19.1.13.1. Overview
            19.1.13.2. Product Portfolio
            19.1.13.3. Profitability by Market Segments (Product/Meat Type /Automation/Application/Region)
            19.1.13.4. Sales Footprint
            19.1.13.5. Strategy Overview
                19.1.13.5.1. Marketing Strategy
                19.1.13.5.2. Product Strategy
                19.1.13.5.3. Channel Strategy
        19.1.14. Braher
            19.1.14.1. Overview
            19.1.14.2. Product Portfolio
            19.1.14.3. Profitability by Market Segments (Product/Meat Type /Automation/Application/Region)
            19.1.14.4. Sales Footprint
            19.1.14.5. Strategy Overview
                19.1.14.5.1. Marketing Strategy
                19.1.14.5.2. Product Strategy
                19.1.14.5.3. Channel Strategy
        19.1.15. RZPO
            19.1.15.1. Overview
            19.1.15.2. Product Portfolio
            19.1.15.3. Profitability by Market Segments (Product/Meat Type /Automation/Application/Region)
            19.1.15.4. Sales Footprint
            19.1.15.5. Strategy Overview
                19.1.15.5.1. Marketing Strategy
                19.1.15.5.2. Product Strategy
                19.1.15.5.3. Channel Strategy
        19.1.16. Bizerba
            19.1.16.1. Overview
            19.1.16.2. Product Portfolio
            19.1.16.3. Profitability by Market Segments (Product/Meat Type /Automation/Application/Region)
            19.1.16.4. Sales Footprint
            19.1.16.5. Strategy Overview
                19.1.16.5.1. Marketing Strategy
                19.1.16.5.2. Product Strategy
                19.1.16.5.3. Channel Strategy
        19.1.17. Riopel Industries
            19.1.17.1. Overview
            19.1.17.2. Product Portfolio
            19.1.17.3. Profitability by Market Segments (Product/Meat Type /Automation/Application/Region)
            19.1.17.4. Sales Footprint
            19.1.17.5. Strategy Overview
                19.1.17.5.1. Marketing Strategy
                19.1.17.5.2. Product Strategy
                19.1.17.5.3. Channel Strategy
        19.1.18. Minerva Omega Group
            19.1.18.1. Overview
            19.1.18.2. Product Portfolio
            19.1.18.3. Profitability by Market Segments (Product/Meat Type /Automation/Application/Region)
            19.1.18.4. Sales Footprint
            19.1.18.5. Strategy Overview
                19.1.18.5.1. Marketing Strategy
                19.1.18.5.2. Product Strategy
                19.1.18.5.3. Channel Strategy
        19.1.19. Risco
            19.1.19.1. Overview
            19.1.19.2. Product Portfolio
            19.1.19.3. Profitability by Market Segments (Product/Meat Type /Automation/Application/Region)
            19.1.19.4. Sales Footprint
            19.1.19.5. Strategy Overview
                19.1.19.5.1. Marketing Strategy
                19.1.19.5.2. Product Strategy
                19.1.19.5.3. Channel Strategy
        19.1.20. Millard Manufacturing Corporation
            19.1.20.1. Overview
            19.1.20.2. Product Portfolio
            19.1.20.3. Profitability by Market Segments (Product/Meat Type /Automation/Application/Region)
            19.1.20.4. Sales Footprint
            19.1.20.5. Strategy Overview
                19.1.20.5.1. Marketing Strategy
                19.1.20.5.2. Product Strategy
                19.1.20.5.3. Channel Strategy
20. Assumptions & Acronyms Used
21. Research Methodology

Explore Process Automation Insights

View Reports
Future Market Insights

Meat Processing Equipment Market

Schedule a Call