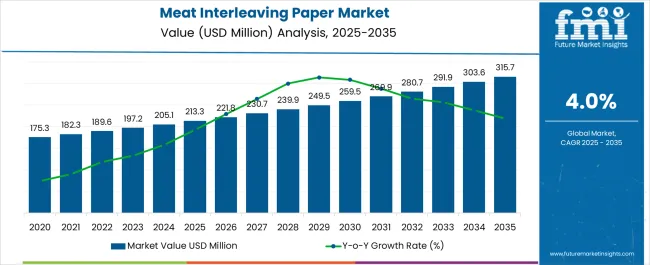
The Meat Interleaving Paper Market is estimated to be valued at USD 213.3 million in 2025 and is projected to reach USD 315.7 million by 2035, registering a compound annual growth rate (CAGR) of 4.0% over the forecast period.
| Metric | Value |
|---|---|
| Meat Interleaving Paper Market Estimated Value in (2025 E) | USD 213.3 million |
| Meat Interleaving Paper Market Forecast Value in (2035 F) | USD 315.7 million |
| Forecast CAGR (2025 to 2035) | 4.0% |
The meat interleaving paper market is expanding steadily as demand for hygienic and efficient packaging solutions in the meat industry continues to rise. Current dynamics are being influenced by increased consumption of processed and fresh meat, heightened focus on food safety, and the need for packaging materials that ensure quality preservation during storage and transportation.
Growth is further supported by innovations in paper treatment and coating technologies that improve resistance to moisture, grease, and tearing, thereby extending the usability of interleaving papers across diverse applications. The market outlook remains positive as evolving consumer preferences for convenient and well-packaged meat products strengthen demand across both retail and commercial channels.
Stringent food safety regulations are encouraging the adoption of specialized packaging solutions, and producers are investing in sustainable, biodegradable paper variants to align with environmental goals Over the forecast horizon, rising meat production volumes, combined with advances in packaging customization and supply chain integration, are expected to sustain market expansion and reinforce adoption across global markets.
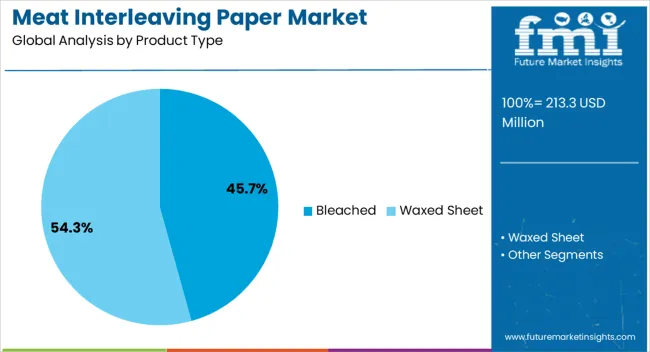
The bleached product type segment, holding 45.70% of the category, has established dominance due to its widespread application in ensuring hygienic meat handling and presentation. Its bright, clean appearance enhances product visibility, which is preferred in retail and commercial displays.
Resistance to grease absorption and ease of separation between meat layers have reinforced its adoption among processors and retailers. The segment’s market share has been supported by consistent demand from large-scale meat packaging operations where uniformity and quality assurance are critical.
Ongoing developments in eco-friendly bleaching processes have strengthened compliance with environmental standards without compromising performance With sustained preference from butchers, retailers, and food processors, the bleached paper segment is expected to maintain its leading position and contribute significantly to long-term growth within the meat interleaving paper market.
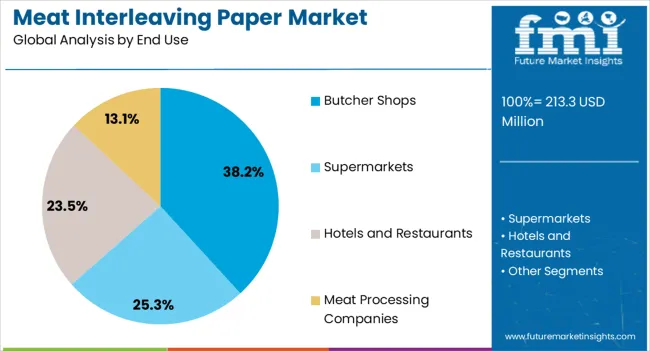
The butcher shops segment, representing 38.20% of the end-use category, has remained the largest consumer group owing to its reliance on interleaving paper for daily meat handling and packaging needs. The segment benefits from the paper’s ability to ensure hygienic separation of cuts, improve storage efficiency, and maintain freshness during display and sales.
Strong consumer preference for safe and visually appealing packaging has reinforced adoption across local and regional butcher networks. Market leadership is also being supported by consistent procurement practices and the operational necessity of interleaving paper in manual and semi-automated environments.
As urban retail networks expand and fresh meat demand increases, butcher shops are expected to remain a primary driver of consumption Investments in sustainable and recyclable paper solutions are further strengthening adoption in this segment, ensuring continued growth and stable contribution to the overall market landscape.
| CAGR from 2020 to 2025 | 2.60% |
|---|---|
| CAGR from 2025 to 2035 | 4.0% |
The historical performance and future growth projections of the meat interleaving paper market indicate a stable and promising trajectory driven by steady CAGR over different timeframes. Between 2020 and 2025, the market witnessed a CAGR of 2.60%, reflecting moderate yet consistent expansion.
This period highlighted the market trajectory in response to evolving consumer preferences and regulatory standards, leading to a rise in valuation from USD 175.3 million in 2020 to USD 213.3 million in 2025.
Short-term Analysis of Meat Interleaving Paper Market from 2020 to 2025
| 2020 | USD 175.3 million |
|---|---|
| 2025 | USD 213.3 million |
The market value rose from USD 175.3 million in 2020 to USD 213.3 million in 2025.
Mid-term Analysis of Meat Interleaving Paper Market from 2025 to 2035
| 2025 | USD 213.3 million |
|---|---|
| 2035 | USD 315.7 million |
The meat interleaving paper industry is estimated to rise from USD 213.3 million in 2025 to USD 315.7 million in 2035.
Long-term Analysis of Meat Interleaving Paper Market from 2035 to 2035
| 2035 | USD 315.7 million |
|---|---|
| 2035 | USD 315.7 million |
The sales of meat interleaving paper are projected to surpass USD 315.7 million by 2035.
Rise in Customization and Branding
There is a notable trend toward customized and branded interleaving paper catering to the specific requirements of individual meat processors and retailers. With the increasing emphasis on product differentiation and brand recognition, businesses are leveraging customized interleaving paper to enhance their brand visibility and create a unique product identity.
Integration of Antimicrobial Properties
In response to the growing concerns regarding foodborne illnesses and bacterial contamination, there is an emerging trend of integrating antimicrobial properties into meat interleaving paper.
Manufacturers are exploring innovative solutions that incorporate antimicrobial agents to extend the shelf life of meat products and ensure enhanced food safety, thereby addressing consumer demand for safer and more hygienic packaging materials.
Shift Towards Recyclable and Biodegradable Materials
With a heightened focus on environmental sustainability and waste reduction, the meat interleaving paper market is witnessing a shift toward the adoption of recyclable and biodegradable materials.
Businesses increasingly opt for eco-friendly packaging solutions that minimize environmental impact, aligning with consumer preferences for sustainable and green packaging options.
Advancements in Active Packaging Technologies
The integration of advanced active packaging technologies, such as modified atmosphere packaging (MAP) and oxygen scavengers, is gaining traction in the meat interleaving paper market.
These technologies help preserve the freshness and quality of meat products by regulating the internal atmosphere of the packaging, thereby extending the product's shelf life and enhancing its overall appeal to consumers.
Growing Demand for Convenience and Portability
There is a growing consumer demand for convenient and portable packaging solutions, particularly in ready-to-eat and on-the-go meat products. As a result, manufacturers are focusing on developing interleaving paper that facilitates easy handling, portion control, and convenient packaging formats, catering to the evolving lifestyle preferences of modern consumers.
This trend is driving the innovation of user-friendly and convenient interleaving paper solutions in the market.
The section explores the category-wise analysis of the meat interleaving paper industry, focusing on two key categories in the market, which are product type and end use. Under the product type category, the analysis highlights the dominance of the bleached meat interleaving paper, which captured a significant share of 68.80% in 2025.
By end use category, the hotels and restaurants segment accounts for 39.80% market share in 2025.
| Attributes | Details |
|---|---|
| By Product Type | Bleached |
| Market Share in 2025 | 68.80% |
With a 68.80% share in 2025, the bleached meat interleaving paper maintains its dominance in the industry.
| Attributes | Details |
|---|---|
| Top End Use | Hotels and Restaurants |
| Market Share in 2025 | 39.80% |
Capturing a substantial market share of 39.80% in 2025, the hotels and restaurants segment serves as a significant driver for the adoption of meat interleaving paper.
The hotels and restaurants segment's significant market share highlights the segment's commitment to addressing hygiene concerns and ensuring the safe and sanitary handling of meat products
The section provides an analysis of the meat interleaving paper industry from a country-specific perspective, highlighting the varying CAGR projected through 2035 for key countries.
The insights cover the growth trajectories of the market in countries such as the United States, Australia, Germany, the United Kingdom, China, India, and Japan, shedding light on the distinct factors influencing demand for meat interleaving paper in each.
| Countries | CAGR through 2035 |
|---|---|
| United States | 4.80% |
| Australia | 3.40% |
| Germany | 4.30% |
| United Kingdom | 2.30% |
| China | 6.90% |
| India | 6.60% |
| Japan | 5.70% |
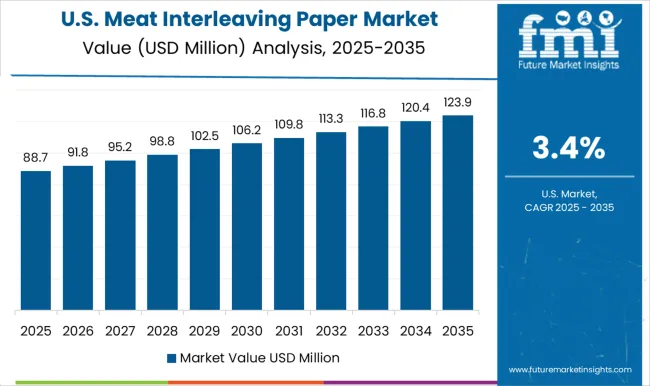
With a projected CAGR of 4.80% through 2035, the United States demonstrates a steady growth trajectory, positioning itself in the global meat interleaving paper industry.
Projecting a 3.40% CAGR through 2035, the sales of meat interleaving paper in Australia demonstrate steady growth driven by the evolving food industry and the focus on sustainable packaging solutions.
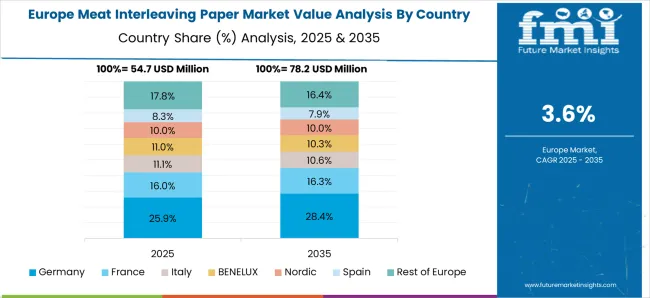
Demonstrating a 4.30% projected CAGR through 2035, the demand for meat interleaving paper in Germany showcases growth driven by technological advancements and sustainable packaging practices.
With a projected CAGR of 2.30% through 2035, the meat interleaving paper industry in the United Kingdom exhibits a sluggish growth pattern. The demand is likely to witness a change in trajectory from bearish to bullish due to a rising focus on efficient packaging solutions and adherence to quality standards in the food sector.
Projecting a 6.90% CAGR through 2035, the meat interleaving paper market in China exhibits rapid growth driven by the expanding food processing sector and an emphasis on food safety and quality standards.
With a projected CAGR of 6.60% through 2035, the adoption of meat interleaving paper in India demonstrates robust growth driven by the expanding food processing industry and the demand for advanced packaging solutions.
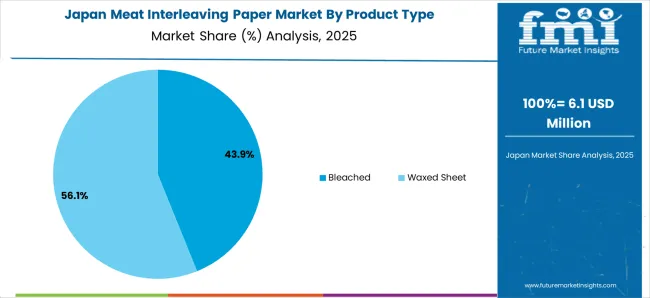
Demonstrating a steady projected CAGR of 5.70% through 2035, the meat interleaving paper industry in Japan thrives on technological advancements and a commitment to high-quality packaging solutions.
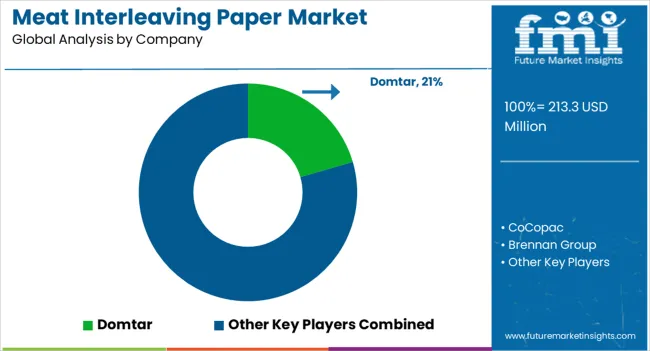
The industry is currently witnessing a heightened level of competition, driven by various factors that have reshaped the market dynamics.
Technological advancements in production processes, including the integration of advanced machinery and automated systems, have facilitated the efficient and cost-effective manufacturing of meat interleaving paper, intensifying the competition among key players.
Moreover, the increasing emphasis on sustainable and eco-friendly packaging solutions has prompted companies to innovate and develop biodegradable and recyclable interleaving paper, contributing to the competitive environment.
Domtar
Domtar is a leading global provider of pulp, paper, and specialty products, including meat interleaving paper. The company has a strong presence in North America and Europe, and various meat processors and retailers use its products.
CoCopac
CoCopac is a global leader in the production of sustainable packaging solutions, including meat interleaving paper. The company's products are made from recycled materials and are certified compostable.
Brennan Group
Brennan Group is a leading manufacturer of disposable paper products, including meat interleaving paper. The company has a strong presence in North America and Europe, and its products are used by a variety of meat processors and retailers.
Orora Packaging
Orora Packaging is a leading Australasian packaging solutions company, including meat interleaving paper. The company has a strong presence in Australia and New Zealand, and its products are used by a variety of meat processors and retailers.
Delfort Group
Delfort Group is a leading European manufacturer of specialty papers, including meat interleaving paper. The company has a strong presence in Europe and Asia, and various meat processors and retailers use its products.
These are just a few players in the meat interleaving paper industry. The industry is highly competitive, and companies constantly innovate to develop new and better products.
Recent Developments in the Meat Interleaving Paper Industry:
The global meat interleaving paper market is estimated to be valued at USD 213.3 million in 2025.
The market size for the meat interleaving paper market is projected to reach USD 315.7 million by 2035.
The meat interleaving paper market is expected to grow at a 4.0% CAGR between 2025 and 2035.
The key product types in meat interleaving paper market are bleached, waxed sheet, single waxed sheet, laminated waxed sheet and octagonal waxed sheet.
In terms of end use, butcher shops segment to command 38.2% share in the meat interleaving paper market in 2025.


Our Research Products

The "Full Research Suite" delivers actionable market intel, deep dives on markets or technologies, so clients act faster, cut risk, and unlock growth.

The Leaderboard benchmarks and ranks top vendors, classifying them as Established Leaders, Leading Challengers, or Disruptors & Challengers.

Locates where complements amplify value and substitutes erode it, forecasting net impact by horizon

We deliver granular, decision-grade intel: market sizing, 5-year forecasts, pricing, adoption, usage, revenue, and operational KPIs—plus competitor tracking, regulation, and value chains—across 60 countries broadly.

Spot the shifts before they hit your P&L. We track inflection points, adoption curves, pricing moves, and ecosystem plays to show where demand is heading, why it is changing, and what to do next across high-growth markets and disruptive tech

Real-time reads of user behavior. We track shifting priorities, perceptions of today’s and next-gen services, and provider experience, then pace how fast tech moves from trial to adoption, blending buyer, consumer, and channel inputs with social signals (#WhySwitch, #UX).

Partner with our analyst team to build a custom report designed around your business priorities. From analysing market trends to assessing competitors or crafting bespoke datasets, we tailor insights to your needs.
Supplier Intelligence
Discovery & Profiling
Capacity & Footprint
Performance & Risk
Compliance & Governance
Commercial Readiness
Who Supplies Whom
Scorecards & Shortlists
Playbooks & Docs
Category Intelligence
Definition & Scope
Demand & Use Cases
Cost Drivers
Market Structure
Supply Chain Map
Trade & Policy
Operating Norms
Deliverables
Buyer Intelligence
Account Basics
Spend & Scope
Procurement Model
Vendor Requirements
Terms & Policies
Entry Strategy
Pain Points & Triggers
Outputs
Pricing Analysis
Benchmarks
Trends
Should-Cost
Indexation
Landed Cost
Commercial Terms
Deliverables
Brand Analysis
Positioning & Value Prop
Share & Presence
Customer Evidence
Go-to-Market
Digital & Reputation
Compliance & Trust
KPIs & Gaps
Outputs
Full Research Suite comprises of:
Market outlook & trends analysis
Interviews & case studies
Strategic recommendations
Vendor profiles & capabilities analysis
5-year forecasts
8 regions and 60+ country-level data splits
Market segment data splits
12 months of continuous data updates
DELIVERED AS:
PDF EXCEL ONLINE
Meat Snacks Market Size and Share Forecast Outlook 2025 to 2035
Meat Alternative Market Forecast and Outlook 2025 to 2035
Meat, Poultry, and Seafood Packaging Market Size and Share Forecast Outlook 2025 to 2035
Meat Extracts Market Size and Share Forecast Outlook 2025 to 2035
Meat Trays Market Analysis - Size and Share Forecast Outlook 2025 to 2035
Meat Enzyme Market Analysis - Size and Share Forecast Outlook 2025 to 2035
Meat Mixers Market Size and Share Forecast Outlook 2025 to 2035
Meat Stabilizer Market Size and Share Forecast Outlook 2025 to 2035
Meat Processing Equipment Market Size and Share Forecast Outlook 2025 to 2035
Meat Cutting Machine Market Size and Share Forecast Outlook 2025 to 2035
Meat Mincers Market Size and Share Forecast Outlook 2025 to 2035
Meat Tenderizer Market Size and Share Forecast Outlook 2025 to 2035
Meat Starter Cultures Market Size and Share Forecast Outlook 2025 to 2035
Meat Based FPP Market Size and Share Forecast Outlook 2025 to 2035
Meat Dicing Machine Market Size and Share Forecast Outlook 2025 to 2035
Meat Seasonings Market Size and Share Forecast Outlook 2025 to 2035
Meat Substitutes Market Analysis - Size, Share, & Forecast Outlook 2025 to 2035
Meat Packaging Market Trends - Growth & Forecast 2025 to 2035
Meat Emulsions Market Growth - Demand & Industry Insights 2025 to 2035
Analyzing Meat Packaging Market Share & Industry Growth

Thank you!
You will receive an email from our Business Development Manager. Please be sure to check your SPAM/JUNK folder too.
Chat With
MaRIA