The Meat Mincers Market is estimated to be valued at USD 541.6 million in 2025 and is projected to reach USD 1258.7 million by 2035, registering a compound annual growth rate (CAGR) of 8.8% over the forecast period.
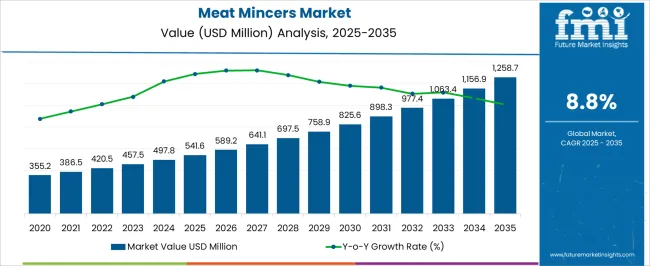
| Metric | Value |
|---|---|
| Meat Mincers Market Estimated Value in (2025 E) | USD 541.6 million |
| Meat Mincers Market Forecast Value in (2035 F) | USD 1258.7 million |
| Forecast CAGR (2025 to 2035) | 8.8% |
The meat mincers market is experiencing steady growth driven by increasing demand from food service providers and commercial kitchens aiming to enhance food preparation efficiency and hygiene standards. Rising consumer preference for freshly ground meat and growing awareness of meat quality are influencing the market positively.
Innovations in electric mincing technology have improved performance and safety features, encouraging adoption in various food establishments. The market outlook is further supported by the expanding hospitality industry and rising number of quick service restaurants requiring reliable and efficient mincing solutions.
Operational advantages such as faster processing times and ease of cleaning have made modern meat mincers a preferred choice. Future opportunities are expected to arise from the integration of automation, improved materials for durability, and growing regulatory emphasis on food safety compliance, which collectively drive the modernization of meat processing equipment across commercial and retail segments.
The market is segmented by Product Type, Installation Type, End User, Distribution Channel, Online Channel, and Offline Channel and region. By Product Type, the market is divided into Electric and Manual. In terms of Installation Type, the market is classified into CounterTop and Floor Standing. Based on End User, the market is segmented into Commercial, Residential, and Industrial. By Distribution Channel, the market is divided into Online and Offline. By Online Channel, the market is segmented into E-Commerce Platforms and Company Websites. By Offline Channel, the market is segmented into Supermarkets, Kitchenware Stores, and Independent Retailers. Regionally, the market is classified into North America, Latin America, Western Europe, Eastern Europe, Balkan & Baltic Countries, Russia & Belarus, Central Asia, East Asia, South Asia & Pacific, and the Middle East & Africa.
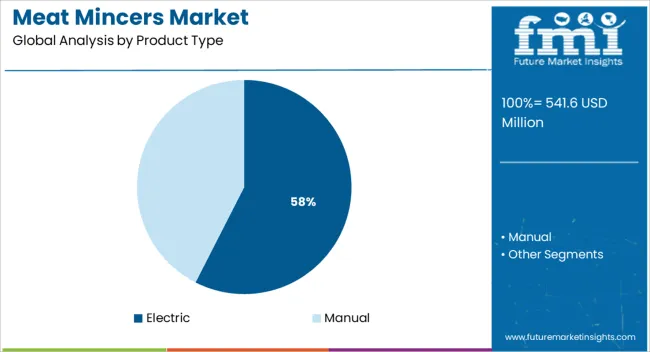
When segmented by product type, electric meat mincers are projected to hold 57.5% of the total market revenue in 2025, securing the leading position. This dominance is attributed to the enhanced efficiency and user-friendly operation offered by electric models compared to manual alternatives.
The widespread adoption has been facilitated by advances in motor technology, improved safety mechanisms, and energy-efficient designs. Electric mincers provide consistent output, reduced labor intensity, and faster processing times which are critical for commercial kitchens and food processing units.
Their ability to handle higher volumes with minimal operator fatigue has accelerated their integration into both small and large-scale meat processing operations. Additionally, the scalability and compatibility with automated production lines have reinforced the preference for electric mincers in modern food preparation environments.
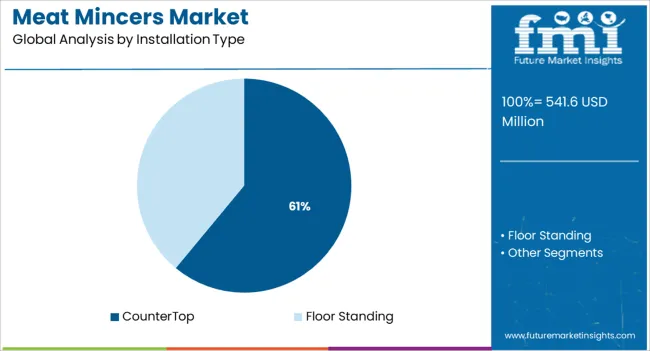
Segmented by installation type, countertop meat mincers are anticipated to capture 61.0% of the market revenue in 2025, establishing their position as the dominant segment. Their popularity stems from the flexibility and space efficiency they offer, especially suited for commercial kitchens with limited floor space.
Countertop models are valued for their ease of installation, mobility, and convenience, enabling quick setup and relocation as operational needs evolve. This installation type supports rapid cleaning and maintenance, essential in food safety compliance, which has led to their preferred use in fast-paced food service settings.
The adaptability to various power sources and compatibility with different meat types have further strengthened the segment’s growth, making countertop units a practical and cost-effective solution for diverse commercial applications.
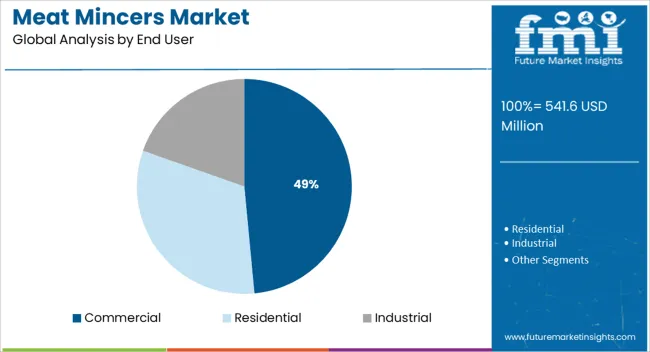
When segmented by end user, commercial establishments are expected to hold 48.5% of the market revenue in 2025, leading the industry segments. The growth in this segment is driven by the expanding hospitality sector, including restaurants, hotels, and catering services, which require efficient and reliable meat mincing equipment to meet high-volume demand.
Commercial users prioritize performance, durability, and compliance with hygiene standards, factors that have accelerated the adoption of advanced meat mincers. The segment benefits from increasing consumer preference for freshly prepared food and stringent food safety regulations that compel operators to upgrade processing equipment.
Investment in modern kitchen appliances to improve operational workflows and reduce labor costs also supports the prominence of the commercial end user segment in the meat mincers market.
The global meat mincers market is projected to grow at 8.8% CAGR between 2025 and 2035, in comparison to the 6.2% CAGR registered during the historical period from 2020 to 2025.
Increasing consumption of meat products and growing adoption of meat processing equipment across residential, industrial, and commercial sectors are some of the key factors driving the global meat mincers market.
Meat mincers are unique meat processing machines used by end users to get minced meat, a smooth and uniform soft mass that is then cooked or used in various food products. Thus, rising consumption of minced meat across the world will continue to push the demand for meat mincers during the forecast period.
Today, more and more companies are using electric meat mincers to improve their productivity and reduce labor costs. This is expected to positively influence the sales of meat mincers.
Since the domestic use of meat mincers has increased, consumers look for a good quality meat mincer that has all the features that too at an economical price. As a result, leading players are introducing innovative meat mincers at affordable prices. This will further aid in the expansion of the meat mincers market during the forecast period.
Rising Meat Consumption to Boost the Global Meat Mincers Market
Over the years, there has been a spike in meat production and consumption across the world due to the increasing non-vegan population, changing lifestyles, and growing usage of minced meat in various dishes. This in turn is generating huge demand for meat processing equipment such as meat mincers and the trend is likely to continue during the forecast period
According to the Institute of Food Technologies (IFT), global meat consumption is expected to rise 1.4% per year through 2025. This drastic rise in consumption of meat and meat-based products is expected to bolster the growth of the meat mincers market.
Similarly, the rapid expansion of the food service industry and the growing popularity of processed and convenience foods are expected to propel the sales of meat mincers over the next ten years.
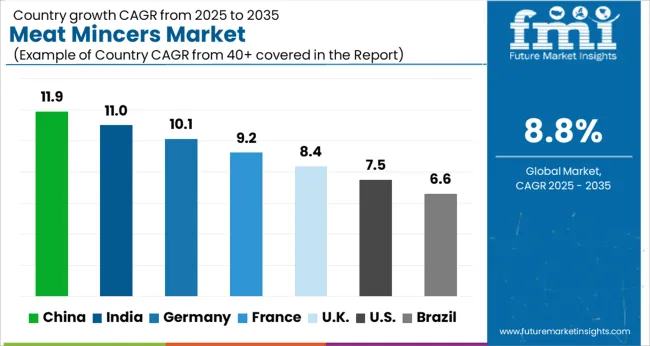
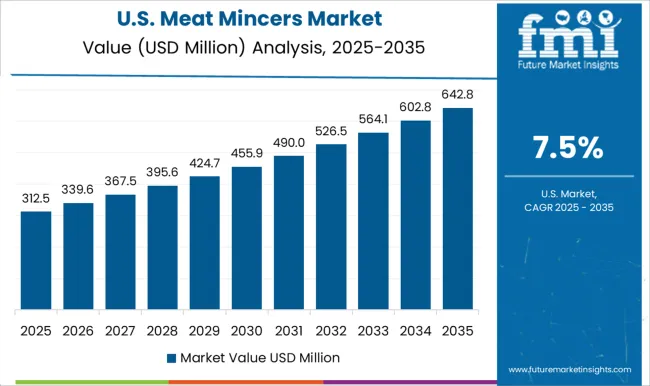
Rising Consumption of Meat Products Driving the USA Meat Mincers Market
As per FMI, the USA will continue to dominate the global meat mincers market during the forecast period, owing to the increasing consumption of meat products and growing adoption of meat mincers across the HoReCa sector.
On average, Americans consume 274 pounds of meat per year, not including shellfish and fish, as well as individual food waste. Since 1961, the quantity of food consumed in the form of burgers, meatballs, and sausages in the USA has increased by 40%.
The United States of America Department of Agriculture (USDA) announced in 2020 that Americans are eating more meat than recommended by national dietary guidelines. This will continue to generate the demand for advanced meat processing equipment like meat mincers during the forecast period.
Similarly, the heavy presence of leading meat mincer manufacturers and supportive government policies are expected to positively impact the USA meat mincers market during the next ten years.
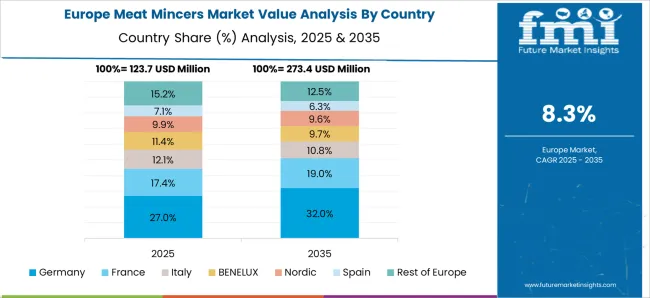
Technological Advancements in Meat Mincers to Facilitate Market Expansion in Germany
The German meat mincers market is anticipated to grow at a healthy pace during the forecast period owing to the rising meat consumption, availability of advanced meat processing machines, and rapid expansion of end-use sectors.
According to figures given by the Federal Agency for Agriculture and Food, Germany produced 497.8 million tonnes of meat in 2024, down 1.6 percent (142,000 tonnes) from 2020. Despite this decrease in meat production, the overall sales of meat mincers remained positive and the trend is likely to continue during the forecast period.
The rise in the export of meat products and technological advancements in meat processing machinery will further aid in the expansion of the meat mincers market across the country over the next decade.
End Users Preferring Electric/Automatic Meat Mincers
Based on product type, the electric or automatic meat mincers segment is expected to grow at the highest pace during the forecast period, owing to the rising end-user preference for these high-performance electric/automatic meat mincers.
Electric meat mincers are incredibly easy to use and significantly improve the productivity of processes. They also reduce the need for human intervention and thus help end users save costs. As a result, they are gaining immense popularity across the world.
Sales of Meat Mincers Likely to Remain Concentrated in Commercial Segment
Based on end users, the commercial segment is likely to generate the highest revenues in the global meat mincers market during the forecast period. This can be attributed to the rising usage of meat minces across hotels, restaurants, fast food joints, and other commercial sectors.
As the demand for meat products continues to surge, end users like hotels and restaurants are increasingly adopting advanced meat processing machinery to meet this demand. This will positively impact the meat mincers market during the next ten years.
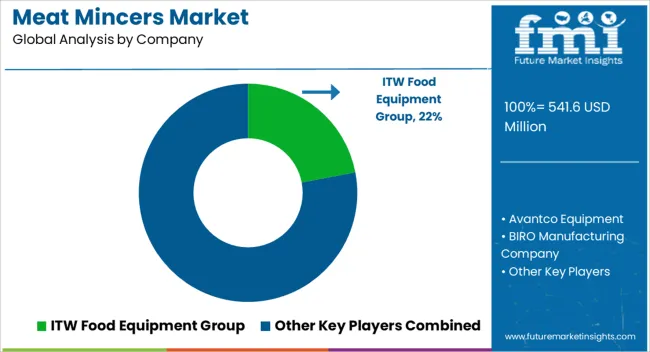
The global meat mincers market is highly competitive due to the presence of various regional and domestic market players. In order to capitalize and increase their sales, market players are coming up with new technologies. They are adopting strategies such as new product launches, partnerships, mergers, acquisitions, and mergers. For instance,
Get A Perfect Grind Every Time with Advanced Meat Mincers from Avantco Equipment, BIRO Manufacturing Company, And ITW Food Equipment
Over the years, the popularity of meat mincer has gained immense traction, especially across high meat-consuming countries like the USA, India, China, Germany, and the UK Companies use meat mincers for making meat patties or meatballs for burgers, meat loaves for sandwiches, or to make shredded beef for tacos. Meat Mincer can also be used as an attachment for stand mixers to shred chicken breasts or pork chops. They enable companies to cut down on labor costs when processing meats.
Avantco is an international manufacturer of food service equipment. The company offers a full range of products that includes refrigeration and freezing equipment, cooking equipment, dishwashing machines, ware washing machines, and more. The mission of Avantco is to provide high-quality products to its customers through continuous improvement in design and manufacturing techniques.
The company has been working hard over recent years on improving its existing product ranges as well as developing new ones. It also invests heavily in research and development, continually striving to produce innovative solutions to help you run your business efficiently.
Another leading manufacturer and supplier of meat processing machinery and equipment are BIRO Manufacturing Company. BIRO Manufacturing Company supplies a complete variety of meat equipment, including meat saws, meat tenderizers, mixer-grinders, desktop grinders/mincers, floor model grinders/mincers, meat room/deli slicers, horizontal slicers, vacuum tumblers, poultry cutters, frozen block chippers, and patty/food formers. To satisfy the changing demands of today's meat processors, BIRO Manufacturing can custom design and manufacture any meat equipment.
The company offers a wide range of products including BIRO 722, a dependable, long-lasting, and low-cost meat grinder/mincer. It is intended for usage in restaurants, meat departments, hunters, farmers, and at home. Another product is The BIRO 822SS stainless steel countertop meat grinder which is dependable, long-lasting, and reasonably priced. It is intended for use by restaurants, meat departments, meat laboratories, and hunters.
Established in 1995, ITW Food Equipment Group LLC has become a reliable destination for people looking for advanced meat processing tools like meat mincers. Commercial equipment distribution, such as cooking and food service equipment, is part of the Company's activity.
An industry pioneer that serves institutional, industrial, restaurant, and retail customers worldwide, ITW Food Equipment designs, manufactures, and sells food equipment, including advanced refrigeration machinery. The company’s products are known for their high performance and durability. They enable end users to significantly improve overall productivity and reduce labor costs.
| Attribute | Details |
|---|---|
| Estimated Market Size (2025) | USD 541.6 million |
| Projected Market Size (2035) | USD 1258.7 million |
| Anticipated Growth Rate (2025 to 2035) | 8.8% CAGR |
| Forecast Period | 2025 to 2035 |
| Historical Data Available for | 2020 to 2025 |
| Market Analysis | USD Million for Value and Units for Volume |
| Key Regions Covered | North America; Latin America; Europe; South Asia; East Asia; Oceania; Middle East and Africa (MEA) |
| Key Countries Covered | USA, Canada, Mexico, Germany, UK, France, Italy, Spain, China, Japan, India, South Korea, Australia, Brazil, Argentina, South Africa, UAE |
| Key Segments Covered | Product Type, Installation Type, End User, Distribution Channel, Region |
| Key Companies Profiled | Avantco Equipment; BIRO Manufacturing Company; Bizerba USA Inc.; Butcher boy Machines International LLC; ITW Food Equipment Group; KitchenWare Station LLC.; Minerva Omega Group s.r.l.; Sammic S.L.; Sirman SpA; The Vollrath Co., L.L.C.; Hobart; Sirman; Paul KOLBE GmbH; Braher Internacional; Globe Food Equipment |
| Report Coverage | Market Forecast, Company Share Analysis, Competitive Landscape, Drivers, Restraints, Opportunities and Threats Analysis, Market Dynamics and Challenges, and Strategic Growth Initiatives |
The global meat mincers market is estimated to be valued at USD 541.6 million in 2025.
The market size for the meat mincers market is projected to reach USD 1,258.7 million by 2035.
The meat mincers market is expected to grow at a 8.8% CAGR between 2025 and 2035.
The key product types in meat mincers market are electric and manual.
In terms of installation type, countertop segment to command 61.0% share in the meat mincers market in 2025.


Full Research Suite comprises of:
Market outlook & trends analysis
Interviews & case studies
Strategic recommendations
Vendor profiles & capabilities analysis
5-year forecasts
8 regions and 60+ country-level data splits
Market segment data splits
12 months of continuous data updates
DELIVERED AS:
PDF EXCEL ONLINE
Meat Snacks Market Size and Share Forecast Outlook 2025 to 2035
Meat Alternative Market Forecast and Outlook 2025 to 2035
Meat, Poultry, and Seafood Packaging Market Size and Share Forecast Outlook 2025 to 2035
Meat Extracts Market Size and Share Forecast Outlook 2025 to 2035
Meat Trays Market Analysis - Size and Share Forecast Outlook 2025 to 2035
Meat Interleaving Paper Market Size and Share Forecast Outlook 2025 to 2035
Meat Enzyme Market Analysis - Size and Share Forecast Outlook 2025 to 2035
Meat Mixers Market Size and Share Forecast Outlook 2025 to 2035
Meat Stabilizer Market Size and Share Forecast Outlook 2025 to 2035
Meat Processing Equipment Market Size and Share Forecast Outlook 2025 to 2035
Meat Cutting Machine Market Size and Share Forecast Outlook 2025 to 2035
Meat Tenderizer Market Size and Share Forecast Outlook 2025 to 2035
Meat Starter Cultures Market Size and Share Forecast Outlook 2025 to 2035
Meat Based FPP Market Size and Share Forecast Outlook 2025 to 2035
Meat Dicing Machine Market Size and Share Forecast Outlook 2025 to 2035
Meat Seasonings Market Size and Share Forecast Outlook 2025 to 2035
Meat Substitutes Market Analysis - Size, Share, & Forecast Outlook 2025 to 2035
Meat Packaging Market Trends - Growth & Forecast 2025 to 2035
Meat Emulsions Market Growth - Demand & Industry Insights 2025 to 2035
Analyzing Meat Packaging Market Share & Industry Growth

Thank you!
You will receive an email from our Business Development Manager. Please be sure to check your SPAM/JUNK folder too.
Chat With
MaRIA