Meat Cutting Machine Market Outlook (2023 to 2033)

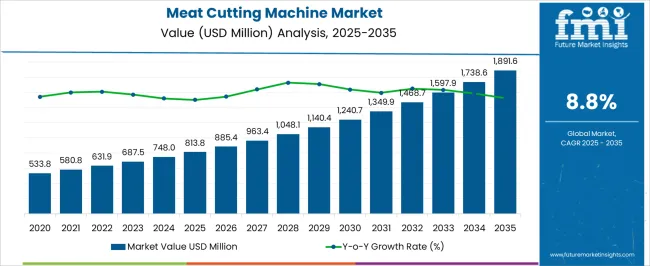
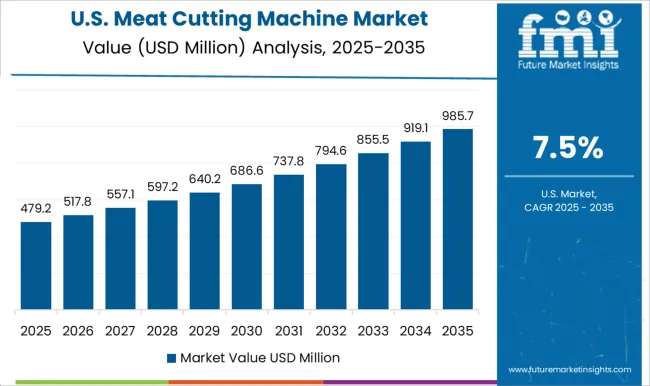
The global meat cutting machine market size is expected to grow from US$ 687.5 Million in 2023 to US$ 749 Million by 2033, with overall sales accelerating at 8.8% CAGR throughout the forecast period (2023 to 2033). Rising adoption across meat processing industries, restaurants, slaughterhouses, and households is a key factor pushing demand for meat-cutting machines in the global market.

Since ancient times, man has used tools made of stones and metal to cut meat into pieces. However, working with sharp tools like knives increases the chances of injuries to workers. This has triggered innovation in meat-cutting tools and paved way for the development of advanced machineries like a meat grinders, meat shredders, meat slicers, meat mincers, and meat dicers.

Meat-cutting machines are equipment used to cut food, especially meat, into smaller pieces, used for making various food products or intended for sale in a retail environment. These machines have helped end-use industries improve worker safety, reduce costs, and increase overall productivity.

Increasing consumption of meat and meat-based products along with rising usage of meat cutting machines across various end-use industries will continue to boost the global market during the forecast period.

Similarly, the meat cutting machine market is being propelled ahead by the use of meat slicers and meat grinders in a range of end-user sectors, such as supermarkets, restaurants, and hotels.

In addition to this, increased demand for convenience meals among a large population base across various regions and technological advancements in meat cutting equipment will generate growth avenues within the meat cutting machine market during the projected period.

Leading meat cutting machine manufacturers are continuously innovating to develop advanced meat cutting equipment with user-friendly features to increase operator convenience. This will help them to increase their sales which will eventually expand the global meat cutting machine market size during the next ten years.

Regionally, North America holds the largest market share of the global meat cutting machine market, and it is expected to grow at a healthy pace during the projection period. This can be attributed to the rising meat consumption, expansion of the food service industry, and strong presence of leading manufacturers.

Attribute Key Statistics
Meat Cutting Machine Market Estimated Value (2023) US$ 687.5 Million
Projected Market Value (2033) US$ 749 Million
Value-based CAGR (2023 to 2033) 8.8%
Market Size in India US$ 129.6 Million

Don't pay for what you don't need

Customize your report by selecting specific countries or regions and save 30%!

2018 to 2022 Meat Cutting Machine Market Outlook Compared to 2023 to 2033 Forecast

The global sales of meat cutting machines are anticipated to grow at 8.8% CAGR between 2023 and 2033, in comparison to the 10.4% CAGR registered during the historical period from 2018 to 2022.

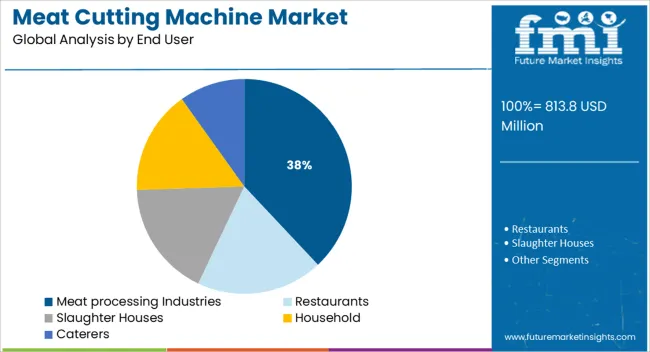
Rising consumption of meat products and increasing demand for meat cutting machines from food processing industries, restaurants, caterers, households, and slaughterhouses are some of the key factors driving growth in the meat cutting machine market.

Over the years, increasing demand for meat products has compelled food manufacturing companies to adopt advanced machinery across their facilities and the trend is likely to continue during the forecast period.

The adoption of these machines helps to increase productivity, improve worker safety, and reduce costs. As a result, more and more companies are installing meat cutting machines like meat slicers, meat grinders, and meat saws. This will boost the global meat cutting machine market during the projected period.

Overview of Key Trends Shaping the Market 

Increasing Consumption of Meat Worldwide to Drive Meat Cutting Machine Market Swiftly Through 2032

Meat has been a part of the human diet since prehistoric times, and it continues to be the primary source of essential nutrients that our body requires. However, over the last few decades, consumption of meat products has skyrocketed and the trend is expected to continue during the next ten years.

According to the Institute of Food Technologies (IFT), meat consumption worldwide is expected to increase by 1.4% per year through 2023. This will play a key role in boosting the meat cutting machine market.

Similarly, the rapid expansion of the fast-food industry across the world along with the growing popularity of non-veg products like steaks is expected to propel the sales of meat cutting machines over the next ten years.
Nandini Roy Choudhury

Principal Consultant

Talk to Analyst

Find your sweet spots for generating winning opportunities in this market.

Country-wise Insights

How is the USA Considered a Prominent Meat Cutting Machine Market?

Rapid Growth of Food Service Industry Pushing Demand for Meat Cutting Machines in the USA

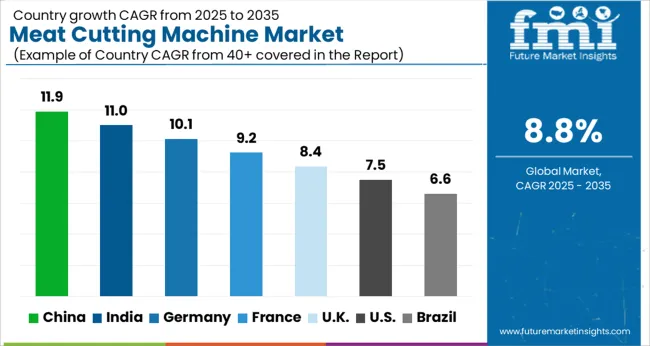
As per FMI, the USA will continue to dominate the global meat cutting machine market during the forecast period, owing to the rapid expansion of the food service industry, growing consumption of non-veg foods, and increasing consumer spending.

Similarly, the rising export of meat products such as beef is playing a key role in pushing demand for meat cutting machines like meat saws and meat slicers across the country.

In the USA pork loins, beef loins, or other processed meats, whether they have bones or not, are sent to an automatically functioning machine, which then chops them into steak, chops, or other meat products. By adjusting the speed at which the object is supplied to and through the cutting mechanism, adjustments are made in the machine so that the thickness of the slices can be selectively managed. After being placed into a vertical position and fed through a washing brush assembly, the cut slices are discharged for packing and further processing.

How Will Growth Unfold in India Meat Cutting Machine Market?

Rapid Surge in Non-Vegetarian Population Driving Market in India

According to FMI, the meat cutting machine market in India is expected to grow at a robust pace during the next ten years, owing to the rapidly rising non-veg population, increasing adoption of advanced machinery by meat processing companies, and favorable government support.

India's meat production is predicted to increase rapidly, placing it 5th in terms of volume. India produces a significant amount of the world's meat and is among the leading exporters of meat.

The meat processing sector has been steadily increasing in recent years. It is very good for giving reasonable returns to producers. Beef and pork are nutrient-dense meats that are very affordable in India. Non-vegetarians make up virtually the whole population of India. India's per capita meat consumption is expanding every year. The most popular foods are chicken and fish.

Thus, growing production and consumption of these non-veg products are expected to drive the Indian meat cutting machine market swiftly during the forecast period.

What Makes China a Lucrative Meat Cutting Machine Market?

Rising Consumption of Meat Products to Propel Demand in China

The meat cutting machine market in China is anticipated to expand at a healthy CAGR of 8.4% between 2023 and 2033, making it one of the most lucrative markets across East Asia. Rising meat consumption, easy availability of advanced meat cutting machines at lower prices, and rapid expansion of end-use sectors are driving sales of meat cutting machines in China.

According to FMI, Chinese clients consume a substantial percentage of global meat, with pork being the most popular. With meat becoming more popular, the country is investing considerably in growing its pig production to meet increased domestic demand. This will swiftly drive the meat cutting machine forward in the country.
Category-wise Insights

Which is the Most Popular Equipment in the Meat Cutting Machine Market?

Demand Remains High for Meat Slicers

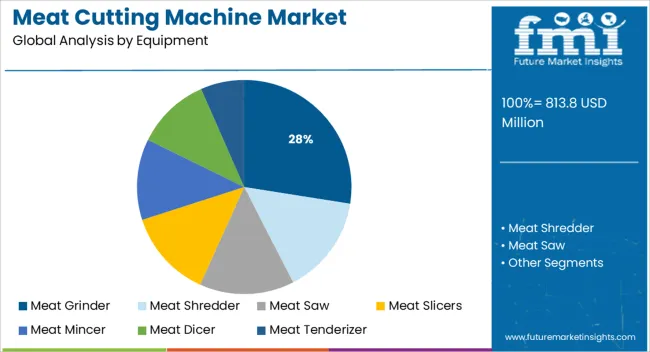
By equipment, the global meat cutting machine market is segmented into meat shredder, meat grinder, meat saw, meat slicers, meat mincer, meat dicer, and meat tenderizer.

Among these, the meat slicers segment accounts for the largest revenue share and it is expected to grow at a robust CAGR during the next ten years. This can be attributed to the rising adoption of meat slicers across various end-use industries and the growing demand for convenience foods.

Meat slicers are tools used across various sectors to slice meats, sausages, cheese, fish, and several other products. These machines help end users easily cut or slice meat into various forms. They have become an ideal alternative to hand-cutting due to their better precision, reliability, and efficiency.

Investing in equipment that assists end users in meeting the demand for precise meat cuts is expected to further push sales of meat slicers during the forecast period.

Get the data you need at a Fraction of the cost

Personalize your report by choosing insights you need
and save 40%!

Competitive Landscape

The quickly changing technical environment is prompting key players to upgrade their product portfolio regularly. As a result, they are introducing new and advanced meat cutting machines with higher efficiencies. Besides this, they are adopting strategies such as partnerships, mergers, acquisitions, and collaborations to expand their global footprint. For instance,

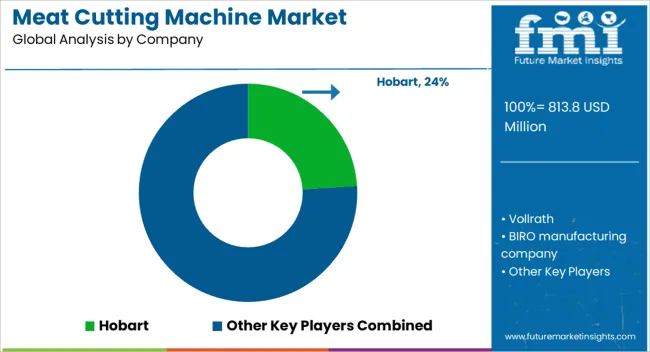
  • In October 2019, Hobart, the premium commercial food equipment manufacturer, launched a new Hobart 6801-IP meat saw for food service and retail spaces.
  • In August 2022, Hobart announced an enhancement to its 6614 meat saw to increase operator convenience. The company added an integrated meat pusher attachment to its meat saw.
  • In 2021, Meat! Your Maker launched two new meat grinders compatible with all kinds of meat. The new products include a .75 HP Grinder and a 1 HP Grinder.

Meat Cutting Machine Market Report Scope

Attribute Details
Estimated Market Size (2023) US$ 687.5 Million
Projected Market Size (2033) US$ 749 Million
Anticipated Growth Rate (2023 to 2033) 8.8% CAGR
Forecast Period 2018 to 2022
Historical Data Available for 2023 to 2033
Market Analysis US$ Million for Value and Units for Volume
Key Regions Covered
  • North America
  • Europe
  • Asia Pacific
  • South America
  • Middle East and Africa (MEA)
Key Countries Covered
  • USA
  • Canada
  • Germany
  • UK
  • France
  • Italy
  • Russia
  • Turkey
  • Spain
  • China
  • Japan
  • Korea
  • India
  • Indonesia
  • Thailand
  • Philippines
  • Malaysia
  • Vietnam
  • South Korea
  • Australia
  • Brazil
  • Argentina
  • Colombia
  • South Africa
  • UAE
  • Egypt
  • Nigeria
  • South Africa
Key Segments Covered
  • Equipment
  • Automation
  • End User
  • Region
Key Companies Profiled
  • Hobart
  • Vollrath
  • BIRO manufacturing company
  • Sirman
  • Weston
  • Hebeichengye Intelligent Technology Co.Ltd.
  • BRESCO INDIA
  • Weber machinenbau gmbh
  • Poly-clip system gmbh & co.
  • One-stop engineering
  • Rex Technologies
  • American Foods Group LLC
  • Arise Equipment India
  • Javvad Enterprises.
  • Bani C/O Jaideep Engineers
  • Bharti Refrigeration Works
  • SRS Equipments
  • Zigma Machinery and Equipment Solution
  • D.C Ananda Exporter
  • Aarul Industries India Private Limited
  • Unitech Exports
  • Henan Penghui Machinery and Equipment CO.Ltd
Report Coverage Market Forecast, Company Share Analysis, Competitive Landscape, Drivers, Restraints, Opportunities and Threats Analysis, Market Dynamics and Challenges, and Strategic Growth Initiatives

Meat Cutting Machine Market by Category

By Equipment:

  • Meat Shredder
  • Meat Grinder
  • Meat Saw
  • Meat Slicers
  • Meat Mincer
  • Meat Dicer
  • Meat Tenderizer

By Automation:

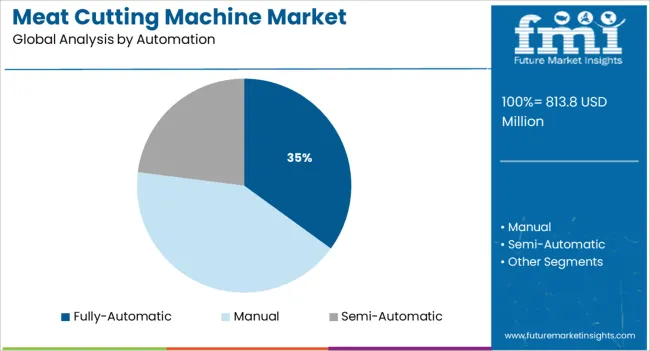
  • Manual
  • Semi-Automatic
  • Fully-Automatic

By End User:

  • Meat processing Industries
  • Restaurants
  • Slaughter Houses
  • Household
  • Caterers

By Region:

  • North America
  • Latin America
  • Europe
  • Asia Pacific
  • Middle East and Africa (MEA)

Frequently Asked Questions

What is the current size of meat cutting machine market?

The global meat cutting machines market size is expected to reach US$ 687.5 Million in 2023.

At what rate will the global meat cutting machine market grow during the forecast period?

As per FMI, the global meat cutting machine market is expected to grow at a CAGR of 8.8% during the projected period (2023 to 2033).

What is the projected valuation for the meat cutting machine market?

The worldwide meat cutting machine market is anticipated to surpass a valuation of US$ 749 Million by 2033.

What is the North America meat cutting machine market outlook?

The North America meat cutting machines market is expected to register a CAGR of 6.7% between 2023 and 2033.

Which are the major countries driving demand for meat cutting machines?

The USA, China, the UK, France, and Germany, are the major countries driving demand for meat cutting machines.

At what rate will the China meat cutting machine market grow?

China’s Meat cutting machines market is projected to grow at a CAGR of around 8.4% over the next ten years.

What is the demand outlook for Germany meat cutting machine market?

Demand for meat cutting machines in Germany is projected to grow at a CAGR of around 7% between 2023 and 2033.

How will growth unfold in Europe meat cutting machine market?

The meat cutting machine market in Europe is expected to grow at 5.6% CAGR between 2023 and 2033.

Who are the top 5 players operating in meat cutting machine market?

JBS USA Holdings Inc., Tyson Foods Inc., Cargill Meat Solution Corp., SYSCO Corp., and Smithfield Foods Inc. are the top 5 players operating in the meat cutting machine market.

At what rate will the Mexico meat cutting machine market grow?

Mexico meat cutting machines market is projected to grow at a CAGR of around 4.2% over the next ten years.

Table of Content
1. Executive Summary | Meat Cutting Machine Market
    1.1. Global Market Outlook
    1.2. Demand-side Trends
    1.3. Supply-side Trends
    1.4. Technology Roadmap Analysis
    1.5. Analysis and Recommendations
2. Market Overview
    2.1. Market Coverage / Taxonomy
    2.2. Market Definition / Scope / Limitations
3. Market Background
    3.1. Market Dynamics
        3.1.1. Drivers
        3.1.2. Restraints
        3.1.3. Opportunity
        3.1.4. Trends
    3.2. Scenario Forecast
        3.2.1. Demand in Optimistic Scenario
        3.2.2. Demand in Likely Scenario
        3.2.3. Demand in Conservative Scenario
    3.3. Product launches & Recent Developments
    3.4. Product Life Cycle Analysis
    3.5. Value Chain Analysis
        3.5.1. Supply Side Participants and their Roles
            3.5.1.1. Producers
            3.5.1.2. Mid-Level Participants (Traders/ Agents/ Brokers)
            3.5.1.3. Wholesalers and Distributors
        3.5.2. % of Operating Margin Analysis
        3.5.3. List of Raw Material Suppliers
        3.5.4. List of Existing and Potential Buyers
    3.6. Market - Pricing Analysis
        3.6.1. Price Point Assessment by Region
        3.6.2. Price Point Assessment by Product Type
        3.6.3. Price Forecast till 2033
        3.6.4. Factors affecting Pricing
    3.7. Forecast Factors - Relevance & Impact
    3.8. Regulatory Landscape
        3.8.1. Packaging & Labelling Regulations
        3.8.2. Certifications and Certifying Agency Overview
        3.8.3. Import/Export Policies
    3.9. Regional Parent Market Outlook
    3.10. Consumers Survey Analysis
    3.11. Macro-Economic Factors
    3.12. Product Claims & Nutritional Information scanned by Buyers
4. Global Market Analysis 2018 to 2022 and Forecast, 2023 to 2033
    4.1. Historical Market Size Value (US$ Million) & Volume (MT) Analysis, 2018 to 2022
    4.2. Current and Future Market Size Value (US$ Million) & Volume (MT) Projections, 2023 to 2033
        4.2.1. Y-o-Y Growth Trend Analysis
        4.2.2. Absolute $ Opportunity Analysis
5. Global Market Analysis 2018 to 2022 and Forecast 2023 to 2033, By Equipment
    5.1. Introduction / Key Findings
    5.2. Historical Market Size Value (US$ Million) & Volume (MT) Analysis By Equipment, 2018 to 2022
    5.3. Current and Future Market Size Value (US$ Million) & Volume (MT) Analysis and Forecast By Equipment, 2023 to 2033
        5.3.1. Meat Shredder
        5.3.2. Meat Grinder
        5.3.3. Meat Saw
        5.3.4. Meat Slicers
        5.3.5. Meat Mincer
        5.3.6. Meat Dicer
        5.3.7. Meat Tenderizer
    5.4. Y-o-Y Growth Trend Analysis By Equipment, 2018 to 2022
    5.5. Absolute $ Opportunity Analysis By Equipment, 2023 to 2033
6. Global Market Analysis 2018 to 2022 and Forecast 2023 to 2033, By Automation
    6.1. Introduction / Key Findings
    6.2. Historical Market Size Value (US$ Million) & Volume (MT) Analysis By Automation, 2018 to 2022
    6.3. Current and Future Market Size Value (US$ Million) & Volume (MT) Analysis and Forecast By Automation, 2023 to 2033
        6.3.1. Manual
        6.3.2. Semi-Automatic
        6.3.3. Fully-Automatic
    6.4. Y-o-Y Growth Trend Analysis By Automation, 2018 to 2022
    6.5. Absolute $ Opportunity Analysis By Automation, 2023 to 2033
7. Global Market Analysis 2018 to 2022 and Forecast 2023 to 2033, By End User
    7.1. Introduction / Key Findings
    7.2. Historical Market Size Value (US$ Million) & Volume (MT) Analysis By End User, 2018 to 2022
    7.3. Current and Future Market Size Value (US$ Million) & Volume (MT) Analysis and Forecast By End User, 2023 to 2033
        7.3.1. Meat Processing Industries
        7.3.2. Restaurants
        7.3.3. Slaughter Houses
        7.3.4. Household
        7.3.5. Caterers
    7.4. Y-o-Y Growth Trend Analysis By End User, 2018 to 2022
    7.5. Absolute $ Opportunity Analysis By End User, 2023 to 2033
8. Global Market Analysis 2018 to 2022 and Forecast 2023 to 2033, By Region
    8.1. Introduction
    8.2. Historical Market Size Value (US$ Million) & Volume (MT) Analysis By Region, 2018 to 2022
    8.3. Current Market Size Value (US$ Million) & Volume (MT) Analysis and Forecast By Region, 2023 to 2033
        8.3.1. North America
        8.3.2. Latin America
        8.3.3. Europe
        8.3.4. East Asia
        8.3.5. South Asia
        8.3.6. Oceania
        8.3.7. Middle East and Africa (MEA)
    8.4. Market Attractiveness Analysis By Region
9. North America Market Analysis 2018 to 2022 and Forecast 2023 to 2033, By Country
    9.1. Historical Market Size Value (US$ Million) & Volume (MT) Trend Analysis By Market Taxonomy, 2018 to 2022
    9.2. Market Size Value (US$ Million) & Volume (MT) Forecast By Market Taxonomy, 2023 to 2033
        9.2.1. By Country
            9.2.1.1. United States of America
            9.2.1.2. Canada
        9.2.2. By Equipment
        9.2.3. By Automation
        9.2.4. By End User
    9.3. Market Attractiveness Analysis
        9.3.1. By Country
        9.3.2. By Equipment
        9.3.3. By Automation
        9.3.4. By End User
    9.4. Key Takeaways
10. Latin America Market Analysis 2018 to 2022 and Forecast 2023 to 2033, By Country
    10.1. Historical Market Size Value (US$ Million) & Volume (MT) Trend Analysis By Market Taxonomy, 2018 to 2022
    10.2. Market Size Value (US$ Million) & Volume (MT) Forecast By Market Taxonomy, 2023 to 2033
        10.2.1. By Country
            10.2.1.1. Brazil
            10.2.1.2. Mexico
            10.2.1.3. Argentina
            10.2.1.4. Chile
            10.2.1.5. Peru
            10.2.1.6. Rest of Latin America
        10.2.2. By Equipment
        10.2.3. By Automation
        10.2.4. By End User
    10.3. Market Attractiveness Analysis
        10.3.1. By Country
        10.3.2. By Equipment
        10.3.3. By Automation
        10.3.4. By End User
    10.4. Key Takeaways
11. Europe Market Analysis 2018 to 2022 and Forecast 2023 to 2033, By Country
    11.1. Historical Market Size Value (US$ Million) & Volume (MT) Trend Analysis By Market Taxonomy, 2018 to 2022
    11.2. Market Size Value (US$ Million) & Volume (MT) Forecast By Market Taxonomy, 2023 to 2033
        11.2.1. By Country
            11.2.1.1. Germany
            11.2.1.2. Italy
            11.2.1.3. France
            11.2.1.4. United Kingdom
            11.2.1.5. Spain
            11.2.1.6. Russia
            11.2.1.7. BENELUX
            11.2.1.8. Poland
            11.2.1.9. Nordic Countries
            11.2.1.10. Rest of Europe
        11.2.2. By Equipment
        11.2.3. By Automation
        11.2.4. By End User
    11.3. Market Attractiveness Analysis
        11.3.1. By Country
        11.3.2. By Equipment
        11.3.3. By Automation
        11.3.4. By End User
    11.4. Key Takeaways
12. East Asia Market Analysis 2018 to 2022 and Forecast 2023 to 2033, By Country
    12.1. Historical Market Size Value (US$ Million) & Volume (MT) Trend Analysis By Market Taxonomy, 2018 to 2022
    12.2. Market Size Value (US$ Million) & Volume (MT) Forecast By Market Taxonomy, 2023 to 2033
        12.2.1. By Country
            12.2.1.1. China
            12.2.1.2. Japan
            12.2.1.3. South Korea
        12.2.2. By Equipment
        12.2.3. By Automation
        12.2.4. By End User
    12.3. Market Attractiveness Analysis
        12.3.1. By Country
        12.3.2. By Equipment
        12.3.3. By Automation
        12.3.4. By End User
    12.4. Key Takeaways
13. South Asia Market Analysis 2018 to 2022 and Forecast 2023 to 2033, By Country
    13.1. Historical Market Size Value (US$ Million) & Volume (MT) Trend Analysis By Market Taxonomy, 2018 to 2022
    13.2. Market Size Value (US$ Million) & Volume (MT) Forecast By Market Taxonomy, 2023 to 2033
        13.2.1. By Country
            13.2.1.1. India
            13.2.1.2. Thailand
            13.2.1.3. Malaysia
            13.2.1.4. Indonesia
            13.2.1.5. Rest of South Asia
        13.2.2. By Equipment
        13.2.3. By Automation
        13.2.4. By End User
    13.3. Market Attractiveness Analysis
        13.3.1. By Country
        13.3.2. By Equipment
        13.3.3. By Automation
        13.3.4. By End User
    13.4. Key Takeaways
14. Oceania Market Analysis 2018 to 2022 and Forecast 2023 to 2033, By Country
    14.1. Historical Market Size Value (US$ Million) & Volume (MT) Trend Analysis By Market Taxonomy, 2018 to 2022
    14.2. Market Size Value (US$ Million) & Volume (MT) Forecast By Market Taxonomy, 2023 to 2033
        14.2.1. By Country
            14.2.1.1. Australia
            14.2.1.2. New Zealand
        14.2.2. By Equipment
        14.2.3. By Automation
        14.2.4. By End User
    14.3. Market Attractiveness Analysis
        14.3.1. By Country
        14.3.2. By Equipment
        14.3.3. By Automation
        14.3.4. By End User
    14.4. Key Takeaways
15. MEA Market Analysis 2018 to 2022 and Forecast 2023 to 2033, By Country
    15.1. Historical Market Size Value (US$ Million) & Volume (MT) Trend Analysis By Market Taxonomy, 2018 to 2022
    15.2. Market Size Value (US$ Million) & Volume (MT) Forecast By Market Taxonomy, 2023 to 2033
        15.2.1. By Country
            15.2.1.1. GCC Countries
            15.2.1.2. South Africa
            15.2.1.3. Central Africa
            15.2.1.4. North Africa
        15.2.2. By Equipment
        15.2.3. By Automation
        15.2.4. By End User
    15.3. Market Attractiveness Analysis
        15.3.1. By Country
        15.3.2. By Equipment
        15.3.3. By Automation
        15.3.4. By End User
    15.4. Key Takeaways
16. Key Countries Market Analysis
    16.1. United States of America
        16.1.1. Pricing Analysis
        16.1.2. Market Share Analysis, 2023
            16.1.2.1. By Equipment
            16.1.2.2. By Automation
            16.1.2.3. By End User
    16.2. Canada
        16.2.1. Pricing Analysis
        16.2.2. Market Share Analysis, 2023
            16.2.2.1. By Equipment
            16.2.2.2. By Automation
            16.2.2.3. By End User
    16.3. Brazil
        16.3.1. Pricing Analysis
        16.3.2. Market Share Analysis, 2023
            16.3.2.1. By Equipment
            16.3.2.2. By Automation
            16.3.2.3. By End User
    16.4. Mexico
        16.4.1. Pricing Analysis
        16.4.2. Market Share Analysis, 2023
            16.4.2.1. By Equipment
            16.4.2.2. By Automation
            16.4.2.3. By End User
    16.5. Argentina
        16.5.1. Pricing Analysis
        16.5.2. Market Share Analysis, 2023
            16.5.2.1. By Equipment
            16.5.2.2. By Automation
            16.5.2.3. By End User
    16.6. Chile
        16.6.1. Pricing Analysis
        16.6.2. Market Share Analysis, 2023
            16.6.2.1. By Equipment
            16.6.2.2. By Automation
            16.6.2.3. By End User
    16.7. Peru
        16.7.1. Pricing Analysis
        16.7.2. Market Share Analysis, 2023
            16.7.2.1. By Equipment
            16.7.2.2. By Automation
            16.7.2.3. By End User
    16.8. Germany
        16.8.1. Pricing Analysis
        16.8.2. Market Share Analysis, 2023
            16.8.2.1. By Equipment
            16.8.2.2. By Automation
            16.8.2.3. By End User
    16.9. Italy
        16.9.1. Pricing Analysis
        16.9.2. Market Share Analysis, 2023
            16.9.2.1. By Equipment
            16.9.2.2. By Automation
            16.9.2.3. By End User
    16.10. France
        16.10.1. Pricing Analysis
        16.10.2. Market Share Analysis, 2023
            16.10.2.1. By Equipment
            16.10.2.2. By Automation
            16.10.2.3. By End User
    16.11. Spain
        16.11.1. Pricing Analysis
        16.11.2. Market Share Analysis, 2023
            16.11.2.1. By Equipment
            16.11.2.2. By Automation
            16.11.2.3. By End User
    16.12. United Kingdom
        16.12.1. Pricing Analysis
        16.12.2. Market Share Analysis, 2023
            16.12.2.1. By Equipment
            16.12.2.2. By Automation
            16.12.2.3. By End User
    16.13. Russia
        16.13.1. Pricing Analysis
        16.13.2. Market Share Analysis, 2023
            16.13.2.1. By Equipment
            16.13.2.2. By Automation
            16.13.2.3. By End User
    16.14. Poland
        16.14.1. Pricing Analysis
        16.14.2. Market Share Analysis, 2023
            16.14.2.1. By Equipment
            16.14.2.2. By Automation
            16.14.2.3. By End User
    16.15. BENELUX
        16.15.1. Pricing Analysis
        16.15.2. Market Share Analysis, 2023
            16.15.2.1. By Equipment
            16.15.2.2. By Automation
            16.15.2.3. By End User
    16.16. Nordic Countries
        16.16.1. Pricing Analysis
        16.16.2. Market Share Analysis, 2023
            16.16.2.1. By Equipment
            16.16.2.2. By Automation
            16.16.2.3. By End User
    16.17. China
        16.17.1. Pricing Analysis
        16.17.2. Market Share Analysis, 2023
            16.17.2.1. By Equipment
            16.17.2.2. By Automation
            16.17.2.3. By End User
    16.18. Japan
        16.18.1. Pricing Analysis
        16.18.2. Market Share Analysis, 2023
            16.18.2.1. By Equipment
            16.18.2.2. By Automation
            16.18.2.3. By End User
    16.19. South Korea
        16.19.1. Pricing Analysis
        16.19.2. Market Share Analysis, 2023
            16.19.2.1. By Equipment
            16.19.2.2. By Automation
            16.19.2.3. By End User
    16.20. India
        16.20.1. Pricing Analysis
        16.20.2. Market Share Analysis, 2023
            16.20.2.1. By Equipment
            16.20.2.2. By Automation
            16.20.2.3. By End User
    16.21. Thailand
        16.21.1. Pricing Analysis
        16.21.2. Market Share Analysis, 2023
            16.21.2.1. By Equipment
            16.21.2.2. By Automation
            16.21.2.3. By End User
    16.22. Indonesia
        16.22.1. Pricing Analysis
        16.22.2. Market Share Analysis, 2023
            16.22.2.1. By Equipment
            16.22.2.2. By Automation
            16.22.2.3. By End User
    16.23. Malaysia
        16.23.1. Pricing Analysis
        16.23.2. Market Share Analysis, 2023
            16.23.2.1. By Equipment
            16.23.2.2. By Automation
            16.23.2.3. By End User
    16.24. Singapore
        16.24.1. Pricing Analysis
        16.24.2. Market Share Analysis, 2023
            16.24.2.1. By Equipment
            16.24.2.2. By Automation
            16.24.2.3. By End User
    16.25. GCC Countries
        16.25.1. Pricing Analysis
        16.25.2. Market Share Analysis, 2023
            16.25.2.1. By Equipment
            16.25.2.2. By Automation
            16.25.2.3. By End User
    16.26. South Africa
        16.26.1. Pricing Analysis
        16.26.2. Market Share Analysis, 2023
            16.26.2.1. By Equipment
            16.26.2.2. By Automation
            16.26.2.3. By End User
    16.27. Central Africa
        16.27.1. Pricing Analysis
        16.27.2. Market Share Analysis, 2023
            16.27.2.1. By Equipment
            16.27.2.2. By Automation
            16.27.2.3. By End User
    16.28. North Africa
        16.28.1. Pricing Analysis
        16.28.2. Market Share Analysis, 2023
            16.28.2.1. By Equipment
            16.28.2.2. By Automation
            16.28.2.3. By End User
17. Market Structure Analysis
    17.1. Competition Dashboard
    17.2. Competition Benchmarking
    17.3. Market Share Analysis of Top Players
        17.3.1. By Regional
        17.3.2. By Equipment
        17.3.3. By Automation
        17.3.4. By End User
18. Competition Analysis
    18.1. Competition Deep Dive
        18.1.1. Hobart
            18.1.1.1. Overview
            18.1.1.2. Product Portfolio
            18.1.1.3. Profitability by Market Segments
            18.1.1.4. Sales Footprint
            18.1.1.5. Strategy Overview
                18.1.1.5.1. Marketing Strategy
                18.1.1.5.2. Product Strategy
                18.1.1.5.3. Channel Strategy
        18.1.2. Vollrath
            18.1.2.1. Overview
            18.1.2.2. Product Portfolio
            18.1.2.3. Profitability by Market Segments
            18.1.2.4. Sales Footprint
            18.1.2.5. Strategy Overview
                18.1.2.5.1. Marketing Strategy
                18.1.2.5.2. Product Strategy
                18.1.2.5.3. Channel Strategy
        18.1.3. BIRO manufacturing company
            18.1.3.1. Overview
            18.1.3.2. Product Portfolio
            18.1.3.3. Profitability by Market Segments
            18.1.3.4. Sales Footprint
            18.1.3.5. Strategy Overview
                18.1.3.5.1. Marketing Strategy
                18.1.3.5.2. Product Strategy
                18.1.3.5.3. Channel Strategy
        18.1.4. Sirman
            18.1.4.1. Overview
            18.1.4.2. Product Portfolio
            18.1.4.3. Profitability by Market Segments
            18.1.4.4. Sales Footprint
            18.1.4.5. Strategy Overview
                18.1.4.5.1. Marketing Strategy
                18.1.4.5.2. Product Strategy
                18.1.4.5.3. Channel Strategy
        18.1.5. Weston
            18.1.5.1. Overview
            18.1.5.2. Product Portfolio
            18.1.5.3. Profitability by Market Segments
            18.1.5.4. Sales Footprint
            18.1.5.5. Strategy Overview
                18.1.5.5.1. Marketing Strategy
                18.1.5.5.2. Product Strategy
                18.1.5.5.3. Channel Strategy
        18.1.6. Hebeichengye Intelligent Technology Co.Ltd.
            18.1.6.1. Overview
            18.1.6.2. Product Portfolio
            18.1.6.3. Profitability by Market Segments
            18.1.6.4. Sales Footprint
            18.1.6.5. Strategy Overview
                18.1.6.5.1. Marketing Strategy
                18.1.6.5.2. Product Strategy
                18.1.6.5.3. Channel Strategy
        18.1.7. BRESCO INDIA
            18.1.7.1. Overview
            18.1.7.2. Product Portfolio
            18.1.7.3. Profitability by Market Segments
            18.1.7.4. Sales Footprint
            18.1.7.5. Strategy Overview
                18.1.7.5.1. Marketing Strategy
                18.1.7.5.2. Product Strategy
                18.1.7.5.3. Channel Strategy
        18.1.8. Weber machinenbau gmbh
            18.1.8.1. Overview
            18.1.8.2. Product Portfolio
            18.1.8.3. Profitability by Market Segments
            18.1.8.4. Sales Footprint
            18.1.8.5. Strategy Overview
                18.1.8.5.1. Marketing Strategy
                18.1.8.5.2. Product Strategy
                18.1.8.5.3. Channel Strategy
        18.1.9. Poly-clip system gmbh & co.
            18.1.9.1. Overview
            18.1.9.2. Product Portfolio
            18.1.9.3. Profitability by Market Segments
            18.1.9.4. Sales Footprint
            18.1.9.5. Strategy Overview
                18.1.9.5.1. Marketing Strategy
                18.1.9.5.2. Product Strategy
                18.1.9.5.3. Channel Strategy
        18.1.10. One-stop engineering
            18.1.10.1. Overview
            18.1.10.2. Product Portfolio
            18.1.10.3. Profitability by Market Segments
            18.1.10.4. Sales Footprint
            18.1.10.5. Strategy Overview
                18.1.10.5.1. Marketing Strategy
                18.1.10.5.2. Product Strategy
                18.1.10.5.3. Channel Strategy
        18.1.11. Rex Technologies
            18.1.11.1. Overview
            18.1.11.2. Product Portfolio
            18.1.11.3. Profitability by Market Segments
            18.1.11.4. Sales Footprint
            18.1.11.5. Strategy Overview
                18.1.11.5.1. Marketing Strategy
                18.1.11.5.2. Product Strategy
                18.1.11.5.3. Channel Strategy
19. Assumptions & Acronyms Used
20. Research Methodology

Explore Process Automation Insights

View Reports
Future Market Insights

Meat Cutting Machine Market

Schedule a Call