Meat Trays Market Size and Share Forecast Outlook 2025 to 2035

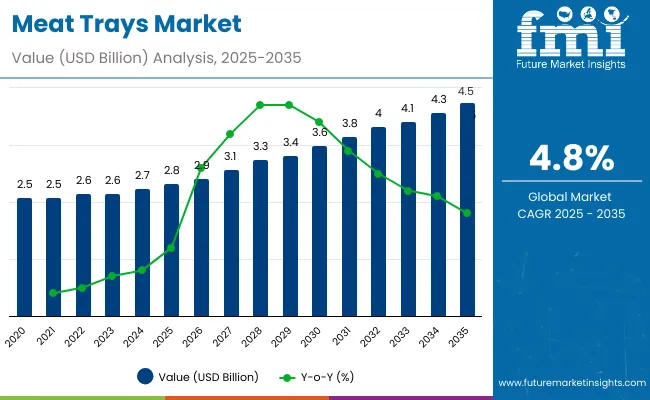
The meat trays market is forecast to expand from USD 2.8 billion in 2025 to USD 4.5 billion by 2035, gaining USD 1.7 billion over the decade. This represents a 60.7% increase, with the market advancing at a CAGR of 4.8%. Overall, the industry grows by a 1.6 multiple during the forecast window.
Quick Stats for Meat Trays Market

  • Market Value (2025): USD 2.8 billion
  • Market Forecast Value (2035): USD 4.5 billion
  • Market Forecast CAGR: 4.8%
  • Leading Segment in 2025: Supermarkets & Hypermarkets (42.6%)
  • Key Growth Regions: Asia-Pacific (China fastest at 4.9% CAGR)
  • Top Key Players: Elsepack, Cascades, HSQY Plastic Group, G-COVE, Solidus, Display Pack, Indepak, Packpro, BonitoPak, Global Sources Suppliers (OEMs)

Meat Trays Market

Metric Value
Industry Size (2025E) USD 2.8 billion
Industry Value (2035F) USD 4.5 billion
CAGR (2025 to 2035) 4.8%

From 2025 to 2030, the market climbs from USD 2.8 billion to USD 3.6 billion, contributing USD 0.8 billion or 47.1% of decade growth. This phase is influenced by food safety regulations, rising packaged meat consumption, and strong cold-chain distribution. PET and MAP trays dominate adoption for durability and extended freshness.

Between 2030 and 2035, the market rises from USD 3.6 billion to USD 4.5 billion, adding USD 0.9 billion or 52.9% of growth. Sustainability and innovation define this period, with moldedfiber and biodegradable trays gaining prominence. Retail sustainability commitments and branding improvements reinforce long-term demand for eco-friendly and high-performance tray solutions.

From 2020 to 2024, the meat trays market grew steadily as packaged meat penetration rose, retailers standardized shelf-ready formats, and safety regulations tightened. A large share of revenues came from PET and MAP solutions led by supermarket programs and processor partnerships. Leaders emphasized barrier strength, recyclability, sealing integrity, and cold-chain performance. Differentiation centered on light weighting, clarity, and retail branding, while ovenable and compostable formats scaled selectively. Service-led audits and certifications contributed a smaller revenue share versus direct tray procurement.

By 2035, the market will reach USD 4.5 billion at 4.8% CAGR, with recyclable PET, hybrid barrier trays, and fiber-based solutions accounting for a rising portion of value. Competition will intensify as providers pair trays with automation-ready sealing lines and digital traceability. Established players will diversify into moldedfiber and mono-material designs, while regional entrants gain share with cost-efficient, retail-compliant formats tailored to poultry, red meat, and seafood distribution.

Why is the Meat Trays Market Growing?

The global meat trays market is expanding due to heightened emphasis on food safety, hygiene, and shelf-life extension. PET and MAP trays lead growth because of barrier properties, durability, and compliance with international safety standards. Retail penetration, cold-chain expansion, and rising consumer demand for packaged red meat and poultry reinforce market adoption.

Sustainability is an added driver, with moldedfiber and compostable trays gaining traction in developed markets. Lightweight designs, recyclable multilayer films, and digital branding improve functionality and visibility. Growing packaged food sales, coupled with eco-conscious regulations, further strengthen adoption across supermarkets and food processors globally.

Segmental Overview

The meat trays market is segmented based on material, tray type, application, distribution channel, and end-use industry. The material segment includes polyethylene terephthalate, polyvinyl chloride, polypropylene, polystyrene, moldedfiber, and aluminum, each offering unique benefits such as clarity, durability, and sustainability. Tray types comprise standard trays, modified atmosphere packaging trays, vacuum skin packaging trays, dual-ovenable trays, and biodegradable or compostable trays, supporting diverse industry needs.

Applications include fresh red meat, processed meat, poultry, and seafood, which represent the major packaged food categories. Distribution channels consist of supermarkets and hypermarkets, convenience stores, butcher shops, and online retail. End-use industries encompass food processing companies, retail and supermarkets, and the foodservice sector, where trays enable branding, compliance, and efficiency.
PET Leads with Barrier Properties and Safety Compliance

Meat Trays Market By Material

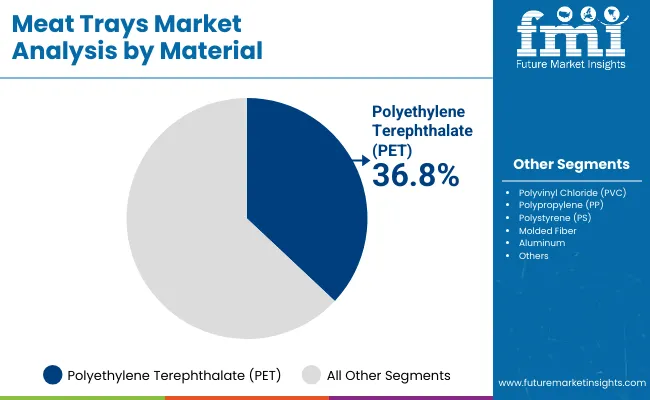
PET trays are projected to represent 36.8% of the market in 2025. Their high clarity, strength, and recyclability position them as the most reliable choice for packaged meat applications. PET offers excellent oxygen barrier properties, ensuring product freshness and safety while providing tamper resistance. This makes them especially valuable for red meat and poultry categories where shelf life and hygiene are critical.

The growth of PET trays is also supported by compatibility with automated sealing lines and recycling systems. Retailers value PET formats for consistent branding and shelf-ready presentation, aligning with sustainability targets. As regulations tighten around non-recyclable plastics, PET’s circular economy alignment ensures it retains leadership. Long-term resilience is reinforced by ongoing innovations in lightweighting and mono-material solutions.
MAP Trays Dominate with Shelf-Life Extension

Meat Trays Market By Tray

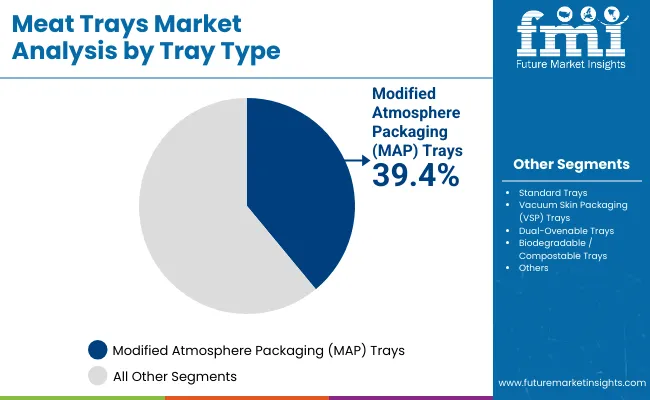
MAP trays are forecast to capture 39.4% of the market in 2025 due to their ability to extend freshness and maintain quality. By modifying internal atmospheres, these trays reduce spoilage and help stabilize color, flavor, and texture. The technology allows long-distance distribution, reducing waste and improving food safety compliance, which benefits both retailers and processors globally.

Adoption of MAP trays is further enhanced by expansion of cold-chain logistics, particularly in Asia-Pacific and Latin America. Supermarkets prefer MAP solutions for consistent performance and reduced shrinkage. Their role in maintaining freshness directly contributes to profitability by cutting waste. Combined with consumer demand for safe, high-quality packaged meat, MAP trays will continue to hold dominance in this segment.
Fresh Red Meat Holds Leading Application Share

Meat Trays Market By Application

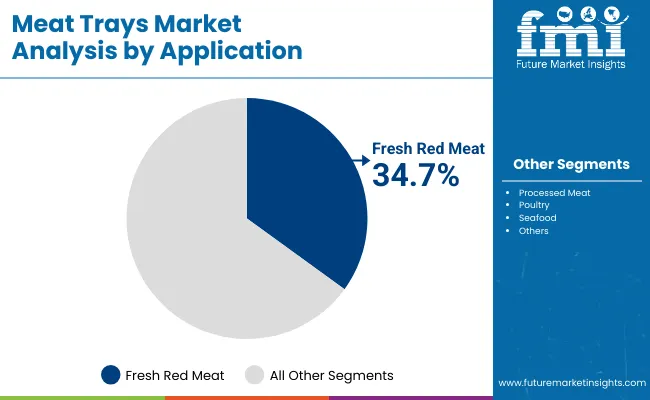
Fresh red meat is expected to account for 34.7% of the market in 2025. The segment benefits from rising consumer demand for hygienically packaged meat with extended shelf life. PET and MAP trays dominate adoption in this category due to their ability to ensure freshness, maintain quality, and prevent contamination. Stringent hygiene regulations also reinforce the reliance on advanced tray formats for red meat packaging.

The expansion of premium retail channels further drives tray use in this category. Supermarkets emphasize tray-based packaging for red meat to sustain margins and attract quality-conscious consumers. As urbanization and cold-chain distribution improve in developing regions, red meat tray demand will continue to expand. This makes fresh red meat the most resilient and profitable application within the global market.
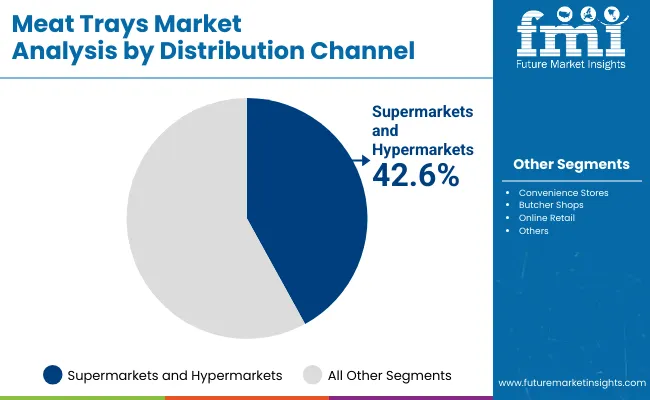
Supermarkets & Hypermarkets Retain Distribution Leadership

Meat Trays Market By Distribution

Supermarkets and hypermarkets are projected to account for 42.6% of demand in 2025. Their large-scale operations rely heavily on standardized packaging formats for efficiency, branding, and compliance. Supermarkets adopt PET and MAP trays to guarantee hygiene, safety, and visual appeal, making them the leading distribution channel for packaged meat products globally.

Expansion of modern retail across Asia-Pacific and Latin America strengthens this dominance. Sustainability initiatives by global retailers are pushing suppliers to innovate with recyclable and moldedfiber trays. Their volume-based purchasing power allows them to influence packaging trends, reinforcing supermarkets and hypermarkets as the cornerstone of meat tray adoption through 2035.
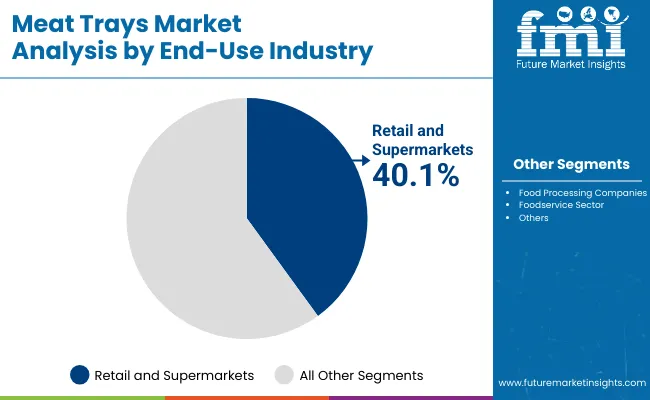
Retail & Supermarkets Dominate End-Use Demand

Meat Trays Market By End Use

Retail and supermarkets are expected to contribute 40.1% of demand in 2025. As the primary sellers of packaged meat, their adoption of trays ensures standardized presentation, freshness, and safety. Sustainability programs accelerate use of recyclable PET and moldedfiber, aligning with consumer preference for eco-friendly packaging. These factors secure their dominance in end-use demand.

Retailers also prioritize branding through advanced tray formats, integrating features like labeling compatibility and high-clarity designs. Their focus on sustainability and efficiency ensures they continue shaping innovation in the market. With high purchasing capacity and direct consumer interaction, supermarkets will remain the largest end-use industry in meat trays throughout the forecast horizon.

Drivers, Restraints, and Key Trends of the Meat Trays Market

Efficiency Gains, Food Safety, and Shelf-Life Drive Adoption

Trays improve efficiency by extending freshness, preventing contamination, and enabling longer distribution cycles. PET and MAP dominate for reliability and compliance with safety standards. Retail expansion and urbanization reinforce adoption, especially in emerging economies where demand for packaged red meat and poultry is accelerating.

High Costs, Plastic Regulations, and Waste Concerns Limit Growth

Adoption of moldedfiber and biodegradable trays is slowed by higher costs compared to PS or PVC. Raw material price fluctuations impact profitability. Regulatory restrictions on plastics increase compliance burdens, particularly for smaller processors. These factors restrain adoption in cost-sensitive regions, even as sustainability pressures rise.

Eco-Friendly Innovations, Branding, and Automation Define Trends

Moldedfiber and compostable trays are gaining visibility, driven by retailer sustainability commitments. Lightweight designs reduce material use without compromising safety. Digital printing enhances branding and consumer engagement. Automation and high-speed tray production improve cost efficiency, ensuring scalability. These trends highlight the market’s shift toward sustainable, innovative, and consumer-focused packaging solutions.
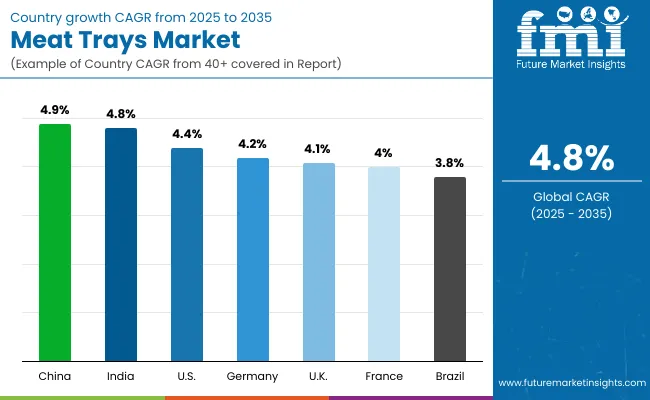
Analysis of Meat Trays Market by Key Countries

Meat Trays Market By Country

The global meat trays market is witnessing steady expansion, supported by hygiene-focused regulations, retail standardization, and sustainability goals. Asia-Pacific leads growth, with China and India driving rapid adoption through retail modernization and poultry demand. Developed markets such as the USA, Germany, and Japan focus on recyclable PET, moldedfiber, and MAP tray innovation to comply with strict environmental mandates and consumer expectations for safe, high-performance packaging solutions.
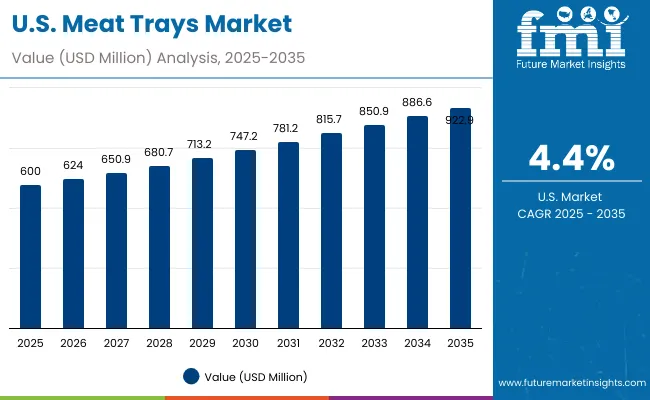
United States Sales Outlook

Meat Trays Market Usa

The USA meat trays market is expected to grow at a CAGR of 4.4% between 2025 and 2035, driven by widespread packaged meat consumption, advanced retail chains, and regulatory mandates for food safety. Growing consumer demand for branded, high-quality trays reinforces PET and MAP formats. Supermarkets and hypermarkets remain dominant due to scale and stringent compliance requirements.
  • PET trays ensure recyclable compliance in supermarkets.
  • MAP formats extend shelf life of red meat and poultry.
  • Retailers adopt branded trays for premium meat sales.

Germany Growth Outlook

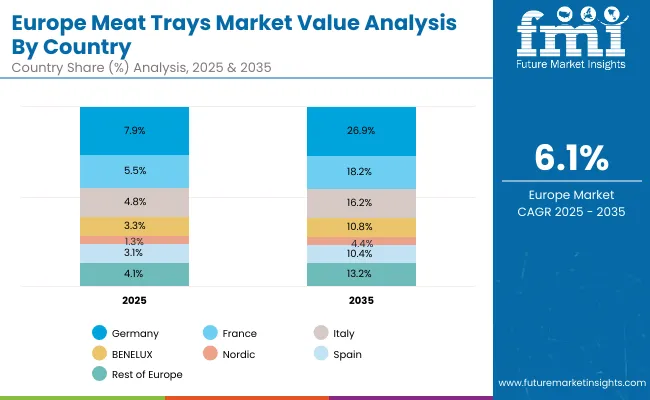
Meat Trays Market Europe

Germany’s market will expand at a CAGR of 4.2% during 2025-2035. Strong sustainability commitments, strict regulations, and advanced retail penetration drive tray adoption. German supermarkets focus on replacing plastics with moldedfiber and recyclable PET solutions. MAP trays dominate due to their shelf-life extension capabilities, aligning with the high-quality expectations of German consumers.

  • Biodegradable trays gain traction in premium meat packaging.
  • MAP trays dominate supermarket supply chains.
  • R&D efforts emphasize recyclable multilayer formats for compliance.

United Kingdom Expansion Outlook

The UK market is forecast to expand at a CAGR of 4.1%, influenced by leading supermarket initiatives in sustainable packaging. Strong consumer awareness accelerates demand for moldedfiber and MAP solutions. The emphasis is on hygienic presentation and compliance with regulations that favor recyclable and compostable tray solutions across poultry and red meat categories.

  • Moldedfiber trays replace plastics in supermarkets.
  • Poultry packaging heavily utilizes MAP tray formats.
  • Branding innovations enhance consumer appeal and shelf presence.

China Sales Outlook

China’s meat trays market will grow fastest at a CAGR of 4.9% through 2035. Rising urbanization, cold-chain infrastructure expansion, and retail modernization drive tray demand. The government’s food safety initiatives and consumer preference for packaged seafood and poultry reinforce PET and MAP tray adoption. Retailers are increasingly shifting to lightweight recyclable trays.

  • PET trays dominate red meat packaging formats.
  • MAP solutions ensure hygiene in seafood and poultry.
  • Lightweight recyclable trays gain adoption in retail chains.

India Growth Outlook

India’s market is projected to grow at 4.8% CAGR from 2025 to 2035. Rising poultry consumption, expanding supermarket networks, and affordability of PET and PP trays support growth. Urbanization accelerates adoption, while modern retail chains drive demand for trays that ensure freshness and affordability. Foodservice expansion further strengthens long-term prospects.

  • Affordable trays rise in popularity for supermarkets.
  • MAP systems extend product freshness for urban consumers.
  • Foodservice growth reinforces tray demand.

Japan Outlook

Japan’s market is set to expand at 4.0% CAGR during the forecast period. Strict hygiene standards, eco-friendly adoption, and seafood packaging demand support growth. Japanese consumers value recyclable PET and moldedfiber trays, particularly for seafood and premium meats. MAP trays play a strong role in reducing spoilage, aligning with the country’s strict food safety norms.

  • PET and moldedfiber trays dominate retail shelves.
  • MAP trays cut seafood spoilage risks.
  • Recycling mandates accelerate demand for sustainable formats.

South Korea Expansion Outlook

South Korea’s meat trays market will grow at a CAGR of 4.2%. Strong seafood consumption, modern retail penetration, and preference for convenience packaging drive demand. Compostable and moldedfiber trays are being integrated by retailers alongside MAP trays to meet sustainability targets while maintaining quality.
  • MAP trays dominate convenience-driven retail channels.
  • Retailers integrate compostable and moldedfiber options.
  • Branding and smart packaging enhance consumer engagement.

Analysis of Japan by Material

Meat Trays Market Japan

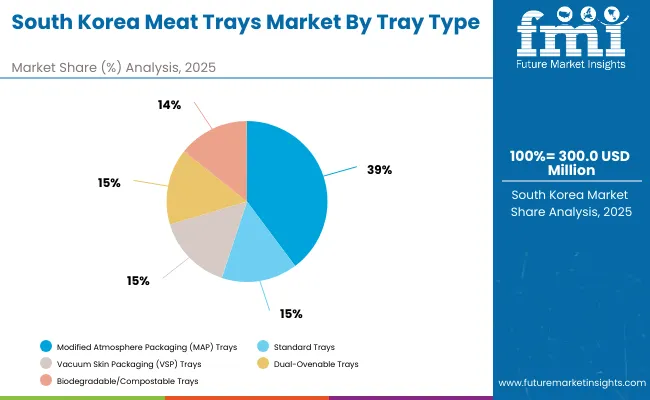
Japan’s meat trays market, valued at USD 400 million in 2025, is led by polyethylene terephthalate (PET), holding 35.3% share due to its durability, clarity, and recyclability. Polyvinyl chloride (PVC) follows with 16.1%, maintaining usage despite sustainability concerns. Polypropylene (PP) accounts for 15.2%, preferred for versatility and microwave compatibility. Polystyrene (PS) secures 13.8% as a cost-efficient material, while moldedfiber stands at 12.4%, reflecting growth in eco-friendly packaging. Aluminum contributes 7.2%, primarily for premium and ovenable tray applications. This mix reflects Japan’s balance between conventional plastics and emerging sustainable materials, aligning with regulatory and consumer-driven sustainability trends.
Analysis of South Korea by Tray Type

Meat Trays Market South Korea

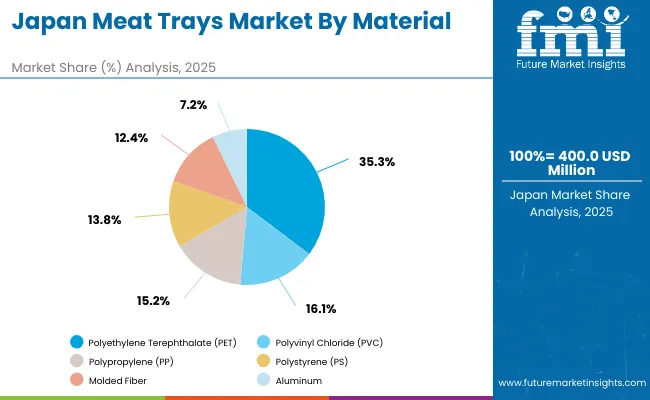
South Korea’s meat trays market, worth USD 300 million in 2025, is dominated by modified atmosphere packaging (MAP) trays with 38.6% share, driven by rising demand for extended shelf life and food safety. Standard trays follow at 15.0%, remaining relevant for cost-sensitive applications. Vacuum skin packaging (VSP) trays account for 14.9%, gaining popularity in premium meat preservation. Dual-ovenable trays represent 13.2%, meeting convenience-driven cooking needs. Biodegradable and compostable trays capture 11.3%, reflecting South Korea’s growing commitment to eco-friendly alternatives. The market showcases a clear tilt toward high-performance, technology-driven solutions while steadily incorporating sustainable options in response to environmental pressures.
Competitive Landscape of Meat Trays Market

Meat Trays Market By Company

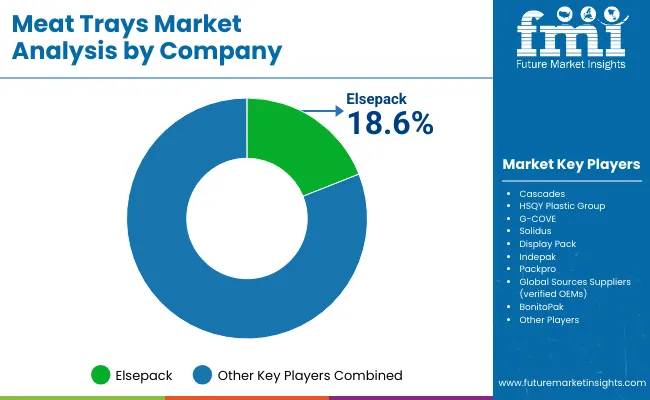
The meat trays market is moderately fragmented, with a balance of global leaders and regional specialists competing on performance, sustainability, and cost efficiency. Key companies such as Elsepack, Cascades, HSQY Plastic Group, and G-COVE dominate PET and MAP tray production, offering durability and compliance with safety standards. Solidus, Display Pack, and Indepak invest heavily in moldedfiber and biodegradable innovations, targeting eco-conscious European and North American markets.

Emerging suppliers like Packpro, BonitoPak, and Global Sources OEMs provide scalability and cost-efficient solutions, expanding tray availability for supermarkets and food processors worldwide. Competitive strategies increasingly emphasize lightweight designs, digital branding compatibility, and recyclability. Investment in automation and smart packaging further enhances tray performance. The competitive landscape reflects a shift toward sustainability, innovation, and retailer partnerships, ensuring companies that adapt quickly remain positioned for long-term growth.

Key Developments of Meat Trays Market

  • In 2024, CascadesLaunched a new recyclable PET tray line for meat and poultry, aimed at circularity targets and large retail programs, reinforcing portfolio breadth in high-clarity, food-contact compliant formats.
  • In 2023, SolidusIntroduced fiber-based barrier-coated trays for meat/seafood in Europe, combining moisture resistance with recyclability to align with tightening packaging regulations and retailer sustainability roadmaps.

Key Companies

  • Elsepack
  • Cascades
  • HSQY Plastic Group
  • G-COVE
  • Solidus
  • Display Pack
  • Indepak
  • Packpro
  • Global Sources Suppliers (verified OEMs)
  • BonitoPak

Scope of the Report

Item Value
Quantitative Units USD 2.8 Billion
By Material PET, PVC, PP, PS, Molded Fiber, Aluminum
By Tray Type Standard Trays, MAP Trays, VSP Trays, Dual- Ovenable Trays, Biodegradable/Compostable Trays
By Application Fresh Red Meat, Processed Meat, Poultry, Seafood
By Distribution Channel Supermarkets & Hypermarkets, Convenience Stores, Butcher Shops, Online Retail
By End-Use Industry Food Processing Companies, Retail & Supermarkets, Foodservice Sector
Key Companies Profiled Elsepack, Cascades, HSQY Plastic Group, G-COVE, Solidus, Display Pack, Indepak, Packpro, BonitoPak, Global Sources Suppliers (OEMs)
Additional Attributes Growth supported by food safety, PET’s barrier strength, MAP shelf-life extension, cold-chain expansion, sustainability initiatives, molded fiber adoption, and automation in tray production.

Key Segmentation

By Material:

  • Polyethylene Terephthalate (PET)
  • Polyvinyl Chloride (PVC)
  • Polypropylene (PP)
  • Polystyrene (PS)
  • MoldedFiber
  • Aluminum

By Tray Type:

  • Standard Trays
  • Modified Atmosphere Packaging (MAP) Trays
  • Vacuum Skin Packaging (VSP) Trays
  • Dual-Ovenable Trays
  • Biodegradable/Compostable Trays

By Application:

  • Fresh Red Meat
  • Processed Meat
  • Poultry
  • Seafood

By Distribution Channel:

  • Supermarkets and Hypermarkets
  • Convenience Stores
  • Butcher Shops
  • Online Retail

By End-Use Industry:

  • Food Processing Companies
  • Retail and Supermarkets
  • Foodservice Sector

By Region:

  • North America
  • Europe
  • Asia-Pacific
  • Latin America
  • Middle East & Africa

Table of Content

  1. Executive Summary
    • Global Market Outlook
    • Demand-side Trends
    • Supply-side Trends
    • Technology Roadmap Analysis
    • Analysis and Recommendations
  2. Market Overview
    • Market Coverage / Taxonomy
    • Market Definition / Scope / Limitations
  3. Market Background
    • Market Dynamics
      • Drivers
      • Restraints
      • Opportunity
      • Trends
    • Scenario Forecast
      • Demand in Optimistic Scenario
      • Demand in Likely Scenario
      • Demand in Conservative Scenario
    • Opportunity Map Analysis
    • Product Life Cycle Analysis
    • Supply Chain Analysis
      • Supply Side Participants and their Roles
        • Producers
        • Mid-Level Participants (Traders/ Agents/ Brokers)
        • Wholesalers and Distributors
      • Value Added and Value Created at Node in the Supply Chain
      • List of Raw Material Suppliers
      • List of Existing and Potential Buyer’s
    • Investment Feasibility Matrix
    • Value Chain Analysis
      • Profit Margin Analysis
      • Wholesalers and Distributors
      • Retailers
    • PESTLE and Porter’s Analysis
    • Regulatory Landscape
      • By Key Regions
      • By Key Countries
    • Regional Parent Market Outlook
    • Production and Consumption Statistics
    • Import and Export Statistics
  4. Global Market Analysis 2020 to 2024 and Forecast, 2025 to 2035
    • Historical Market Size Value (USD Billion) & Volume (Units) Analysis, 2020 to 2024
    • Current and Future Market Size Value (USD Billion) & Volume (Units) Projections, 2025 to 2035
      • Y-o-Y Growth Trend Analysis
      • Absolute $ Opportunity Analysis
  5. Global Market Analysis 2020 to 2024 and Forecast 2025 to 2035, By Material
    • Introduction / Key Findings
    • Historical Market Size Value (USD Billion) & Volume (Units) Analysis By Material, 2020 to 2024
    • Current and Future Market Size Value (USD Billion) & Volume (Units) Analysis and Forecast By Material, 2025 to 2035
      • Polyethylene Terephthalate (PET)
      • Polyvinyl Chloride (PVC)
      • Polypropylene (PP)
      • Polystyrene (PS)
      • Molded Fiber
      • Aluminum
    • Y-o-Y Growth Trend Analysis By Material, 2020 to 2024
    • Absolute $ Opportunity Analysis By Material, 2025 to 2035
  6. Global Market Analysis 2020 to 2024 and Forecast 2025 to 2035, By Tray Type
    • Introduction / Key Findings
    • Historical Market Size Value (USD Billion) & Volume (Units) Analysis By Tray Type, 2020 to 2024
    • Current and Future Market Size Value (USD Billion) & Volume (Units) Analysis and Forecast By Tray Type, 2025 to 2035
      • Standard Trays
      • Modified Atmosphere Packaging (MAP) Trays
      • Vacuum Skin Packaging (VSP) Trays
      • Dual-Ovenable Trays
      • Biodegradable/Compostable Trays
    • Y-o-Y Growth Trend Analysis By Tray Type, 2020 to 2024
    • Absolute $ Opportunity Analysis By Tray Type, 2025 to 2035
  7. Global Market Analysis 2020 to 2024 and Forecast 2025 to 2035, By Application
    • Introduction / Key Findings
    • Historical Market Size Value (USD Billion) & Volume (Units) Analysis By Application, 2020 to 2024
    • Current and Future Market Size Value (USD Billion) & Volume (Units) Analysis and Forecast By Application, 2025 to 2035
      • Fresh Red Meat
      • Processed Meat
      • Poultry
        • Seafood
      • Seafood
    • Y-o-Y Growth Trend Analysis By Application, 2020 to 2024
    • Absolute $ Opportunity Analysis By Application, 2025 to 2035
  8. Global Market Analysis 2020 to 2024 and Forecast 2025 to 2035, By Distribution Channel
    • Introduction / Key Findings
    • Historical Market Size Value (USD Billion) & Volume (Units) Analysis By Distribution Channel, 2020 to 2024
    • Current and Future Market Size Value (USD Billion) & Volume (Units) Analysis and Forecast By Distribution Channel, 2025 to 2035
      • Supermarkets and Hypermarkets
      • Convenience Stores
      • Butcher Shops
      • Online Retail
    • Y-o-Y Growth Trend Analysis By Distribution Channel, 2020 to 2024
    • Absolute $ Opportunity Analysis By Distribution Channel, 2025 to 2035
  9. Global Market Analysis 2020 to 2024 and Forecast 2025 to 2035, By End-Use Industry
    • Introduction / Key Findings
    • Historical Market Size Value (USD Billion) & Volume (Units) Analysis By End-Use Industry, 2020 to 2024
    • Current and Future Market Size Value (USD Billion) & Volume (Units) Analysis and Forecast By End-Use Industry, 2025 to 2035
      • Food Processing Companies
      • Retail and Supermarkets
      • Foodservice Sector
    • Y-o-Y Growth Trend Analysis By End-Use Industry, 2020 to 2024
    • Absolute $ Opportunity Analysis By End-Use Industry, 2025 to 2035
  10. Global Market Analysis 2020 to 2024 and Forecast 2025 to 2035, By Region
    • Introduction
    • Historical Market Size Value (USD Billion) & Volume (Units) Analysis By Region, 2020 to 2024
    • Current Market Size Value (USD Billion) & Volume (Units) Analysis and Forecast By Region, 2025 to 2035
      • North America
      • Latin America
      • East Asia
      • South Asia & Pacific
      • Europe
      • Middle East & Africa
    • Market Attractiveness Analysis By Region
  11. North America Market Analysis 2020 to 2024 and Forecast 2025 to 2035, By Country
    • Historical Market Size Value (USD Billion) & Volume (Units) Trend Analysis By Market Taxonomy, 2020 to 2024
    • Market Size Value (USD Billion) & Volume (Units) Forecast By Market Taxonomy, 2025 to 2035
      • By Country
        • USA
        • Canada
        • Mexico
      • By Material
      • By Tray Type
      • By Application
      • By Distribution Channel
      • By End-Use Industry
    • Market Attractiveness Analysis
      • By Country
      • By Material
      • By Tray Type
      • By Application
      • By Distribution Channel
      • By End-Use Industry
    • Key Takeaways
  12. Latin America Market Analysis 2020 to 2024 and Forecast 2025 to 2035, By Country
    • Historical Market Size Value (USD Billion) & Volume (Units) Trend Analysis By Market Taxonomy, 2020 to 2024
    • Market Size Value (USD Billion) & Volume (Units) Forecast By Market Taxonomy, 2025 to 2035
      • By Country
        • Brazil
        • Argentina
        • Rest of Latin America
      • By Material
      • By Tray Type
      • By Application
      • By Distribution Channel
      • By End-Use Industry
    • Market Attractiveness Analysis
      • By Country
      • By Material
      • By Tray Type
      • By Application
      • By Distribution Channel
      • By End-Use Industry
    • Key Takeaways
  13. East Asia Market Analysis 2020 to 2024 and Forecast 2025 to 2035, By Country
    • Historical Market Size Value (USD Billion) & Volume (Units) Trend Analysis By Market Taxonomy, 2020 to 2024
    • Market Size Value (USD Billion) & Volume (Units) Forecast By Market Taxonomy, 2025 to 2035
      • By Country
        • China
        • Japan
        • South Korea
      • By Material
      • By Tray Type
      • By Application
      • By Distribution Channel
      • By End-Use Industry
    • Market Attractiveness Analysis
      • By Country
      • By Material
      • By Tray Type
      • By Application
      • By Distribution Channel
      • By End-Use Industry
    • Key Takeaways
  14. South Asia & Pacific Market Analysis 2020 to 2024 and Forecast 2025 to 2035, By Country
    • Historical Market Size Value (USD Billion) & Volume (Units) Trend Analysis By Market Taxonomy, 2020 to 2024
    • Market Size Value (USD Billion) & Volume (Units) Forecast By Market Taxonomy, 2025 to 2035
      • By Country
        • India
        • ASEAN Countries
        • Australia& New Zealand
        • Rest of South Asia
      • By Material
      • By Tray Type
      • By Application
      • By Distribution Channel
      • By End-Use Industry
    • Market Attractiveness Analysis
      • By Country
      • By Material
      • By Tray Type
      • By Application
      • By Distribution Channel
      • By End-Use Industry
    • Key Takeaways
  15. Europe Market Analysis 2020 to 2024 and Forecast 2025 to 2035, By Country
    • Historical Market Size Value (USD Billion) & Volume (Units) Trend Analysis By Market Taxonomy, 2020 to 2024
    • Market Size Value (USD Billion) & Volume (Units) Forecast By Market Taxonomy, 2025 to 2035
      • By Country
        • Germany
        • UK
        • France
        • Italy
        • Spain
        • BENELUX
        • Nordic Countries
        • Russia
        • Hungary
        • Poland
        • Rest of Europe
      • By Material
      • By Tray Type
      • By Application
      • By Distribution Channel
      • By End-Use Industry
    • Market Attractiveness Analysis
      • By Country
      • By Material
      • By Tray Type
      • By Application
      • By Distribution Channel
      • By End-Use Industry
    • Key Takeaways
  16. Middle East & Africa Market Analysis 2020 to 2024 and Forecast 2025 to 2035, By Country
    • Historical Market Size Value (USD Billion) & Volume (Units) Trend Analysis By Market Taxonomy, 2020 to 2024
    • Market Size Value (USD Billion) & Volume (Units) Forecast By Market Taxonomy, 2025 to 2035
      • By Country
        • Saudi Arabia
        • Türkiye
        • South Africa
        • Other African Union
        • Rest of Middle East & Africa
      • By Material
      • By Tray Type
      • By Application
      • By Distribution Channel
      • By End-Use Industry
    • Market Attractiveness Analysis
      • By Country
      • By Material
      • By Tray Type
      • By Application
      • By Distribution Channel
      • By End-Use Industry
    • Key Takeaways
  17. Key Countries Market Analysis
    • USA.
      • Pricing Analysis
      • Market Share Analysis, 2024
        • By Material
        • By Tray Type
        • By Application
        • By Distribution Channel
        • By End-Use Industry
    • Brazil
      • Pricing Analysis
      • Market Share Analysis, 2024
        • By Material
        • By Tray Type
        • By Application
        • By Distribution Channel
        • By End-Use Industry
    • China
      • Pricing Analysis
      • Market Share Analysis, 2024
        • By Material
        • By Tray Type
        • By Application
        • By Distribution Channel
        • By End-Use Industry
    • India
      • Pricing Analysis
      • Market Share Analysis, 2024
        • By Material
        • By Tray Type
        • By Application
        • By Distribution Channel
        • By End-Use Industry
    • Europe
      • Pricing Analysis
      • Market Share Analysis, 2024
        • By Material
        • By Tray Type
        • By Application
        • By Distribution Channel
        • By End-Use Industry
    • Germany
      • Pricing Analysis
      • Market Share Analysis, 2024
        • By Material
        • By Tray Type
        • By Application
        • By Distribution Channel
        • By End-Use Industry
    • France
      • Pricing Analysis
      • Market Share Analysis, 2024
        • By Material
        • By Tray Type
        • By Application
        • By Distribution Channel
        • By End-Use Industry
    • UK
      • Pricing Analysis
      • Market Share Analysis, 2024
        • By Material
        • By Tray Type
        • By Application
        • By Distribution Channel
        • By End-Use Industry
  18. Market Structure Analysis
    • Competition Dashboard
    • Competition Benchmarking
    • Market Share Analysis of Top Players
      • By Regional
      • By Material
      • By Tray Type
      • By Application
      • By Distribution Channel
      • By End-Use Industry
  19. Competition Analysis
    • Competition Deep Dive
      • Elsepack
        • Overview
        • Product Portfolio
        • Profitability by Market Segments (Product/Age /Sales Channel/Region)
        • Sales Footprint
        • Strategy Overview
          • Marketing Strategy
          • Product Strategy
          • Channel Strategy
      • Cascades
        • Overview
        • Product Portfolio
        • Profitability by Market Segments (Product/Age /Sales Channel/Region)
        • Sales Footprint
        • Strategy Overview
          • Marketing Strategy
          • Product Strategy
          • Channel Strategy
      • HSQY Plastic Group
        • Overview
        • Product Portfolio
        • Profitability by Market Segments (Product/Age /Sales Channel/Region)
        • Sales Footprint
        • Strategy Overview
          • Marketing Strategy
          • Product Strategy
          • Channel Strategy
      • G-COVE
        • Overview
        • Product Portfolio
        • Profitability by Market Segments (Product/Age /Sales Channel/Region)
        • Sales Footprint
        • Strategy Overview
          • Marketing Strategy
          • Product Strategy
          • Channel Strategy
      • Solidus
        • Overview
        • Product Portfolio
        • Profitability by Market Segments (Product/Age /Sales Channel/Region)
        • Sales Footprint
        • Strategy Overview
          • Marketing Strategy
          • Product Strategy
          • Channel Strategy
      • Display Pack
        • Overview
        • Product Portfolio
        • Profitability by Market Segments (Product/Age /Sales Channel/Region)
        • Sales Footprint
        • Strategy Overview
          • Marketing Strategy
          • Product Strategy
          • Channel Strategy
      • Indepak
        • Overview
        • Product Portfolio
        • Profitability by Market Segments (Product/Age /Sales Channel/Region)
        • Sales Footprint
        • Strategy Overview
          • Marketing Strategy
          • Product Strategy
          • Channel Strategy
      • Packpro
        • Overview
        • Product Portfolio
        • Profitability by Market Segments (Product/Age /Sales Channel/Region)
        • Sales Footprint
        • Strategy Overview
          • Marketing Strategy
          • Product Strategy
          • Channel Strategy
      • Global Sources Suppliers (verified OEMs)
        • Overview
        • Product Portfolio
        • Profitability by Market Segments (Product/Age /Sales Channel/Region)
        • Sales Footprint
        • Strategy Overview
          • Marketing Strategy
          • Product Strategy
          • Channel Strategy
      • BonitoPak
        • Overview
        • Product Portfolio
        • Profitability by Market Segments (Product/Age /Sales Channel/Region)
        • Sales Footprint
        • Strategy Overview
          • Marketing Strategy
          • Product Strategy
          • Channel Strategy
  20. Assumptions & Acronyms Used
  21. Research Methodology

List of Tables

  • Table 1: Global Market Value (USD Billion) Forecast by Region, 2020-2035
  • Table 2: Global Market Volume (Units) Forecast by Region, 2020-2035
  • Table 3: Global Market Value (USD Billion) Forecast by Material, 2020-2035
  • Table 4: Global Market Volume (Units) Forecast by Material, 2020-2035
  • Table 5: Global Market Value (USD Billion) Forecast by Tray Type, 2020-2035
  • Table 6: Global Market Volume (Units) Forecast by Tray Type, 2020-2035
  • Table 7: Global Market Value (USD Billion) Forecast by Application, 2020-2035
  • Table 8: Global Market Volume (Units) Forecast by Application, 2020-2035
  • Table 9: Global Market Value (USD Billion) Forecast by Distribution Channel, 2020-2035
  • Table 10: Global Market Volume (Units) Forecast by Distribution Channel, 2020-2035
  • Table 11: Global Market Value (USD Billion) Forecast by End-Use Industry, 2020-2035
  • Table 12: Global Market Volume (Units) Forecast by End-Use Industry, 2020-2035
  • Table 13: North America Market Value (USD Billion) Forecast by Country, 2020-2035
  • Table 14: North America Market Volume (Units) Forecast by Country, 2020-2035
  • Table 15: North America Market Value (USD Billion) Forecast by Material, 2020-2035
  • Table 16: North America Market Volume (Units) Forecast by Material, 2020-2035
  • Table 17: North America Market Value (USD Billion) Forecast by Tray Type, 2020-2035
  • Table 18: North America Market Volume (Units) Forecast by Tray Type, 2020-2035
  • Table 19: North America Market Value (USD Billion) Forecast by Application, 2020-2035
  • Table 20: North America Market Volume (Units) Forecast by Application, 2020-2035
  • Table 21: North America Market Value (USD Billion) Forecast by Distribution Channel, 2020-2035
  • Table 22: North America Market Volume (Units) Forecast by Distribution Channel, 2020-2035
  • Table 23: North America Market Value (USD Billion) Forecast by End-Use Industry, 2020-2035
  • Table 24: North America Market Volume (Units) Forecast by End-Use Industry, 2020-2035
  • Table 25: Latin America Market Value (USD Billion) Forecast by Country, 2020-2035
  • Table 26: Latin America Market Volume (Units) Forecast by Country, 2020-2035
  • Table 27: Latin America Market Value (USD Billion) Forecast by Material, 2020-2035
  • Table 28: Latin America Market Volume (Units) Forecast by Material, 2020-2035
  • Table 29: Latin America Market Value (USD Billion) Forecast by Tray Type, 2020-2035
  • Table 30: Latin America Market Volume (Units) Forecast by Tray Type, 2020-2035
  • Table 31: Latin America Market Value (USD Billion) Forecast by Application, 2020-2035
  • Table 32: Latin America Market Volume (Units) Forecast by Application, 2020-2035
  • Table 33: Latin America Market Value (USD Billion) Forecast by Distribution Channel, 2020-2035
  • Table 34: Latin America Market Volume (Units) Forecast by Distribution Channel, 2020-2035
  • Table 35: Latin America Market Value (USD Billion) Forecast by End-Use Industry, 2020-2035
  • Table 36: Latin America Market Volume (Units) Forecast by End-Use Industry, 2020-2035
  • Table 37: East Asia Market Value (USD Billion) Forecast by Country, 2020-2035
  • Table 38: East Asia Market Volume (Units) Forecast by Country, 2020-2035
  • Table 39: East Asia Market Value (USD Billion) Forecast by Material, 2020-2035
  • Table 40: East Asia Market Volume (Units) Forecast by Material, 2020-2035
  • Table 41: East Asia Market Value (USD Billion) Forecast by Tray Type, 2020-2035
  • Table 42: East Asia Market Volume (Units) Forecast by Tray Type, 2020-2035
  • Table 43: East Asia Market Value (USD Billion) Forecast by Application, 2020-2035
  • Table 44: East Asia Market Volume (Units) Forecast by Application, 2020-2035
  • Table 45: East Asia Market Value (USD Billion) Forecast by Distribution Channel, 2020-2035
  • Table 46: East Asia Market Volume (Units) Forecast by Distribution Channel, 2020-2035
  • Table 47: East Asia Market Value (USD Billion) Forecast by End-Use Industry, 2020-2035
  • Table 48: East Asia Market Volume (Units) Forecast by End-Use Industry, 2020-2035
  • Table 49: South Asia & Pacific Market Value (USD Billion) Forecast by Country, 2020-2035
  • Table 50: South Asia & Pacific Market Volume (Units) Forecast by Country, 2020-2035
  • Table 51: South Asia & Pacific Market Value (USD Billion) Forecast by Material, 2020-2035
  • Table 52: South Asia & Pacific Market Volume (Units) Forecast by Material, 2020-2035
  • Table 53: South Asia & Pacific Market Value (USD Billion) Forecast by Tray Type, 2020-2035
  • Table 54: South Asia & Pacific Market Volume (Units) Forecast by Tray Type, 2020-2035
  • Table 55: South Asia & Pacific Market Value (USD Billion) Forecast by Application, 2020-2035
  • Table 56: South Asia & Pacific Market Volume (Units) Forecast by Application, 2020-2035
  • Table 57: South Asia & Pacific Market Value (USD Billion) Forecast by Distribution Channel, 2020-2035
  • Table 58: South Asia & Pacific Market Volume (Units) Forecast by Distribution Channel, 2020-2035
  • Table 59: South Asia & Pacific Market Value (USD Billion) Forecast by End-Use Industry, 2020-2035
  • Table 60: South Asia & Pacific Market Volume (Units) Forecast by End-Use Industry, 2020-2035
  • Table 61: Europe Market Value (USD Billion) Forecast by Country, 2020-2035
  • Table 62: Europe Market Volume (Units) Forecast by Country, 2020-2035
  • Table 63: Europe Market Value (USD Billion) Forecast by Material, 2020-2035
  • Table 64: Europe Market Volume (Units) Forecast by Material, 2020-2035
  • Table 65: Europe Market Value (USD Billion) Forecast by Tray Type, 2020-2035
  • Table 66: Europe Market Volume (Units) Forecast by Tray Type, 2020-2035
  • Table 67: Europe Market Value (USD Billion) Forecast by Application, 2020-2035
  • Table 68: Europe Market Volume (Units) Forecast by Application, 2020-2035
  • Table 69: Europe Market Value (USD Billion) Forecast by Distribution Channel, 2020-2035
  • Table 70: Europe Market Volume (Units) Forecast by Distribution Channel, 2020-2035
  • Table 71: Europe Market Value (USD Billion) Forecast by End-Use Industry, 2020-2035
  • Table 72: Europe Market Volume (Units) Forecast by End-Use Industry, 2020-2035
  • Table 73: Middle East & Africa Market Value (USD Billion) Forecast by Country, 2020-2035
  • Table 74: Middle East & Africa Market Volume (Units) Forecast by Country, 2020-2035
  • Table 75: Middle East & Africa Market Value (USD Billion) Forecast by Material, 2020-2035
  • Table 76: Middle East & Africa Market Volume (Units) Forecast by Material, 2020-2035
  • Table 77: Middle East & Africa Market Value (USD Billion) Forecast by Tray Type, 2020-2035
  • Table 78: Middle East & Africa Market Volume (Units) Forecast by Tray Type, 2020-2035
  • Table 79: Middle East & Africa Market Value (USD Billion) Forecast by Application, 2020-2035
  • Table 80: Middle East & Africa Market Volume (Units) Forecast by Application, 2020-2035
  • Table 81: Middle East & Africa Market Value (USD Billion) Forecast by Distribution Channel, 2020-2035
  • Table 82: Middle East & Africa Market Volume (Units) Forecast by Distribution Channel, 2020-2035
  • Table 83: Middle East & Africa Market Value (USD Billion) Forecast by End-Use Industry, 2020-2035
  • Table 84: Middle East & Africa Market Volume (Units) Forecast by End-Use Industry, 2020-2035

List of Figures

  • Figure 1: Global Market Value (USD Billion) by Material, 2025-2035
  • Figure 2: Global Market Value (USD Billion) by Tray Type, 2025-2035
  • Figure 3: Global Market Value (USD Billion) by Application, 2025-2035
  • Figure 4: Global Market Value (USD Billion) by Distribution Channel, 2025-2035
  • Figure 5: Global Market Value (USD Billion) by End-Use Industry, 2025-2035
  • Figure 6: Global Market Value (USD Billion) by Region, 2025-2035
  • Figure 7: Global Market Value (USD Billion) Analysis by Region, 2020-2035
  • Figure 8: Global Market Volume (Units) Analysis by Region, 2020-2035
  • Figure 9: Global Market Value Share (%) and BPS Analysis by Region, 2025-2035
  • Figure 10: Global Market Y-o-Y Growth (%) Projections by Region, 2025-2035
  • Figure 11: Global Market Value (USD Billion) Analysis by Material, 2020-2035
  • Figure 12: Global Market Volume (Units) Analysis by Material, 2020-2035
  • Figure 13: Global Market Value Share (%) and BPS Analysis by Material, 2025-2035
  • Figure 14: Global Market Y-o-Y Growth (%) Projections by Material, 2025-2035
  • Figure 15: Global Market Value (USD Billion) Analysis by Tray Type, 2020-2035
  • Figure 16: Global Market Volume (Units) Analysis by Tray Type, 2020-2035
  • Figure 17: Global Market Value Share (%) and BPS Analysis by Tray Type, 2025-2035
  • Figure 18: Global Market Y-o-Y Growth (%) Projections by Tray Type, 2025-2035
  • Figure 19: Global Market Value (USD Billion) Analysis by Application, 2020-2035
  • Figure 20: Global Market Volume (Units) Analysis by Application, 2020-2035
  • Figure 21: Global Market Value Share (%) and BPS Analysis by Application, 2025-2035
  • Figure 22: Global Market Y-o-Y Growth (%) Projections by Application, 2025-2035
  • Figure 23: Global Market Value (USD Billion) Analysis by Distribution Channel, 2020-2035
  • Figure 24: Global Market Volume (Units) Analysis by Distribution Channel, 2020-2035
  • Figure 25: Global Market Value Share (%) and BPS Analysis by Distribution Channel, 2025-2035
  • Figure 26: Global Market Y-o-Y Growth (%) Projections by Distribution Channel, 2025-2035
  • Figure 27: Global Market Value (USD Billion) Analysis by End-Use Industry, 2020-2035
  • Figure 28: Global Market Volume (Units) Analysis by End-Use Industry, 2020-2035
  • Figure 29: Global Market Value Share (%) and BPS Analysis by End-Use Industry, 2025-2035
  • Figure 30: Global Market Y-o-Y Growth (%) Projections by End-Use Industry, 2025-2035
  • Figure 31: Global Market Attractiveness by Material, 2025-2035
  • Figure 32: Global Market Attractiveness by Tray Type, 2025-2035
  • Figure 33: Global Market Attractiveness by Application, 2025-2035
  • Figure 34: Global Market Attractiveness by Distribution Channel, 2025-2035
  • Figure 35: Global Market Attractiveness by End-Use Industry, 2025-2035
  • Figure 36: Global Market Attractiveness by Region, 2025-2035
  • Figure 37: North America Market Value (USD Billion) by Material, 2025-2035
  • Figure 38: North America Market Value (USD Billion) by Tray Type, 2025-2035
  • Figure 39: North America Market Value (USD Billion) by Application, 2025-2035
  • Figure 40: North America Market Value (USD Billion) by Distribution Channel, 2025-2035
  • Figure 41: North America Market Value (USD Billion) by End-Use Industry, 2025-2035
  • Figure 42: North America Market Value (USD Billion) by Country, 2025-2035
  • Figure 43: North America Market Value (USD Billion) Analysis by Country, 2020-2035
  • Figure 44: North America Market Volume (Units) Analysis by Country, 2020-2035
  • Figure 45: North America Market Value Share (%) and BPS Analysis by Country, 2025-2035
  • Figure 46: North America Market Y-o-Y Growth (%) Projections by Country, 2025-2035
  • Figure 47: North America Market Value (USD Billion) Analysis by Material, 2020-2035
  • Figure 48: North America Market Volume (Units) Analysis by Material, 2020-2035
  • Figure 49: North America Market Value Share (%) and BPS Analysis by Material, 2025-2035
  • Figure 50: North America Market Y-o-Y Growth (%) Projections by Material, 2025-2035
  • Figure 51: North America Market Value (USD Billion) Analysis by Tray Type, 2020-2035
  • Figure 52: North America Market Volume (Units) Analysis by Tray Type, 2020-2035
  • Figure 53: North America Market Value Share (%) and BPS Analysis by Tray Type, 2025-2035
  • Figure 54: North America Market Y-o-Y Growth (%) Projections by Tray Type, 2025-2035
  • Figure 55: North America Market Value (USD Billion) Analysis by Application, 2020-2035
  • Figure 56: North America Market Volume (Units) Analysis by Application, 2020-2035
  • Figure 57: North America Market Value Share (%) and BPS Analysis by Application, 2025-2035
  • Figure 58: North America Market Y-o-Y Growth (%) Projections by Application, 2025-2035
  • Figure 59: North America Market Value (USD Billion) Analysis by Distribution Channel, 2020-2035
  • Figure 60: North America Market Volume (Units) Analysis by Distribution Channel, 2020-2035
  • Figure 61: North America Market Value Share (%) and BPS Analysis by Distribution Channel, 2025-2035
  • Figure 62: North America Market Y-o-Y Growth (%) Projections by Distribution Channel, 2025-2035
  • Figure 63: North America Market Value (USD Billion) Analysis by End-Use Industry, 2020-2035
  • Figure 64: North America Market Volume (Units) Analysis by End-Use Industry, 2020-2035
  • Figure 65: North America Market Value Share (%) and BPS Analysis by End-Use Industry, 2025-2035
  • Figure 66: North America Market Y-o-Y Growth (%) Projections by End-Use Industry, 2025-2035
  • Figure 67: North America Market Attractiveness by Material, 2025-2035
  • Figure 68: North America Market Attractiveness by Tray Type, 2025-2035
  • Figure 69: North America Market Attractiveness by Application, 2025-2035
  • Figure 70: North America Market Attractiveness by Distribution Channel, 2025-2035
  • Figure 71: North America Market Attractiveness by End-Use Industry, 2025-2035
  • Figure 72: North America Market Attractiveness by Country, 2025-2035
  • Figure 73: Latin America Market Value (USD Billion) by Material, 2025-2035
  • Figure 74: Latin America Market Value (USD Billion) by Tray Type, 2025-2035
  • Figure 75: Latin America Market Value (USD Billion) by Application, 2025-2035
  • Figure 76: Latin America Market Value (USD Billion) by Distribution Channel, 2025-2035
  • Figure 77: Latin America Market Value (USD Billion) by End-Use Industry, 2025-2035
  • Figure 78: Latin America Market Value (USD Billion) by Country, 2025-2035
  • Figure 79: Latin America Market Value (USD Billion) Analysis by Country, 2020-2035
  • Figure 80: Latin America Market Volume (Units) Analysis by Country, 2020-2035
  • Figure 81: Latin America Market Value Share (%) and BPS Analysis by Country, 2025-2035
  • Figure 82: Latin America Market Y-o-Y Growth (%) Projections by Country, 2025-2035
  • Figure 83: Latin America Market Value (USD Billion) Analysis by Material, 2020-2035
  • Figure 84: Latin America Market Volume (Units) Analysis by Material, 2020-2035
  • Figure 85: Latin America Market Value Share (%) and BPS Analysis by Material, 2025-2035
  • Figure 86: Latin America Market Y-o-Y Growth (%) Projections by Material, 2025-2035
  • Figure 87: Latin America Market Value (USD Billion) Analysis by Tray Type, 2020-2035
  • Figure 88: Latin America Market Volume (Units) Analysis by Tray Type, 2020-2035
  • Figure 89: Latin America Market Value Share (%) and BPS Analysis by Tray Type, 2025-2035
  • Figure 90: Latin America Market Y-o-Y Growth (%) Projections by Tray Type, 2025-2035
  • Figure 91: Latin America Market Value (USD Billion) Analysis by Application, 2020-2035
  • Figure 92: Latin America Market Volume (Units) Analysis by Application, 2020-2035
  • Figure 93: Latin America Market Value Share (%) and BPS Analysis by Application, 2025-2035
  • Figure 94: Latin America Market Y-o-Y Growth (%) Projections by Application, 2025-2035
  • Figure 95: Latin America Market Value (USD Billion) Analysis by Distribution Channel, 2020-2035
  • Figure 96: Latin America Market Volume (Units) Analysis by Distribution Channel, 2020-2035
  • Figure 97: Latin America Market Value Share (%) and BPS Analysis by Distribution Channel, 2025-2035
  • Figure 98: Latin America Market Y-o-Y Growth (%) Projections by Distribution Channel, 2025-2035
  • Figure 99: Latin America Market Value (USD Billion) Analysis by End-Use Industry, 2020-2035
  • Figure 100: Latin America Market Volume (Units) Analysis by End-Use Industry, 2020-2035
  • Figure 101: Latin America Market Value Share (%) and BPS Analysis by End-Use Industry, 2025-2035
  • Figure 102: Latin America Market Y-o-Y Growth (%) Projections by End-Use Industry, 2025-2035
  • Figure 103: Latin America Market Attractiveness by Material, 2025-2035
  • Figure 104: Latin America Market Attractiveness by Tray Type, 2025-2035
  • Figure 105: Latin America Market Attractiveness by Application, 2025-2035
  • Figure 106: Latin America Market Attractiveness by Distribution Channel, 2025-2035
  • Figure 107: Latin America Market Attractiveness by End-Use Industry, 2025-2035
  • Figure 108: Latin America Market Attractiveness by Country, 2025-2035
  • Figure 109: East Asia Market Value (USD Billion) by Material, 2025-2035
  • Figure 110: East Asia Market Value (USD Billion) by Tray Type, 2025-2035
  • Figure 111: East Asia Market Value (USD Billion) by Application, 2025-2035
  • Figure 112: East Asia Market Value (USD Billion) by Distribution Channel, 2025-2035
  • Figure 113: East Asia Market Value (USD Billion) by End-Use Industry, 2025-2035
  • Figure 114: East Asia Market Value (USD Billion) by Country, 2025-2035
  • Figure 115: East Asia Market Value (USD Billion) Analysis by Country, 2020-2035
  • Figure 116: East Asia Market Volume (Units) Analysis by Country, 2020-2035
  • Figure 117: East Asia Market Value Share (%) and BPS Analysis by Country, 2025-2035
  • Figure 118: East Asia Market Y-o-Y Growth (%) Projections by Country, 2025-2035
  • Figure 119: East Asia Market Value (USD Billion) Analysis by Material, 2020-2035
  • Figure 120: East Asia Market Volume (Units) Analysis by Material, 2020-2035
  • Figure 121: East Asia Market Value Share (%) and BPS Analysis by Material, 2025-2035
  • Figure 122: East Asia Market Y-o-Y Growth (%) Projections by Material, 2025-2035
  • Figure 123: East Asia Market Value (USD Billion) Analysis by Tray Type, 2020-2035
  • Figure 124: East Asia Market Volume (Units) Analysis by Tray Type, 2020-2035
  • Figure 125: East Asia Market Value Share (%) and BPS Analysis by Tray Type, 2025-2035
  • Figure 126: East Asia Market Y-o-Y Growth (%) Projections by Tray Type, 2025-2035
  • Figure 127: East Asia Market Value (USD Billion) Analysis by Application, 2020-2035
  • Figure 128: East Asia Market Volume (Units) Analysis by Application, 2020-2035
  • Figure 129: East Asia Market Value Share (%) and BPS Analysis by Application, 2025-2035
  • Figure 130: East Asia Market Y-o-Y Growth (%) Projections by Application, 2025-2035
  • Figure 131: East Asia Market Value (USD Billion) Analysis by Distribution Channel, 2020-2035
  • Figure 132: East Asia Market Volume (Units) Analysis by Distribution Channel, 2020-2035
  • Figure 133: East Asia Market Value Share (%) and BPS Analysis by Distribution Channel, 2025-2035
  • Figure 134: East Asia Market Y-o-Y Growth (%) Projections by Distribution Channel, 2025-2035
  • Figure 135: East Asia Market Value (USD Billion) Analysis by End-Use Industry, 2020-2035
  • Figure 136: East Asia Market Volume (Units) Analysis by End-Use Industry, 2020-2035
  • Figure 137: East Asia Market Value Share (%) and BPS Analysis by End-Use Industry, 2025-2035
  • Figure 138: East Asia Market Y-o-Y Growth (%) Projections by End-Use Industry, 2025-2035
  • Figure 139: East Asia Market Attractiveness by Material, 2025-2035
  • Figure 140: East Asia Market Attractiveness by Tray Type, 2025-2035
  • Figure 141: East Asia Market Attractiveness by Application, 2025-2035
  • Figure 142: East Asia Market Attractiveness by Distribution Channel, 2025-2035
  • Figure 143: East Asia Market Attractiveness by End-Use Industry, 2025-2035
  • Figure 144: East Asia Market Attractiveness by Country, 2025-2035
  • Figure 145: South Asia & Pacific Market Value (USD Billion) by Material, 2025-2035
  • Figure 146: South Asia & Pacific Market Value (USD Billion) by Tray Type, 2025-2035
  • Figure 147: South Asia & Pacific Market Value (USD Billion) by Application, 2025-2035
  • Figure 148: South Asia & Pacific Market Value (USD Billion) by Distribution Channel, 2025-2035
  • Figure 149: South Asia & Pacific Market Value (USD Billion) by End-Use Industry, 2025-2035
  • Figure 150: South Asia & Pacific Market Value (USD Billion) by Country, 2025-2035
  • Figure 151: South Asia & Pacific Market Value (USD Billion) Analysis by Country, 2020-2035
  • Figure 152: South Asia & Pacific Market Volume (Units) Analysis by Country, 2020-2035
  • Figure 153: South Asia & Pacific Market Value Share (%) and BPS Analysis by Country, 2025-2035
  • Figure 154: South Asia & Pacific Market Y-o-Y Growth (%) Projections by Country, 2025-2035
  • Figure 155: South Asia & Pacific Market Value (USD Billion) Analysis by Material, 2020-2035
  • Figure 156: South Asia & Pacific Market Volume (Units) Analysis by Material, 2020-2035
  • Figure 157: South Asia & Pacific Market Value Share (%) and BPS Analysis by Material, 2025-2035
  • Figure 158: South Asia & Pacific Market Y-o-Y Growth (%) Projections by Material, 2025-2035
  • Figure 159: South Asia & Pacific Market Value (USD Billion) Analysis by Tray Type, 2020-2035
  • Figure 160: South Asia & Pacific Market Volume (Units) Analysis by Tray Type, 2020-2035
  • Figure 161: South Asia & Pacific Market Value Share (%) and BPS Analysis by Tray Type, 2025-2035
  • Figure 162: South Asia & Pacific Market Y-o-Y Growth (%) Projections by Tray Type, 2025-2035
  • Figure 163: South Asia & Pacific Market Value (USD Billion) Analysis by Application, 2020-2035
  • Figure 164: South Asia & Pacific Market Volume (Units) Analysis by Application, 2020-2035
  • Figure 165: South Asia & Pacific Market Value Share (%) and BPS Analysis by Application, 2025-2035
  • Figure 166: South Asia & Pacific Market Y-o-Y Growth (%) Projections by Application, 2025-2035
  • Figure 167: South Asia & Pacific Market Value (USD Billion) Analysis by Distribution Channel, 2020-2035
  • Figure 168: South Asia & Pacific Market Volume (Units) Analysis by Distribution Channel, 2020-2035
  • Figure 169: South Asia & Pacific Market Value Share (%) and BPS Analysis by Distribution Channel, 2025-2035
  • Figure 170: South Asia & Pacific Market Y-o-Y Growth (%) Projections by Distribution Channel, 2025-2035
  • Figure 171: South Asia & Pacific Market Value (USD Billion) Analysis by End-Use Industry, 2020-2035
  • Figure 172: South Asia & Pacific Market Volume (Units) Analysis by End-Use Industry, 2020-2035
  • Figure 173: South Asia & Pacific Market Value Share (%) and BPS Analysis by End-Use Industry, 2025-2035
  • Figure 174: South Asia & Pacific Market Y-o-Y Growth (%) Projections by End-Use Industry, 2025-2035
  • Figure 175: South Asia & Pacific Market Attractiveness by Material, 2025-2035
  • Figure 176: South Asia & Pacific Market Attractiveness by Tray Type, 2025-2035
  • Figure 177: South Asia & Pacific Market Attractiveness by Application, 2025-2035
  • Figure 178: South Asia & Pacific Market Attractiveness by Distribution Channel, 2025-2035
  • Figure 179: South Asia & Pacific Market Attractiveness by End-Use Industry, 2025-2035
  • Figure 180: South Asia & Pacific Market Attractiveness by Country, 2025-2035
  • Figure 181: Europe Market Value (USD Billion) by Material, 2025-2035
  • Figure 182: Europe Market Value (USD Billion) by Tray Type, 2025-2035
  • Figure 183: Europe Market Value (USD Billion) by Application, 2025-2035
  • Figure 184: Europe Market Value (USD Billion) by Distribution Channel, 2025-2035
  • Figure 185: Europe Market Value (USD Billion) by End-Use Industry, 2025-2035
  • Figure 186: Europe Market Value (USD Billion) by Country, 2025-2035
  • Figure 187: Europe Market Value (USD Billion) Analysis by Country, 2020-2035
  • Figure 188: Europe Market Volume (Units) Analysis by Country, 2020-2035
  • Figure 189: Europe Market Value Share (%) and BPS Analysis by Country, 2025-2035
  • Figure 190: Europe Market Y-o-Y Growth (%) Projections by Country, 2025-2035
  • Figure 191: Europe Market Value (USD Billion) Analysis by Material, 2020-2035
  • Figure 192: Europe Market Volume (Units) Analysis by Material, 2020-2035
  • Figure 193: Europe Market Value Share (%) and BPS Analysis by Material, 2025-2035
  • Figure 194: Europe Market Y-o-Y Growth (%) Projections by Material, 2025-2035
  • Figure 195: Europe Market Value (USD Billion) Analysis by Tray Type, 2020-2035
  • Figure 196: Europe Market Volume (Units) Analysis by Tray Type, 2020-2035
  • Figure 197: Europe Market Value Share (%) and BPS Analysis by Tray Type, 2025-2035
  • Figure 198: Europe Market Y-o-Y Growth (%) Projections by Tray Type, 2025-2035
  • Figure 199: Europe Market Value (USD Billion) Analysis by Application, 2020-2035
  • Figure 200: Europe Market Volume (Units) Analysis by Application, 2020-2035
  • Figure 201: Europe Market Value Share (%) and BPS Analysis by Application, 2025-2035
  • Figure 202: Europe Market Y-o-Y Growth (%) Projections by Application, 2025-2035
  • Figure 203: Europe Market Value (USD Billion) Analysis by Distribution Channel, 2020-2035
  • Figure 204: Europe Market Volume (Units) Analysis by Distribution Channel, 2020-2035
  • Figure 205: Europe Market Value Share (%) and BPS Analysis by Distribution Channel, 2025-2035
  • Figure 206: Europe Market Y-o-Y Growth (%) Projections by Distribution Channel, 2025-2035
  • Figure 207: Europe Market Value (USD Billion) Analysis by End-Use Industry, 2020-2035
  • Figure 208: Europe Market Volume (Units) Analysis by End-Use Industry, 2020-2035
  • Figure 209: Europe Market Value Share (%) and BPS Analysis by End-Use Industry, 2025-2035
  • Figure 210: Europe Market Y-o-Y Growth (%) Projections by End-Use Industry, 2025-2035
  • Figure 211: Europe Market Attractiveness by Material, 2025-2035
  • Figure 212: Europe Market Attractiveness by Tray Type, 2025-2035
  • Figure 213: Europe Market Attractiveness by Application, 2025-2035
  • Figure 214: Europe Market Attractiveness by Distribution Channel, 2025-2035
  • Figure 215: Europe Market Attractiveness by End-Use Industry, 2025-2035
  • Figure 216: Europe Market Attractiveness by Country, 2025-2035
  • Figure 217: Middle East & Africa Market Value (USD Billion) by Material, 2025-2035
  • Figure 218: Middle East & Africa Market Value (USD Billion) by Tray Type, 2025-2035
  • Figure 219: Middle East & Africa Market Value (USD Billion) by Application, 2025-2035
  • Figure 220: Middle East & Africa Market Value (USD Billion) by Distribution Channel, 2025-2035
  • Figure 221: Middle East & Africa Market Value (USD Billion) by End-Use Industry, 2025-2035
  • Figure 222: Middle East & Africa Market Value (USD Billion) by Country, 2025-2035
  • Figure 223: Middle East & Africa Market Value (USD Billion) Analysis by Country, 2020-2035
  • Figure 224: Middle East & Africa Market Volume (Units) Analysis by Country, 2020-2035
  • Figure 225: Middle East & Africa Market Value Share (%) and BPS Analysis by Country, 2025-2035
  • Figure 226: Middle East & Africa Market Y-o-Y Growth (%) Projections by Country, 2025-2035
  • Figure 227: Middle East & Africa Market Value (USD Billion) Analysis by Material, 2020-2035
  • Figure 228: Middle East & Africa Market Volume (Units) Analysis by Material, 2020-2035
  • Figure 229: Middle East & Africa Market Value Share (%) and BPS Analysis by Material, 2025-2035
  • Figure 230: Middle East & Africa Market Y-o-Y Growth (%) Projections by Material, 2025-2035
  • Figure 231: Middle East & Africa Market Value (USD Billion) Analysis by Tray Type, 2020-2035
  • Figure 232: Middle East & Africa Market Volume (Units) Analysis by Tray Type, 2020-2035
  • Figure 233: Middle East & Africa Market Value Share (%) and BPS Analysis by Tray Type, 2025-2035
  • Figure 234: Middle East & Africa Market Y-o-Y Growth (%) Projections by Tray Type, 2025-2035
  • Figure 235: Middle East & Africa Market Value (USD Billion) Analysis by Application, 2020-2035
  • Figure 236: Middle East & Africa Market Volume (Units) Analysis by Application, 2020-2035
  • Figure 237: Middle East & Africa Market Value Share (%) and BPS Analysis by Application, 2025-2035
  • Figure 238: Middle East & Africa Market Y-o-Y Growth (%) Projections by Application, 2025-2035
  • Figure 239: Middle East & Africa Market Value (USD Billion) Analysis by Distribution Channel, 2020-2035
  • Figure 240: Middle East & Africa Market Volume (Units) Analysis by Distribution Channel, 2020-2035
  • Figure 241: Middle East & Africa Market Value Share (%) and BPS Analysis by Distribution Channel, 2025-2035
  • Figure 242: Middle East & Africa Market Y-o-Y Growth (%) Projections by Distribution Channel, 2025-2035
  • Figure 243: Middle East & Africa Market Value (USD Billion) Analysis by End-Use Industry, 2020-2035
  • Figure 244: Middle East & Africa Market Volume (Units) Analysis by End-Use Industry, 2020-2035
  • Figure 245: Middle East & Africa Market Value Share (%) and BPS Analysis by End-Use Industry, 2025-2035
  • Figure 246: Middle East & Africa Market Y-o-Y Growth (%) Projections by End-Use Industry, 2025-2035
  • Figure 247: Middle East & Africa Market Attractiveness by Material, 2025-2035
  • Figure 248: Middle East & Africa Market Attractiveness by Tray Type, 2025-2035
  • Figure 249: Middle East & Africa Market Attractiveness by Application, 2025-2035
  • Figure 250: Middle East & Africa Market Attractiveness by Distribution Channel, 2025-2035
  • Figure 251: Middle East & Africa Market Attractiveness by End-Use Industry, 2025-2035
  • Figure 252: Middle East & Africa Market Attractiveness by Country, 2025-2035

Frequently Asked Questions

How big will the Meat Trays Market be in 2025?

The Meat Trays Market will be valued at USD 2.8 billion in 2025.

What is the projected size of the Meat Trays Market by 2035?

The Meat Trays Market will reach USD 4.5 billion by 2035.

What growth rate is expected for the Meat Trays Market between 2025 and 2035?

The Meat Trays Market will expand at a CAGR of 4.8% during 2025-2035.

Which segment will lead the Meat Trays Market in 2025?

Supermarkets and hypermarkets will lead the Meat Trays Market in 2025 with a 42.6% share.

Which region will be the fastest growing in the Meat Trays Market?

The Asia-Pacific region will be the fastest-growing market, led by China at 4.9% CAGR.

Explore Similar Insights

Future Market Insights

Meat Trays Market

Chat With

MaRIA

Hi There, I am MaRIA, Your Market Research Intelligence Assistant. How may I help you?