Meat, Poultry, and Seafood Packaging Market Size, Share, and Forecast Outlook 2025 to 2035

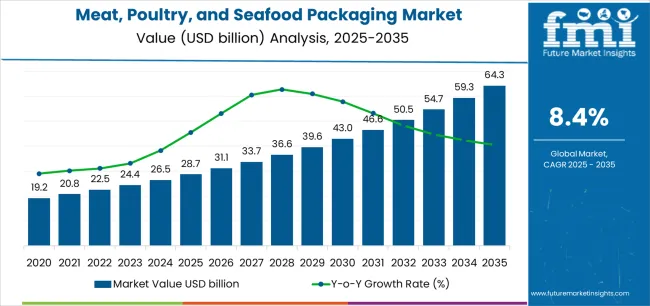
The global meat, poultry, and seafood packaging market is expected to witness steady growth during the forecast period from 2025 to 2035. The market size is forecast to increase from USD 8.19 billion in 2025 to USD 12.55 billion by 2035, reflecting a CAGR of 4.4%. Growth is primarily supported by rising consumer demand for packaged protein products, the evolution of cold chain logistics, and the expansion of e-commerce food channels. Advancements in active and intelligent packaging further enhance the market outlook.

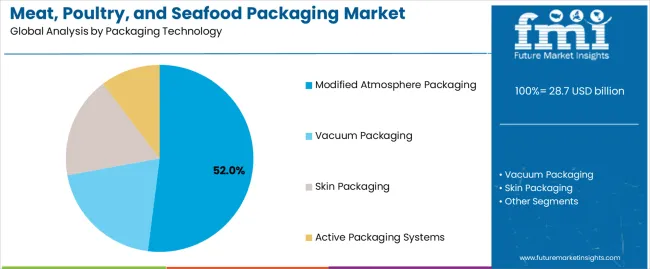
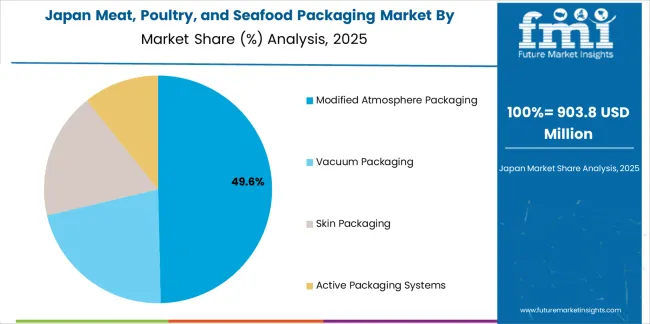
Modified atmosphere packaging (MAP) is expected to maintain its dominance in the technology segment with an estimated 42.0% market share in 2025. This is driven by MAP's proven ability to extend product shelf life by altering the atmospheric composition within packaging, thereby slowing microbial growth and oxidation processes. Such attributes make MAP a preferred choice for preserving freshness in fresh meat, seafood, and poultry products.

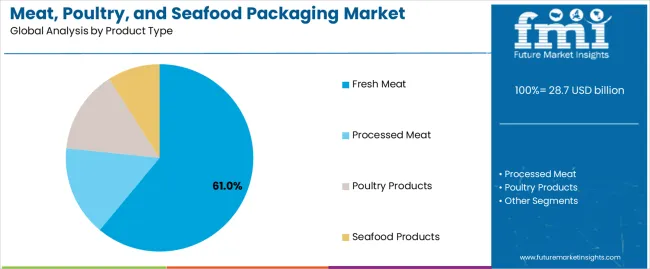
In terms of product type, films remain the top-selling packaging format, capturing a 28.3% share in 2025. Their cost-effectiveness, flexibility, and compatibility with various sealing and filling systems contribute to this segment's continued leadership. Films are widely used for vacuum packaging, skin packs, and tray sealing applications, especially in poultry and fish fillet products.

A recent study published on The Poultry Site confirmed that cold plasma-treated films effectively reduce microbial contamination on deli meats over a 12-week storage period without affecting taste or texture. This innovative packaging technology employs non-thermal plasma to inactivate bacteria, offering enhanced food safety and extended shelf life.

The advancement addresses rising consumer demand for safer, longer-lasting meat, poultry, and seafood products. Cold plasma packaging is gaining traction as a sustainable, chemical-free alternative in active packaging solutions, reflecting ongoing industry efforts to improve product quality and safety in the protein packaging sector.

Metric Value
Market Size (2025) USD 8.19 billion
Market Size (2035) USD 12.55 billion
CAGR (2025 to 2035) 4.4%

Semi Annual Market Update

The below table presents the expected CAGR for the global MEAT, POULTRY, AND SEAFOOD PACKAGING market over several semi-annual periods spanning from 2024 to 2034.

Particular Value CAGR
H1 (2024 to 2034) 1.4%
H2 (2024 to 2034) 2.7%
H1 (2025 to 2035) 2.2%
H2 (2025 to 2035) 3.3%

In the first half (H1) of the decade from 2024 to 2034, the business is predicted to surge at a CAGR of 1.4%, followed by a slightly higher growth rate of 2.7% in the second half (H2) of the same decade.

Moving into the subsequent period, from H1 2024 to H2 2034, the CAGR is projected to decrease slightly to 2.2% in the first half and remain relatively moderate at 3.3% in the second half. In the first half (H1) the market witnessed a decrease of 80 BPS while in the second half (H2), the market witnessed an increase of 60 BPS.

Analyzing Meat, Poultry, and Seafood Packaging Market by Top Investment Segments

The section contains information about the leading segments in the industry. In terms of packaging technology, modified atmosphere estimated to account for a share over 40% by 2035. By product types, films are projected to dominate by holding a share of 28.3% by the end 2035.

Modified Atmosphere Packaging to Maintain Freshness and Extend Product Shelf Life

Packaging Technology Market Share (2035)
Modified Atmosphere 42.0%

MAP is widely used in the meat, poultry, and seafood packaging market, as it helps increase shelf life while keeping the products fresh. In MAP, the oxygen within the package is substituted by a controlled mix of gases, such as carbon dioxide and nitrogen, which slows the growth of microbes, thus oxidation. The technology maintains product safety and appearance by retaining its natural color and texture.

For instance, MAP in seafood packaging prevents spoilage and decreases odor, meaning the product can be transported with a good chance of remaining marketable. It’s advantage of reducing food waste and providing consumers with fresh, high-quality products is its popularity.

High Demand for Films Because Of Its Versatility & Barrier Properties for Product Protection

Product Type Market Share (2035)
Films 28.3%

Films are used most in meat, poultry, and seafood packaging. They are versatile, cost-effective, and provide excellent barrier properties for the protection of products from moisture, oxygen, and contamination, prolonging shelf life with freshness.

Their flexibility enables use in various formats, such as vacuum pouches and modified atmosphere packaging. Films are lightweight, reducing transportation costs, and are often customizable for branding or product information.

A good example is the vacuum-sealed film packaging of fresh poultry, which prevents moisture loss, thus hindering bacterial growth, and maintains the meat tender and safe for consumption throughout storage and during retail display. It thus makes it preferred both by supermarkets and food processors.

Key Industry Highlights

Need for Food Safety & Hygiene Drives Demand for Secured Packaging to Prevent Contamination

In the market concerning meat, poultry, and seafood packaging, growing importance on food safety and hygiene is noticed. Packaging acts as an important aspect in the prevention of contamination as products are sealed and protected from outer harmful factors.

In addition to all these, tamper-evident packaging creates another layer of security which results in consumers having confidence in the product's safety. In developed markets, packaging needs to maintain hygiene standards and facilitate traceability and face rigorous food safety regulations.

This includes using material that supports the tracking and monitoring of products up and down the supply chain in order to have products that can meet regulatory compliance. As a result, packaging solutions that address the health and safety concerns are fueling growth within the market.

Increased Meat Consumption Spurs Demand for Flexible & Convenient Packaging

The growing consumption of meat, poultry, and seafood products among gym enthusiasts is increasing demand due to higher protein levels and nutritional benefits. As increasing consumers continue seeking meat, poultry, or seafood products to fulfill diet-related requirements, growth in the packaging market for these products is being recorded.

The resulting trend has consequently increased demand for packaging solutions preserving freshness, convenience, and quality. Increased in demand are pouches, films, and trays because they can offer flexibility, durability, and protection. Pouches work best for portioned servings. Films offer very good barrier properties, thereby lengthening the shelf life.

Trays, with the option of vacuum-sealed applications, both present and protect. Such options fit well into health-conscious consumers seeking convenience and integrity in their product. The resultant consumption of these foods is thereby pushing the demand for meat, poultry and seafood packaging to preserve quality and nutritional value.

Challenges Related to Sustainability Concerns May Hamper Growth

Sustainability concerns may hinder this market growth. The meat and seafood packaging rely heavily on the use of plastics, which cause a lot of ecological resistance.

They are gradually looking towards eco-friendly, biodegradable, or compostable packaging due to its significant cost. A lot of progress is needed toward the development technology for the raw materials and consequently higher production expense than plastic package.

Therefore, companies might delay their adoption of these sustainable solutions for fear that the resultant hike in the cost will make the products expensive. This can delay the general adoption of greener packaging alternatives in the industry.

Market Concentration

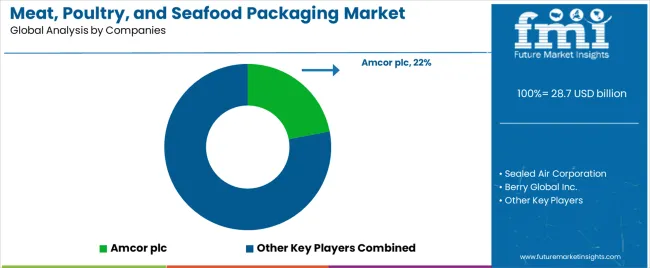
Tier 1 companies comprise market leaders capturing significant market share in meat, poultry, and seafood packaging market. These market leaders are characterized by high production capacity and a wide product portfolio. These market leaders are distinguished by their extensive expertise in manufacturing across multiple packaging formats and a broad geographical reach, underpinned by a robust consumer base.

They provide a wide range of series including recycling and manufacturing utilizing the latest technology and meeting the regulatory standards providing the highest quality. Prominent companies within tier 1 include Amcor Plc, Berry Global Group Inc., and Sealed Air Corporation among others.

Tier 2 companies include mid-size players having presence in specific regions and highly influencing the local market. These are characterized by a strong presence overseas and strong market knowledge. These market players have good technology and ensure regulatory compliance but may not have advanced technology and wide global reach.

Prominent companies in tier 2 include Winpak Ltd., Mondi plc, Bollore Group., Constantia Flexibles Group GmbH, and Sonoco Products Company, Smurfit Kappa, Thantawan Industry plc, Cascades Inc, R. Faerch Plast A/S, Amerplast Ltd., Plastopil, Sirane Group and Viskase® Companies, Inc.

Tier 3 includes the majority of small-scale companies operating at the local presence and serving niche markets. These companies are notably oriented towards fulfilling local market demands and are consequently classified within the tier 3 share segment.

They are small-scale players and have limited geographical reach. Tier 3, within this context, is recognized as an unorganized market, denoting a sector characterized by a lack of extensive structure and formalization when compared to organized competitors.

Country-wise Insights

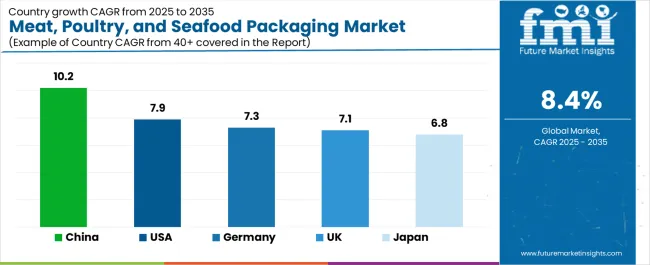
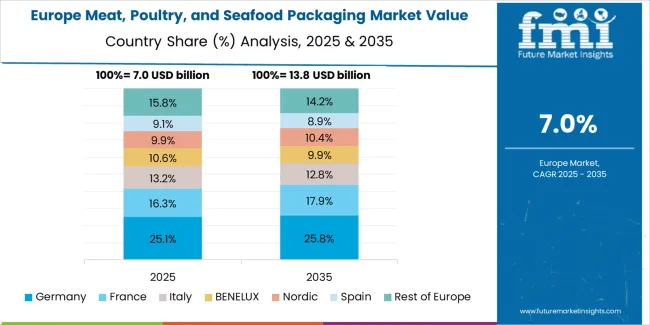
The section below covers the future forecast for the meat, poultry, and seafood packaging market in terms of countries. Information on key countries in several parts of the globe, including North America, Latin America, East Asia, South Asia and Pacific, Western Europe, Eastern Europe and MEA is provided. USA is expected to account for a CAGR of 3.4% through 2035. In Europe, Germany is projected to witness a CAGR of 2.7% by 2035.

Countries Value CAGR (2025 to 2035)
USA 3.4%
Germany 2.7%
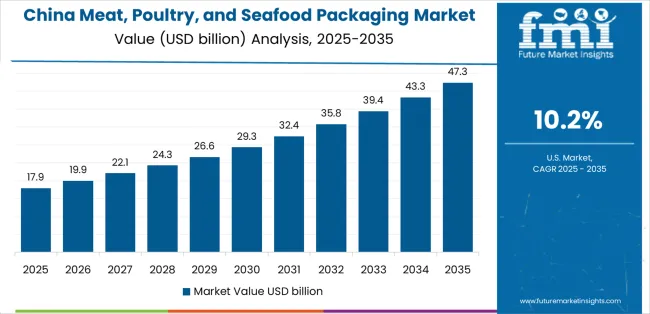
China 5.8%
UK 2.2%
Spain 2.6%
India 6.9%
Canada 3.0%

Food Safety Regulations in USA Drive Need for Advanced Packaging for Freshness and Quality

Due to strict FDA and USDA regulations in the United States, complex packaging solutions are needed to avoid the intake of spoiled food and maintain food safety.

The regulatory requirements are directed towards the freshness of packed items, reducing contamination, and traceability. MAP technologies have become quite common; the oxygen level is lowered to slow down spoilage and the rate of bacteria growth.

Vacuum sealing also contributes by removing air, maintaining the quality of the product, and increasing shelf life. Moreover, it must be very strong and rigid so that any form of outside influence doesn't damage it. The stricter regulations will therefore demand safe and secured packaging solutions such as pouches, films, trays, etc. in the case of meat, poultry, and seafood.

German Meat Export Industry Leads to High Demand for Advanced Packaging Solutions

Germany is an important meat exporter in the world. Meat products, mainly pork and poultry, have high requirements for packaging solutions that extend shelf life and maintain product freshness during transport.

Therefore, manufacturers are fast turning towards international standards and products remaining fresh under diverse conditions. This often requires packaging technologies such as vacuum skin and vacuum thermoformed packaging. These methods prevent the oxygen from spoiling the product as they create an airtight seal.

As German exports reach markets all over the world, the requirement for packaging which will protect from temperature fluctuations and physical damage would increase, increasing demand for such advanced packaging solutions in the meat, poultry, and seafood industries.

Competitive Landscape

Key players of global meat, poultry, and seafood packaging industry are developing and launching new products in the market. They are integrating with different firms and extending their geographical presence. Few of them are also collaborating and partnering with local brands and start-up companies

Key Developments

  • In November 2024, Berry Global completed the spin-off and merger of its Health, Hygiene, and Specialties Global Nonwovens and Films business with Glatfelter Corporation, resulting in the creation of Magnera Corporation. This move allowed Berry to focus more on its core packaging operations, including those serving the meat, poultry, and seafood industries.
  • In January 2024, SEE introduced a biobased, industrial compostable tray designed for protein packaging. This tray meets the demands of existing food processing equipment, offering a sustainable alternative to traditional packaging materials.

Key Players in Meat, Poultry, and Seafood Packaging Market

  • Amcor plc
  • Berry Global Group, Inc.
  • Winpak Ltd.
  • Sealed Air Corp.
  • Mondi plc
  • Sonoco Products Company
  • Constantia Flexibles Group Gmbh
  • Thantawan Industry Plc
  • Cascades Inc
  • Bolloré Group
  • Amerplast Ltd.
  • R. Faerch Plast A/S
  • Smurfit Kappa Group
  • Plastopil
  • Sirane Group
  • Viskase® Companies, Inc.

Report Scope - Meat, Poultry, and Seafood Packaging Market

Report Attributes Details
Market Size (2025) USD 8.19 billion
Projected Market Size (2035) USD 12.55 billion
CAGR (2025 to 2035) 4.4%
Base Year for Estimation 2024
Historical Period 2020 to 2024
Projection Period 2025 to 2035
Quantitative Units USD billion for Value & Thousand Tons for Volume
Product Type (Segment 1) Bags, Pouches, Films, Trays, Wraps
Material (Segment 2) Polyethylene (PE), Polypropylene (PP), Polyvinyl Chloride (PVC), Ethylene Vinyl Alcohol (EVOH), Polyamide (PA), Others (Polyvinylidene Chloride - PVDC)
Meat Type (Segment 3) Beef, Pork, Poultry, Seafood, Others (Lamb, Goat, etc.)
Thickness (Segment 4) Below 80 μm, 80 to 150 μm, 150 to 250 μm, Above 250 μm
Packaging Technology (Segment 5) Modified Atmosphere, Vacuum Skin, Vacuum Thermoformed, Others (Active Packaging, etc.)
Regions Covered North America, Latin America, East Asia, South Asia & Pacific, Western Europe, Eastern Europe, Middle East & Africa
Countries Covered United States, Canada, Mexico, Brazil, Germany, UK, France, China, Japan, India, ASEAN Countries, GCC Countries, South Africa
Key Players Influencing the Market Amcor plc, Berry Global Group, Inc., Winpak Ltd., Sealed Air Corp., Mondi Plc, Sonoco Products Company, Constantia Flexibles Group GmbH, Thantawan Industry Plc, Cascades Inc., Bolloré Group
Additional Attributes Dollar sales, share, rising demand for sustainable packaging, innovations in modified atmosphere packaging, increasing seafood & poultry consumption globally, regulatory focus on food safety and shelf life extension

Global Meat, Poultry, and Seafood Packaging Market Segmentation

By Product Type:

Product types in meat, poultry, and seafood packaging include bags, pouches, films, trays and wraps.

By Material:

In terms of material, the market for meat, poultry, and seafood packaging is divided into polyethylene (PE), polypropylene (PP), polyvinyl chloride (PVC), ethylene vinyl alcohol (EVOH), polyamide (PA) and others (polyvinylidene chloride (PVDC), etc.)

By Meat Type:

Meat types in market for meat, poultry, and seafood packaging include beef, pork, poultry, seafood and others (Lamb, Goat, etc.).

By Thickness:

In terms of thickness, the market for meat, poultry, and seafood packaging is segmented into below 80 um, 80 to 150 um, 150 to 250 um and above 250 um.

By Packaging Technology:

Packaging technologies in meat, poultry, and seafood packaging are modified atmosphere, vacuum skin, vacuum thermoformed and others (Active Packaging, etc.).

By Region:

Key Countries of North America, Latin America, East Asia, South Asia & Pacific, Western Europe, Eastern Europe and Middle East & Africa are covered.

Table of Content

  1. Executive Summary
  2. Industry Introduction, including Taxonomy and Market Definition
  3. Market Trends and Success Factors, including Macro-Economic Factors, Market Dynamics, and Recent Industry Developments
  4. Global Market Demand Analysis 2020 to 2024 and Forecast 2025 to 2035, including Historical Analysis and Future Projections
  5. Global Market Analysis 2020 to 2024 and Forecast 2025 to 2035
    • Product Type
    • Material
    • Meat Type
    • Thickness
    • Packaging Technology
  6. Global Market Analysis 2020 to 2024 and Forecast 2025 to 2035, By Product Type
    • Films
    • Pouches
    • Bags
    • Wraps
    • Trays
  7. Global Market Analysis 2020 to 2024 and Forecast 2025 to 2035, By Material
    • Polyethylene (PE)
    • Polypropylene (PP)
    • Polyvinyl chloride (PVC)
    • Ethylene vinyl alcohol (EVOH)
    • Polyamide (PA)
    • Others (polyvinylidene chloride (PVDC), etc.)
  8. Global Market Analysis 2020 to 2024 and Forecast 2025 to 2035, By Meat Type
    • Beef
    • Poultry
    • Pork
    • Seafood
    • Others (Lamb, Goat, etc.)
  9. Global Market Analysis 2020 to 2024 and Forecast 2025 to 2035, By Thickness
    • Below 80 um
    • 80 to 150 um
    • 150 to 250 um
    • Above 250 um
  10. Global Market Analysis 2020 to 2024 and Forecast 2025 to 2035, By Packaging Technology
    • Vacuum Skin
    • Modified Atmosphere
    • Vacuum Thermoformed
    • Others (Active Packaging, etc.)
  11. Global Market Analysis 2020 to 2024 and Forecast 2025 to 2035, By Region
    • North America
    • Latin America
    • Western Europe
    • Eastern Europe
    • East Asia
    • South Asia & Pacific
    • Middle East & Africa
  12. North America Sales Analysis 2020 to 2024 and Forecast 2025 to 2035, by Key Segments and Countries
  13. Latin America Sales Analysis 2020 to 2024 and Forecast 2025 to 2035, by Key Segments and Countries
  14. Western Europe Sales Analysis 2020 to 2024 and Forecast 2025 to 2035, by Key Segments and Countries
  15. Eastern Europe Sales Analysis 2020 to 2024 and Forecast 2025 to 2035, by Key Segments and Countries
  16. East Asia Sales Analysis 2020 to 2024 and Forecast 2025 to 2035, by Key Segments and Countries
  17. South Asia & Pacific Sales Analysis 2020 to 2024 and Forecast 2025 to 2035, by Key Segments and Countries
  18. Middle East & Africa Sales Analysis 2020 to 2024 and Forecast 2025 to 2035, by Key Segments and Countries
  19. Sales Forecast 2025 to 2035 by Product Type, Material, Meat Type, Thickness, and Packaging Technology for 30 Countries
  20. Competition Outlook, including Market Structure Analysis, Company Share Analysis by Key Players, and Competition Dashboard
  21. Company Profile
    • Amcor plc
    • Berry Global Group, Inc.
    • Winpak Ltd.
    • Sealed Air Corp.
    • Mondi Plc
    • Sonoco Products Company
    • Constantia Flexibles Group Gmbh
    • Thantawan Industry Plc
    • Cascades Inc
    • Bolloré Group

List of Tables

Table 1: Global Market Value (US$ Million) Forecast by Region, 2019 to 2034

Table 2: Global Market Volume (Units) Forecast by Region, 2019 to 2034

Table 3: Global Market Value (US$ Million) Forecast by Packaging Type, 2019 to 2034

Table 4: Global Market Volume (Units) Forecast by Packaging Type, 2019 to 2034

Table 5: Global Market Value (US$ Million) Forecast by Product Type, 2019 to 2034

Table 6: Global Market Volume (Units) Forecast by Product Type, 2019 to 2034

Table 7: Global Market Value (US$ Million) Forecast by Material Type, 2019 to 2034

Table 8: Global Market Volume (Units) Forecast by Material Type, 2019 to 2034

Table 9: Global Market Value (US$ Million) Forecast by Application, 2019 to 2034

Table 10: Global Market Volume (Units) Forecast by Application, 2019 to 2034

Table 11: North America Market Value (US$ Million) Forecast by Country, 2019 to 2034

Table 12: North America Market Volume (Units) Forecast by Country, 2019 to 2034

Table 13: North America Market Value (US$ Million) Forecast by Packaging Type, 2019 to 2034

Table 14: North America Market Volume (Units) Forecast by Packaging Type, 2019 to 2034

Table 15: North America Market Value (US$ Million) Forecast by Product Type, 2019 to 2034

Table 16: North America Market Volume (Units) Forecast by Product Type, 2019 to 2034

Table 17: North America Market Value (US$ Million) Forecast by Material Type, 2019 to 2034

Table 18: North America Market Volume (Units) Forecast by Material Type, 2019 to 2034

Table 19: North America Market Value (US$ Million) Forecast by Application, 2019 to 2034

Table 20: North America Market Volume (Units) Forecast by Application, 2019 to 2034

Table 21: Latin America Market Value (US$ Million) Forecast by Country, 2019 to 2034

Table 22: Latin America Market Volume (Units) Forecast by Country, 2019 to 2034

Table 23: Latin America Market Value (US$ Million) Forecast by Packaging Type, 2019 to 2034

Table 24: Latin America Market Volume (Units) Forecast by Packaging Type, 2019 to 2034

Table 25: Latin America Market Value (US$ Million) Forecast by Product Type, 2019 to 2034

Table 26: Latin America Market Volume (Units) Forecast by Product Type, 2019 to 2034

Table 27: Latin America Market Value (US$ Million) Forecast by Material Type, 2019 to 2034

Table 28: Latin America Market Volume (Units) Forecast by Material Type, 2019 to 2034

Table 29: Latin America Market Value (US$ Million) Forecast by Application, 2019 to 2034

Table 30: Latin America Market Volume (Units) Forecast by Application, 2019 to 2034

Table 31: Western Europe Market Value (US$ Million) Forecast by Country, 2019 to 2034

Table 32: Western Europe Market Volume (Units) Forecast by Country, 2019 to 2034

Table 33: Western Europe Market Value (US$ Million) Forecast by Packaging Type, 2019 to 2034

Table 34: Western Europe Market Volume (Units) Forecast by Packaging Type, 2019 to 2034

Table 35: Western Europe Market Value (US$ Million) Forecast by Product Type, 2019 to 2034

Table 36: Western Europe Market Volume (Units) Forecast by Product Type, 2019 to 2034

Table 37: Western Europe Market Value (US$ Million) Forecast by Material Type, 2019 to 2034

Table 38: Western Europe Market Volume (Units) Forecast by Material Type, 2019 to 2034

Table 39: Western Europe Market Value (US$ Million) Forecast by Application, 2019 to 2034

Table 40: Western Europe Market Volume (Units) Forecast by Application, 2019 to 2034

Table 41: Eastern Europe Market Value (US$ Million) Forecast by Country, 2019 to 2034

Table 42: Eastern Europe Market Volume (Units) Forecast by Country, 2019 to 2034

Table 43: Eastern Europe Market Value (US$ Million) Forecast by Packaging Type, 2019 to 2034

Table 44: Eastern Europe Market Volume (Units) Forecast by Packaging Type, 2019 to 2034

Table 45: Eastern Europe Market Value (US$ Million) Forecast by Product Type, 2019 to 2034

Table 46: Eastern Europe Market Volume (Units) Forecast by Product Type, 2019 to 2034

Table 47: Eastern Europe Market Value (US$ Million) Forecast by Material Type, 2019 to 2034

Table 48: Eastern Europe Market Volume (Units) Forecast by Material Type, 2019 to 2034

Table 49: Eastern Europe Market Value (US$ Million) Forecast by Application, 2019 to 2034

Table 50: Eastern Europe Market Volume (Units) Forecast by Application, 2019 to 2034

Table 51: South Asia and Pacific Market Value (US$ Million) Forecast by Country, 2019 to 2034

Table 52: South Asia and Pacific Market Volume (Units) Forecast by Country, 2019 to 2034

Table 53: South Asia and Pacific Market Value (US$ Million) Forecast by Packaging Type, 2019 to 2034

Table 54: South Asia and Pacific Market Volume (Units) Forecast by Packaging Type, 2019 to 2034

Table 55: South Asia and Pacific Market Value (US$ Million) Forecast by Product Type, 2019 to 2034

Table 56: South Asia and Pacific Market Volume (Units) Forecast by Product Type, 2019 to 2034

Table 57: South Asia and Pacific Market Value (US$ Million) Forecast by Material Type, 2019 to 2034

Table 58: South Asia and Pacific Market Volume (Units) Forecast by Material Type, 2019 to 2034

Table 59: South Asia and Pacific Market Value (US$ Million) Forecast by Application, 2019 to 2034

Table 60: South Asia and Pacific Market Volume (Units) Forecast by Application, 2019 to 2034

Table 61: East Asia Market Value (US$ Million) Forecast by Country, 2019 to 2034

Table 62: East Asia Market Volume (Units) Forecast by Country, 2019 to 2034

Table 63: East Asia Market Value (US$ Million) Forecast by Packaging Type, 2019 to 2034

Table 64: East Asia Market Volume (Units) Forecast by Packaging Type, 2019 to 2034

Table 65: East Asia Market Value (US$ Million) Forecast by Product Type, 2019 to 2034

Table 66: East Asia Market Volume (Units) Forecast by Product Type, 2019 to 2034

Table 67: East Asia Market Value (US$ Million) Forecast by Material Type, 2019 to 2034

Table 68: East Asia Market Volume (Units) Forecast by Material Type, 2019 to 2034

Table 69: East Asia Market Value (US$ Million) Forecast by Application, 2019 to 2034

Table 70: East Asia Market Volume (Units) Forecast by Application, 2019 to 2034

Table 71: Middle East and Africa Market Value (US$ Million) Forecast by Country, 2019 to 2034

Table 72: Middle East and Africa Market Volume (Units) Forecast by Country, 2019 to 2034

Table 73: Middle East and Africa Market Value (US$ Million) Forecast by Packaging Type, 2019 to 2034

Table 74: Middle East and Africa Market Volume (Units) Forecast by Packaging Type, 2019 to 2034

Table 75: Middle East and Africa Market Value (US$ Million) Forecast by Product Type, 2019 to 2034

Table 76: Middle East and Africa Market Volume (Units) Forecast by Product Type, 2019 to 2034

Table 77: Middle East and Africa Market Value (US$ Million) Forecast by Material Type, 2019 to 2034

Table 78: Middle East and Africa Market Volume (Units) Forecast by Material Type, 2019 to 2034

Table 79: Middle East and Africa Market Value (US$ Million) Forecast by Application, 2019 to 2034

Table 80: Middle East and Africa Market Volume (Units) Forecast by Application, 2019 to 2034

List of Figures

Figure 1: Global Market Value (US$ Million) by Packaging Type, 2024 to 2034

Figure 2: Global Market Value (US$ Million) by Product Type, 2024 to 2034

Figure 3: Global Market Value (US$ Million) by Material Type, 2024 to 2034

Figure 4: Global Market Value (US$ Million) by Application, 2024 to 2034

Figure 5: Global Market Value (US$ Million) by Region, 2024 to 2034

Figure 6: Global Market Value (US$ Million) Analysis by Region, 2019 to 2034

Figure 7: Global Market Volume (Units) Analysis by Region, 2019 to 2034

Figure 8: Global Market Value Share (%) and BPS Analysis by Region, 2024 to 2034

Figure 9: Global Market Y-o-Y Growth (%) Projections by Region, 2024 to 2034

Figure 10: Global Market Value (US$ Million) Analysis by Packaging Type, 2019 to 2034

Figure 11: Global Market Volume (Units) Analysis by Packaging Type, 2019 to 2034

Figure 12: Global Market Value Share (%) and BPS Analysis by Packaging Type, 2024 to 2034

Figure 13: Global Market Y-o-Y Growth (%) Projections by Packaging Type, 2024 to 2034

Figure 14: Global Market Value (US$ Million) Analysis by Product Type, 2019 to 2034

Figure 15: Global Market Volume (Units) Analysis by Product Type, 2019 to 2034

Figure 16: Global Market Value Share (%) and BPS Analysis by Product Type, 2024 to 2034

Figure 17: Global Market Y-o-Y Growth (%) Projections by Product Type, 2024 to 2034

Figure 18: Global Market Value (US$ Million) Analysis by Material Type, 2019 to 2034

Figure 19: Global Market Volume (Units) Analysis by Material Type, 2019 to 2034

Figure 20: Global Market Value Share (%) and BPS Analysis by Material Type, 2024 to 2034

Figure 21: Global Market Y-o-Y Growth (%) Projections by Material Type, 2024 to 2034

Figure 22: Global Market Value (US$ Million) Analysis by Application, 2019 to 2034

Figure 23: Global Market Volume (Units) Analysis by Application, 2019 to 2034

Figure 24: Global Market Value Share (%) and BPS Analysis by Application, 2024 to 2034

Figure 25: Global Market Y-o-Y Growth (%) Projections by Application, 2024 to 2034

Figure 26: Global Market Attractiveness by Packaging Type, 2024 to 2034

Figure 27: Global Market Attractiveness by Product Type, 2024 to 2034

Figure 28: Global Market Attractiveness by Material Type, 2024 to 2034

Figure 29: Global Market Attractiveness by Application, 2024 to 2034

Figure 30: Global Market Attractiveness by Region, 2024 to 2034

Figure 31: North America Market Value (US$ Million) by Packaging Type, 2024 to 2034

Figure 32: North America Market Value (US$ Million) by Product Type, 2024 to 2034

Figure 33: North America Market Value (US$ Million) by Material Type, 2024 to 2034

Figure 34: North America Market Value (US$ Million) by Application, 2024 to 2034

Figure 35: North America Market Value (US$ Million) by Country, 2024 to 2034

Figure 36: North America Market Value (US$ Million) Analysis by Country, 2019 to 2034

Figure 37: North America Market Volume (Units) Analysis by Country, 2019 to 2034

Figure 38: North America Market Value Share (%) and BPS Analysis by Country, 2024 to 2034

Figure 39: North America Market Y-o-Y Growth (%) Projections by Country, 2024 to 2034

Figure 40: North America Market Value (US$ Million) Analysis by Packaging Type, 2019 to 2034

Figure 41: North America Market Volume (Units) Analysis by Packaging Type, 2019 to 2034

Figure 42: North America Market Value Share (%) and BPS Analysis by Packaging Type, 2024 to 2034

Figure 43: North America Market Y-o-Y Growth (%) Projections by Packaging Type, 2024 to 2034

Figure 44: North America Market Value (US$ Million) Analysis by Product Type, 2019 to 2034

Figure 45: North America Market Volume (Units) Analysis by Product Type, 2019 to 2034

Figure 46: North America Market Value Share (%) and BPS Analysis by Product Type, 2024 to 2034

Figure 47: North America Market Y-o-Y Growth (%) Projections by Product Type, 2024 to 2034

Figure 48: North America Market Value (US$ Million) Analysis by Material Type, 2019 to 2034

Figure 49: North America Market Volume (Units) Analysis by Material Type, 2019 to 2034

Figure 50: North America Market Value Share (%) and BPS Analysis by Material Type, 2024 to 2034

Figure 51: North America Market Y-o-Y Growth (%) Projections by Material Type, 2024 to 2034

Figure 52: North America Market Value (US$ Million) Analysis by Application, 2019 to 2034

Figure 53: North America Market Volume (Units) Analysis by Application, 2019 to 2034

Figure 54: North America Market Value Share (%) and BPS Analysis by Application, 2024 to 2034

Figure 55: North America Market Y-o-Y Growth (%) Projections by Application, 2024 to 2034

Figure 56: North America Market Attractiveness by Packaging Type, 2024 to 2034

Figure 57: North America Market Attractiveness by Product Type, 2024 to 2034

Figure 58: North America Market Attractiveness by Material Type, 2024 to 2034

Figure 59: North America Market Attractiveness by Application, 2024 to 2034

Figure 60: North America Market Attractiveness by Country, 2024 to 2034

Figure 61: Latin America Market Value (US$ Million) by Packaging Type, 2024 to 2034

Figure 62: Latin America Market Value (US$ Million) by Product Type, 2024 to 2034

Figure 63: Latin America Market Value (US$ Million) by Material Type, 2024 to 2034

Figure 64: Latin America Market Value (US$ Million) by Application, 2024 to 2034

Figure 65: Latin America Market Value (US$ Million) by Country, 2024 to 2034

Figure 66: Latin America Market Value (US$ Million) Analysis by Country, 2019 to 2034

Figure 67: Latin America Market Volume (Units) Analysis by Country, 2019 to 2034

Figure 68: Latin America Market Value Share (%) and BPS Analysis by Country, 2024 to 2034

Figure 69: Latin America Market Y-o-Y Growth (%) Projections by Country, 2024 to 2034

Figure 70: Latin America Market Value (US$ Million) Analysis by Packaging Type, 2019 to 2034

Figure 71: Latin America Market Volume (Units) Analysis by Packaging Type, 2019 to 2034

Figure 72: Latin America Market Value Share (%) and BPS Analysis by Packaging Type, 2024 to 2034

Figure 73: Latin America Market Y-o-Y Growth (%) Projections by Packaging Type, 2024 to 2034

Figure 74: Latin America Market Value (US$ Million) Analysis by Product Type, 2019 to 2034

Figure 75: Latin America Market Volume (Units) Analysis by Product Type, 2019 to 2034

Figure 76: Latin America Market Value Share (%) and BPS Analysis by Product Type, 2024 to 2034

Figure 77: Latin America Market Y-o-Y Growth (%) Projections by Product Type, 2024 to 2034

Figure 78: Latin America Market Value (US$ Million) Analysis by Material Type, 2019 to 2034

Figure 79: Latin America Market Volume (Units) Analysis by Material Type, 2019 to 2034

Figure 80: Latin America Market Value Share (%) and BPS Analysis by Material Type, 2024 to 2034

Figure 81: Latin America Market Y-o-Y Growth (%) Projections by Material Type, 2024 to 2034

Figure 82: Latin America Market Value (US$ Million) Analysis by Application, 2019 to 2034

Figure 83: Latin America Market Volume (Units) Analysis by Application, 2019 to 2034

Figure 84: Latin America Market Value Share (%) and BPS Analysis by Application, 2024 to 2034

Figure 85: Latin America Market Y-o-Y Growth (%) Projections by Application, 2024 to 2034

Figure 86: Latin America Market Attractiveness by Packaging Type, 2024 to 2034

Figure 87: Latin America Market Attractiveness by Product Type, 2024 to 2034

Figure 88: Latin America Market Attractiveness by Material Type, 2024 to 2034

Figure 89: Latin America Market Attractiveness by Application, 2024 to 2034

Figure 90: Latin America Market Attractiveness by Country, 2024 to 2034

Figure 91: Western Europe Market Value (US$ Million) by Packaging Type, 2024 to 2034

Figure 92: Western Europe Market Value (US$ Million) by Product Type, 2024 to 2034

Figure 93: Western Europe Market Value (US$ Million) by Material Type, 2024 to 2034

Figure 94: Western Europe Market Value (US$ Million) by Application, 2024 to 2034

Figure 95: Western Europe Market Value (US$ Million) by Country, 2024 to 2034

Figure 96: Western Europe Market Value (US$ Million) Analysis by Country, 2019 to 2034

Figure 97: Western Europe Market Volume (Units) Analysis by Country, 2019 to 2034

Figure 98: Western Europe Market Value Share (%) and BPS Analysis by Country, 2024 to 2034

Figure 99: Western Europe Market Y-o-Y Growth (%) Projections by Country, 2024 to 2034

Figure 100: Western Europe Market Value (US$ Million) Analysis by Packaging Type, 2019 to 2034

Figure 101: Western Europe Market Volume (Units) Analysis by Packaging Type, 2019 to 2034

Figure 102: Western Europe Market Value Share (%) and BPS Analysis by Packaging Type, 2024 to 2034

Figure 103: Western Europe Market Y-o-Y Growth (%) Projections by Packaging Type, 2024 to 2034

Figure 104: Western Europe Market Value (US$ Million) Analysis by Product Type, 2019 to 2034

Figure 105: Western Europe Market Volume (Units) Analysis by Product Type, 2019 to 2034

Figure 106: Western Europe Market Value Share (%) and BPS Analysis by Product Type, 2024 to 2034

Figure 107: Western Europe Market Y-o-Y Growth (%) Projections by Product Type, 2024 to 2034

Figure 108: Western Europe Market Value (US$ Million) Analysis by Material Type, 2019 to 2034

Figure 109: Western Europe Market Volume (Units) Analysis by Material Type, 2019 to 2034

Figure 110: Western Europe Market Value Share (%) and BPS Analysis by Material Type, 2024 to 2034

Figure 111: Western Europe Market Y-o-Y Growth (%) Projections by Material Type, 2024 to 2034

Figure 112: Western Europe Market Value (US$ Million) Analysis by Application, 2019 to 2034

Figure 113: Western Europe Market Volume (Units) Analysis by Application, 2019 to 2034

Figure 114: Western Europe Market Value Share (%) and BPS Analysis by Application, 2024 to 2034

Figure 115: Western Europe Market Y-o-Y Growth (%) Projections by Application, 2024 to 2034

Figure 116: Western Europe Market Attractiveness by Packaging Type, 2024 to 2034

Figure 117: Western Europe Market Attractiveness by Product Type, 2024 to 2034

Figure 118: Western Europe Market Attractiveness by Material Type, 2024 to 2034

Figure 119: Western Europe Market Attractiveness by Application, 2024 to 2034

Figure 120: Western Europe Market Attractiveness by Country, 2024 to 2034

Figure 121: Eastern Europe Market Value (US$ Million) by Packaging Type, 2024 to 2034

Figure 122: Eastern Europe Market Value (US$ Million) by Product Type, 2024 to 2034

Figure 123: Eastern Europe Market Value (US$ Million) by Material Type, 2024 to 2034

Figure 124: Eastern Europe Market Value (US$ Million) by Application, 2024 to 2034

Figure 125: Eastern Europe Market Value (US$ Million) by Country, 2024 to 2034

Figure 126: Eastern Europe Market Value (US$ Million) Analysis by Country, 2019 to 2034

Figure 127: Eastern Europe Market Volume (Units) Analysis by Country, 2019 to 2034

Figure 128: Eastern Europe Market Value Share (%) and BPS Analysis by Country, 2024 to 2034

Figure 129: Eastern Europe Market Y-o-Y Growth (%) Projections by Country, 2024 to 2034

Figure 130: Eastern Europe Market Value (US$ Million) Analysis by Packaging Type, 2019 to 2034

Figure 131: Eastern Europe Market Volume (Units) Analysis by Packaging Type, 2019 to 2034

Figure 132: Eastern Europe Market Value Share (%) and BPS Analysis by Packaging Type, 2024 to 2034

Figure 133: Eastern Europe Market Y-o-Y Growth (%) Projections by Packaging Type, 2024 to 2034

Figure 134: Eastern Europe Market Value (US$ Million) Analysis by Product Type, 2019 to 2034

Figure 135: Eastern Europe Market Volume (Units) Analysis by Product Type, 2019 to 2034

Figure 136: Eastern Europe Market Value Share (%) and BPS Analysis by Product Type, 2024 to 2034

Figure 137: Eastern Europe Market Y-o-Y Growth (%) Projections by Product Type, 2024 to 2034

Figure 138: Eastern Europe Market Value (US$ Million) Analysis by Material Type, 2019 to 2034

Figure 139: Eastern Europe Market Volume (Units) Analysis by Material Type, 2019 to 2034

Figure 140: Eastern Europe Market Value Share (%) and BPS Analysis by Material Type, 2024 to 2034

Figure 141: Eastern Europe Market Y-o-Y Growth (%) Projections by Material Type, 2024 to 2034

Figure 142: Eastern Europe Market Value (US$ Million) Analysis by Application, 2019 to 2034

Figure 143: Eastern Europe Market Volume (Units) Analysis by Application, 2019 to 2034

Figure 144: Eastern Europe Market Value Share (%) and BPS Analysis by Application, 2024 to 2034

Figure 145: Eastern Europe Market Y-o-Y Growth (%) Projections by Application, 2024 to 2034

Figure 146: Eastern Europe Market Attractiveness by Packaging Type, 2024 to 2034

Figure 147: Eastern Europe Market Attractiveness by Product Type, 2024 to 2034

Figure 148: Eastern Europe Market Attractiveness by Material Type, 2024 to 2034

Figure 149: Eastern Europe Market Attractiveness by Application, 2024 to 2034

Figure 150: Eastern Europe Market Attractiveness by Country, 2024 to 2034

Figure 151: South Asia and Pacific Market Value (US$ Million) by Packaging Type, 2024 to 2034

Figure 152: South Asia and Pacific Market Value (US$ Million) by Product Type, 2024 to 2034

Figure 153: South Asia and Pacific Market Value (US$ Million) by Material Type, 2024 to 2034

Figure 154: South Asia and Pacific Market Value (US$ Million) by Application, 2024 to 2034

Figure 155: South Asia and Pacific Market Value (US$ Million) by Country, 2024 to 2034

Figure 156: South Asia and Pacific Market Value (US$ Million) Analysis by Country, 2019 to 2034

Figure 157: South Asia and Pacific Market Volume (Units) Analysis by Country, 2019 to 2034

Figure 158: South Asia and Pacific Market Value Share (%) and BPS Analysis by Country, 2024 to 2034

Figure 159: South Asia and Pacific Market Y-o-Y Growth (%) Projections by Country, 2024 to 2034

Figure 160: South Asia and Pacific Market Value (US$ Million) Analysis by Packaging Type, 2019 to 2034

Figure 161: South Asia and Pacific Market Volume (Units) Analysis by Packaging Type, 2019 to 2034

Figure 162: South Asia and Pacific Market Value Share (%) and BPS Analysis by Packaging Type, 2024 to 2034

Figure 163: South Asia and Pacific Market Y-o-Y Growth (%) Projections by Packaging Type, 2024 to 2034

Figure 164: South Asia and Pacific Market Value (US$ Million) Analysis by Product Type, 2019 to 2034

Figure 165: South Asia and Pacific Market Volume (Units) Analysis by Product Type, 2019 to 2034

Figure 166: South Asia and Pacific Market Value Share (%) and BPS Analysis by Product Type, 2024 to 2034

Figure 167: South Asia and Pacific Market Y-o-Y Growth (%) Projections by Product Type, 2024 to 2034

Figure 168: South Asia and Pacific Market Value (US$ Million) Analysis by Material Type, 2019 to 2034

Figure 169: South Asia and Pacific Market Volume (Units) Analysis by Material Type, 2019 to 2034

Figure 170: South Asia and Pacific Market Value Share (%) and BPS Analysis by Material Type, 2024 to 2034

Figure 171: South Asia and Pacific Market Y-o-Y Growth (%) Projections by Material Type, 2024 to 2034

Figure 172: South Asia and Pacific Market Value (US$ Million) Analysis by Application, 2019 to 2034

Figure 173: South Asia and Pacific Market Volume (Units) Analysis by Application, 2019 to 2034

Figure 174: South Asia and Pacific Market Value Share (%) and BPS Analysis by Application, 2024 to 2034

Figure 175: South Asia and Pacific Market Y-o-Y Growth (%) Projections by Application, 2024 to 2034

Figure 176: South Asia and Pacific Market Attractiveness by Packaging Type, 2024 to 2034

Figure 177: South Asia and Pacific Market Attractiveness by Product Type, 2024 to 2034

Figure 178: South Asia and Pacific Market Attractiveness by Material Type, 2024 to 2034

Figure 179: South Asia and Pacific Market Attractiveness by Application, 2024 to 2034

Figure 180: South Asia and Pacific Market Attractiveness by Country, 2024 to 2034

Figure 181: East Asia Market Value (US$ Million) by Packaging Type, 2024 to 2034

Figure 182: East Asia Market Value (US$ Million) by Product Type, 2024 to 2034

Figure 183: East Asia Market Value (US$ Million) by Material Type, 2024 to 2034

Figure 184: East Asia Market Value (US$ Million) by Application, 2024 to 2034

Figure 185: East Asia Market Value (US$ Million) by Country, 2024 to 2034

Figure 186: East Asia Market Value (US$ Million) Analysis by Country, 2019 to 2034

Figure 187: East Asia Market Volume (Units) Analysis by Country, 2019 to 2034

Figure 188: East Asia Market Value Share (%) and BPS Analysis by Country, 2024 to 2034

Figure 189: East Asia Market Y-o-Y Growth (%) Projections by Country, 2024 to 2034

Figure 190: East Asia Market Value (US$ Million) Analysis by Packaging Type, 2019 to 2034

Figure 191: East Asia Market Volume (Units) Analysis by Packaging Type, 2019 to 2034

Figure 192: East Asia Market Value Share (%) and BPS Analysis by Packaging Type, 2024 to 2034

Figure 193: East Asia Market Y-o-Y Growth (%) Projections by Packaging Type, 2024 to 2034

Figure 194: East Asia Market Value (US$ Million) Analysis by Product Type, 2019 to 2034

Figure 195: East Asia Market Volume (Units) Analysis by Product Type, 2019 to 2034

Figure 196: East Asia Market Value Share (%) and BPS Analysis by Product Type, 2024 to 2034

Figure 197: East Asia Market Y-o-Y Growth (%) Projections by Product Type, 2024 to 2034

Figure 198: East Asia Market Value (US$ Million) Analysis by Material Type, 2019 to 2034

Figure 199: East Asia Market Volume (Units) Analysis by Material Type, 2019 to 2034

Figure 200: East Asia Market Value Share (%) and BPS Analysis by Material Type, 2024 to 2034

Figure 201: East Asia Market Y-o-Y Growth (%) Projections by Material Type, 2024 to 2034

Figure 202: East Asia Market Value (US$ Million) Analysis by Application, 2019 to 2034

Figure 203: East Asia Market Volume (Units) Analysis by Application, 2019 to 2034

Figure 204: East Asia Market Value Share (%) and BPS Analysis by Application, 2024 to 2034

Figure 205: East Asia Market Y-o-Y Growth (%) Projections by Application, 2024 to 2034

Figure 206: East Asia Market Attractiveness by Packaging Type, 2024 to 2034

Figure 207: East Asia Market Attractiveness by Product Type, 2024 to 2034

Figure 208: East Asia Market Attractiveness by Material Type, 2024 to 2034

Figure 209: East Asia Market Attractiveness by Application, 2024 to 2034

Figure 210: East Asia Market Attractiveness by Country, 2024 to 2034

Figure 211: Middle East and Africa Market Value (US$ Million) by Packaging Type, 2024 to 2034

Figure 212: Middle East and Africa Market Value (US$ Million) by Product Type, 2024 to 2034

Figure 213: Middle East and Africa Market Value (US$ Million) by Material Type, 2024 to 2034

Figure 214: Middle East and Africa Market Value (US$ Million) by Application, 2024 to 2034

Figure 215: Middle East and Africa Market Value (US$ Million) by Country, 2024 to 2034

Figure 216: Middle East and Africa Market Value (US$ Million) Analysis by Country, 2019 to 2034

Figure 217: Middle East and Africa Market Volume (Units) Analysis by Country, 2019 to 2034

Figure 218: Middle East and Africa Market Value Share (%) and BPS Analysis by Country, 2024 to 2034

Figure 219: Middle East and Africa Market Y-o-Y Growth (%) Projections by Country, 2024 to 2034

Figure 220: Middle East and Africa Market Value (US$ Million) Analysis by Packaging Type, 2019 to 2034

Figure 221: Middle East and Africa Market Volume (Units) Analysis by Packaging Type, 2019 to 2034

Figure 222: Middle East and Africa Market Value Share (%) and BPS Analysis by Packaging Type, 2024 to 2034

Figure 223: Middle East and Africa Market Y-o-Y Growth (%) Projections by Packaging Type, 2024 to 2034

Figure 224: Middle East and Africa Market Value (US$ Million) Analysis by Product Type, 2019 to 2034

Figure 225: Middle East and Africa Market Volume (Units) Analysis by Product Type, 2019 to 2034

Figure 226: Middle East and Africa Market Value Share (%) and BPS Analysis by Product Type, 2024 to 2034

Figure 227: Middle East and Africa Market Y-o-Y Growth (%) Projections by Product Type, 2024 to 2034

Figure 228: Middle East and Africa Market Value (US$ Million) Analysis by Material Type, 2019 to 2034

Figure 229: Middle East and Africa Market Volume (Units) Analysis by Material Type, 2019 to 2034

Figure 230: Middle East and Africa Market Value Share (%) and BPS Analysis by Material Type, 2024 to 2034

Figure 231: Middle East and Africa Market Y-o-Y Growth (%) Projections by Material Type, 2024 to 2034

Figure 232: Middle East and Africa Market Value (US$ Million) Analysis by Application, 2019 to 2034

Figure 233: Middle East and Africa Market Volume (Units) Analysis by Application, 2019 to 2034

Figure 234: Middle East and Africa Market Value Share (%) and BPS Analysis by Application, 2024 to 2034

Figure 235: Middle East and Africa Market Y-o-Y Growth (%) Projections by Application, 2024 to 2034

Figure 236: Middle East and Africa Market Attractiveness by Packaging Type, 2024 to 2034

Figure 237: Middle East and Africa Market Attractiveness by Product Type, 2024 to 2034

Figure 238: Middle East and Africa Market Attractiveness by Material Type, 2024 to 2034

Figure 239: Middle East and Africa Market Attractiveness by Application, 2024 to 2034

Figure 240: Middle East and Africa Market Attractiveness by Country, 2024 to 2034

Frequently Asked Questions

What is the future of global meat, poultry, and seafood packaging industry?

The global meat, poultry, and seafood packaging industry is projected to witness CAGR of 4.4% between 2025 and 2035.

What was the worth of the global meat, poultry, and seafood packaging industry in 2024?

The global meat, poultry, and seafood packaging industry stood at USD 7.90 billion in 2024.

What will the worth of global meat, poultry, and seafood packaging industry by 2035 end?

Global meat, poultry, and seafood packaging industry is anticipated to reach USD 12.55 billion by 2035 end.

Which region to showcase the highest CAGR during forecast period?

South Asia & Pacific is set to record a CAGR of 7.2% in assessment period.

Who are the key players of global meat, poultry, and seafood packaging industry?

The key players operating in the global meat, poultry, and seafood packaging industry include Amcor Plc, Berry Global Group Inc., and Sealed Air Corporation among others.

Explore Similar Insights

Future Market Insights

Meat, Poultry, and Seafood Packaging Market