Soy-Based Meat Alternative Market Size, Share, and Forecast Outlook 2025 to 2035

The soy-based meat alternative market is projected to grow from USD 6.3 billion in 2025 to USD 16.8 billion by 2035, with a CAGR of 10.3%.
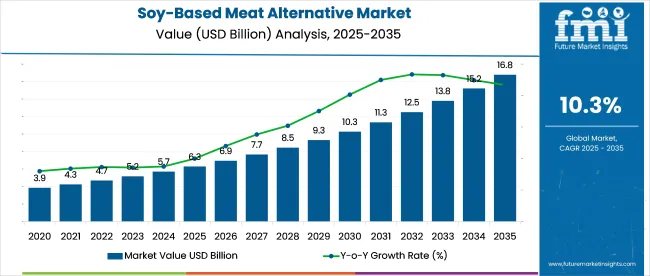
Quick Stats of the Soy-Based Meat Alternative Market

  • Industry Value (2025): USD 6.3 billion
  • Forecast Value (2035): USD 16.8 billion
  • Global CAGR (2025 to 2035): 10.3%
  • Leading Segment in 2025: Burgers (~31.0% share)
  • Key Growth Region: South Asia
  • Key Players: Beyond Meat, Impossible Foods, MorningStar Farms, Quorn Foods, Amy’s Kitchen

Soy Based Meat Alternative Market

Metric Value
Industry Value (2025) USD 6.3 billion
Industry Value (2035) USD 16.8 billion
CAGR (2025 to 2035) 10.3%

Reformulation efforts have reduced sodium content by up to 22% across leading SKUs while maintaining price points below USD 4.50 per unit in key markets. Over 65% of new product launches in 2023 to 2025 have focused on minced, patty, or nugget formats, reflecting high-volume retail and QSR demand.

Contract manufacturing facilities in Vietnam, Poland, and Serbia have increased throughput by 18-25% over the last two years, responding to expanded private-label orders from EU and APAC-based retailers. More than 40% of current global soy protein sourcing now involves identity-preserved or non-GMO streams, reflecting growing traceability mandates in North America and Europe.

Published on September 11, 2023, by USA Soy in sponsored content titled “Soy protein innovation drives new opportunity in plant-based foods”, the article highlights consumer preferences and ingredient advancements. A United Soybean Board survey in August 2023 found 64% of consumers prioritize taste in plant-based meat alternatives.

David Sabbagh of IFF emphasized that taste and texture remain non-negotiable for most consumers. IFF’s SUPRO® TEX 7110 was introduced as a soy-based ingredient mimicking whole-muscle meat textures. The report also underscored supply reliability from USA-grown soybeans, with Mac Marshall of the United Soybean Board citing rising global demand for their consistency and quality.

Soy-based meat alternatives hold varying shares across related parent industries. In the plant-based meat sector, soy accounts for around 45% of global consumption due to its established use and processing flexibility. Within the meat substitutes industry, its share is estimated at approximately 39%, supported by its availability and price advantage over newer ingredients.

In the soy-based food category, meat substitutes make up nearly 89% of the segment’s value, indicating concentrated demand in this application. In the broader edible plant protein market, soy remains one of the primary ingredients, though precise figures vary. Within the alternative protein landscape, which includes fermentation and cell-based sources, soy-based options contribute between 35% and 50% based on volume and commercialization levels.

Analyzing Soy-Based Meat Alternative Market by Top Investment Segments

The industry is segmented by product type into burgers, nuggets, sausages, and others. By source, it includes textured vegetable protein (TVP), soy protein isolate, soy flour, and other soy derivatives.

By application, the industry includes ready meals, frozen food products, snack formats, and foodservice applications. Regional analysis includes North America, Latin America, Western Europe, Eastern Europe, Balkans & Baltic, Russia & Belarus, Central Asia, East Asia, South Asia & Pacific, and Middle East & Africa.
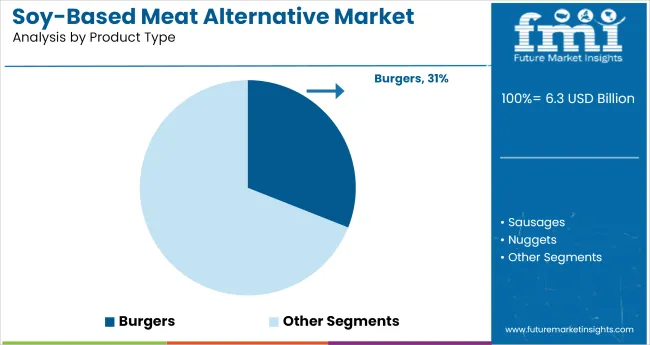
Burgers Lead Product Format Sales Across Channels

Soy Based Meat Alternative Market Analysis By Product Type

Soy-based burgers are forecast to hold 31% of the product type segment in 2025. Their format familiarity supports higher trial and repeat purchases, especially in North America and Europe. Brands such as Impossible Foods and Beyond Meat popularized the segment, but affordability and formulation stability have shifted attention to soy inputs.

Nestlé’s Garden Gourmet line in Europe and Gardein by Conagra in the USA now offer soy-based burger patties for both retail and foodservice. Asian players like OmniFoods and Zhenmeat have also launched soy-centric patties tailored to local palates.
  • Nestlé and Conagra utilize soy to reduce input volatility in frozen formats.
  • OmniFoods targets flexitarian consumers with soy-pork hybrids.
  • Lidl and Aldi drive volume with private-label soy burger ranges.

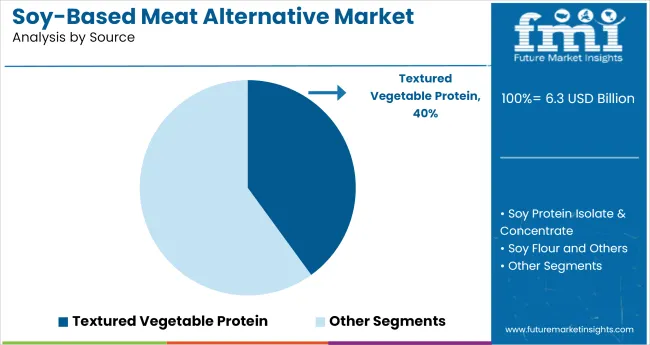
Textured Vegetable Protein (TVP) Emerges as Functional Input of Choice

Soy Based Meat Alternative Market Analysis By Source

TVP is expected to contribute 40% to the source segment in 2025. Its adaptability across mince, chunk, and strip forms makes it a manufacturing staple. Companies such as Archer Daniels Midland (ADM), CHS Inc., and Wilmar International have vertically integrated supply chains to ensure steady TVP availability.

ADM's ProFam line is widely used in institutional applications, while small-scale co-packers in Brazil and India use domestic soy to reduce costs. Thai Union has entered the space via foodservice partnerships focused on TVP meal kits.
  • ADM and CHS ensure scale-driven TVP supply with consistent functional specs.
  • India’s Ruchi Soya provides domestic TVP for APAC low-cost production.
  • Thai Union diversifies from seafood by offering soy TVP in its ready-meal division.

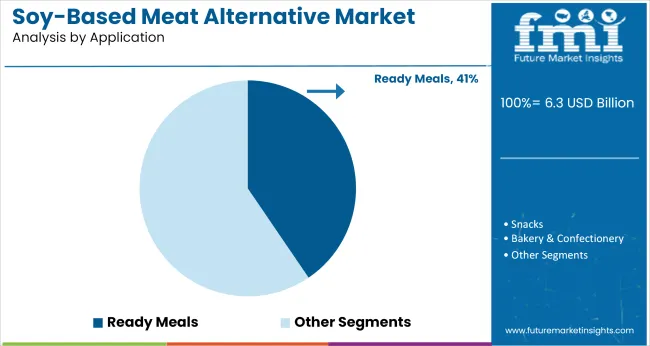
Ready Meals Secure Application Leadership Amid On-the-Go Demand

Soy Based Meat Alternative Market Analysis By Application

Ready meals are expected to account for 40.5% of application share in 2025. Soy’s texture retention and low rehydration cost make it a default base for ready-to-eat formats. Nestlé, through its Maggi and Lean Cuisine sub-brands, integrates soy meat into microwavable entrees.

Hain Celestial's Linda McCartney brand leads soy-based lasagna and bolognese offerings in the UK. CP Foods in Thailand and Bonduelle in France have adapted soy for Asian and European ready-meal kits. These companies focus on volume, packaging stability, and institutional alignment.

  • Nestlé’s Lean Cuisine range uses soy for protein-enhanced frozen meals.
  • Hain Celestial leverages soy’s versatility across vegetarian ready dishes.
  • Bonduelle and CP Foods expand soy meals into public procurement channels.

Top Soy-Based Meat Alternative Market Dynamics

The soy-based meat alternative industry is undergoing structural shifts, with manufacturers favoring vertically integrated soy processing and extrusion-based production to control input costs. Retailers are simplifying assortments under private labels, using bulk contracting to retain margins. Legacy soy-processing regions are driving capacity utilization for scalable, cost-efficient protein formats.

Protein-Rich Meat Alternative Gains Nutritional Validation

Clinical research and commercial trials have driven renewed momentum for soy-based meat analogues in industries. Nutrition-focused campaigns around plant protein completeness are prompting buyers to choose soy over newer, costlier ingredients. Specialty retail performance and consumer repurchase rates have improved steadily, as soy-based SKUs prove adaptable for both refrigerated and shelf-stable formats.

  • Repeat-purchase rates increased across soy strips, burger patties, and ready-to-cook nuggets.
  • Supermarkets expanded soy-based SKUs during major seasonal campaigns like Veganuary.
  • Co-packers and B2B brands adopted soy for gluten-free and high-protein ranges.

Margin Pressure from Commodity Volatility and Processing Costs

Soy-based meat alternative producers are confronting cost shocks across raw material procurement, energy-intensive extrusion, and import logistics. Free-on-board pricing for bulk soy flour has risen, while freight volatility, especially from Brazil and India, is prompting reconsideration of sourcing strategies. Smaller players have absorbed losses, while larger firms renegotiate contracts to retain margins.
  • Soy input costs increased as Brazil and India adjusted export flows.
  • Freight charges and energy tariffs impacted textured protein processors across ASEAN.
  • Price-sensitive brands shifted toward bulk formats and white-label outsourcing to lower risk.

Top Countries Innovating, Scaling, and Distributing Soy-Based Meat Alternatives

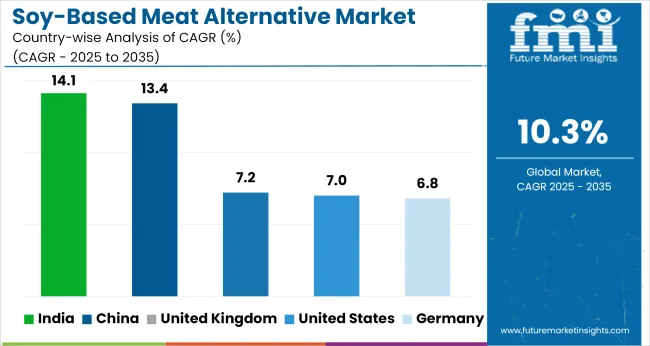
Soy Based Meat Alternative Market Cagr Analysis By Country

Countries CAGR (2025 to 2035)
India 14.1%
China 13.4%
United Kingdom 7.2%
United States 7.0%
Germany 6.8%

Global demand for soy-based meat alternatives is expected to grow at a 10.3% CAGR between 2025 and 2035. India leads the group at 14.1%, outperforming the global average by nearly four percentage points. Rising protein consumption, soy processing cluster expansion, and pricing parity with poultry in parts of western and southern regions are contributing to the surge.

China follows at 13.4%, where consumption is rising across institutional catering, retail chains, and ready-to-heat formats. BRICS economies are now outperforming legacy producers in both volume and growth.

The United States, United Kingdom, and Germany trail the global average. The USA CAGR of 7.0% reflects stagnation in frozen alt-meat categories and slowing repeat purchases due to ingredient scrutiny. The United Kingdom, at 7.2%, shows volume constraints in chilled and ambient channels, with fewer new SKUs launched in recent years. Germany posts 6.8%, slowed by private-label rationalization and increased preference for hybrid meat formats.

The report covers detailed analysis of 40+ countries and the top five countries have been shared as a reference.

Demand Forecast for Soy-Based Meat Alternatives Market in the United States

Sales of soy-based meat alternative in United States are growing at a CAGR of 7.0% from 2025 to 2035. This growth is driven by product reformulation and the rising number of flexitarian consumers who prefer plant-based substitutes. Companies such as Beyond Meat and Impossible Foods are revolutionizing the plant-based meat industry, while Whole Foods and Walmart have significantly increased their availability of soy-based alternatives.

The shift toward plant-based diets in the USA is further fueled by concerns over health risks associated with traditional meat consumption, including obesity and cardiovascular diseases. As the demand for healthier options increases, the industry for soy-based products is expanding, particularly in the form of soy burgers, sausages, and plant-based meatballs.

  • Increasing flexitarian diets leading to high demand for soy-based alternatives.
  • Growth driven by the shift towards healthier, plant-based protein options.
  • More availability of soy-based products in major retail outlets.

In-depth Analysis of Soy-Based Meat Alternatives Market in the United Kingdom

Demand for the soy-based meat alternative in the United Kingdom is expanding at a CAGR of 7.2% from 2025 to 2035. The rise in flexitarian diets is driving this growth, with an increasing number of UK consumers reducing their meat consumption due to health and environmental concerns.

Companies like Tesco and Sainsbury's have expanded their plant-based offerings, while brands such as Quorn and Alpro are leading the industry with soy-based alternatives. These alternatives are highly sought after by consumers looking for nutritious food options. Furthermore, the UK’s growing focus on clean-label products and organic food has been a significant driver in increasing consumer demand for soy-based products.

  • Increased adoption of plant-based diets driven by health concerns.
  • Higher demand for clean-label and organic soy-based products.
  • Flexitarian consumers pushing soy-based meat consumption in retail.

Demand Analysis for Soy-Based Meat Alternatives Market in China

The soy-based meat alternative market in China is set to grow at a robust CAGR of 13.4% from 2025 to 2035. The industry is driven by traditional soy consumption, including products like tofu and soy milk, alongside a growing interest in plant-based diets. Companies such as Hubei Jinqiao and VeganHut have emerged as strong players, offering soy-based meat alternatives tailored to local tastes.

As health awareness increases among consumers and government programs encourage dietary shifts, demand for soy-based alternatives continues to accelerate. International brands like Beyond Meat have entered the industry, contributing to greater awareness and adoption of plant-based products.

  • Traditional soy consumption supports the expansion of plant-based meat alternatives.
  • Urban health-conscious consumers are driving the adoption of plant-based diets.
  • Government programs encouraging dietary changes are driving demand for soy-based formats.

Growth Forecast for Soy-Based Meat Alternatives Market in India

Sales for soy-based meat alternative in India are forecasted to grow at an exceptional CAGR of 14.1% from 2025 to 2035. The demand is rising due to increased awareness of health and dietary preferences. India has a large vegetarian population, with soy-based products such as soy kebabs and soy milk being staple foods.

Local brands like GoodDot and Veggie Champ are gaining traction, providing soy-based meat alternatives that cater to the Indian palate. Moreover, urban growth and a rise in disposable incomes are enabling broader access to plant-based products in cities. The demand is further supported by India’s growing interest in reducing meat consumption due to concerns over health and environmental impacts.

  • Accelerated demand driven by health-conscious eating habits.
  • Soy-based products catering to India’s large vegetarian population.
  • Rising disposable incomes and urbanization boosting plant-based food adoption.

Growth Outlook for Soy-Based Meat Alternatives Market in Germany

Demand for soy-based meat alternative in Germany is projected to expand at a CAGR of 6.8% from 2025 to 2035. Germany has long been a leader in plant-based food consumption, with an increasing number of consumers seeking clean-label and organic options. Companies like Taifun and Veganz are capitalizing on the market by providing high-quality, organic soy-based meat alternatives.

Germany’s strong food culture and emphasis on health are key drivers of this demand. Consumers are more conscious of their environmental footprint, and many prefer soy-based alternatives to meat due to their perceived health benefits and reduced environmental impact. This shift is supported by Germany’s stringent food labeling laws, which emphasize transparency and ethical sourcing.

  • High demand for organic and clean-label soy-based products.
  • Regulatory environment supporting ethical sourcing and transparency.
  • Consumers are increasingly prioritizing health in their food selections

Leading Companies in Soy-based Meat Alternative Market

Leading Company - Beyond Meat Industry Share - 15%
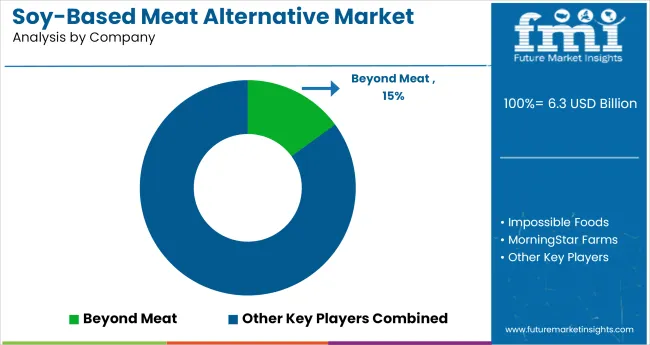
Soy Based Meat Alternative Market Analysis By Company

In the soy-based meat alternative market, companies are expanding through ingredient innovation, retail penetration, and hybrid protein formats. Beyond Meat, Impossible Foods, and MorningStar Farms dominate with soy-based burgers and crumbles across major supermarkets and foodservice chains.

European players like Quorn, The Vegetarian Butcher, and VBites focus on soy-enhanced deli lines, appealing to ethical and flexitarian consumers. Amy’s Kitchen and Tofurky cater to frozen aisle buyers in North America. Emerging brands such as Prime Roots, Redefine Meat, and Sunfed are innovating with soy fermentation and 3D-printed textures.

Maple Leaf Foods and Unilever use regional sourcing to optimize cost. Competitive advantage now depends on clean-label soy sourcing, co-manufacturing partnerships, and culinary adaptability across retail, QSRs, and prepared food channels.

Recent Soy-based Meat Alternative Industry News

  • May 2025, Impossible Foods announced plans to launch its soy-based burgers across Europe, contingent on regulatory clearance for its soy leghemoglobin ingredient. The move marks a strategic expansion of its retail and foodservice presence beyond North America, targeting new markets with its core product portfolio.
  • May 12, 2025, Bunge introduced a new line of soy protein concentrates at IFFA, aimed at improving formulation performance in plant-based foods. The products, to be manufactured at its Morristown, Indiana facility, feature 70% protein and 17% fiber content, and will be available in both conventional and non-GMO formats to support affordability and scalability in the plant-protein segment.

Research Coverage and Scope Summary

Report Attributes Details
Industry Size (2025) USD 6.3 billion
Projected Industry Size (2035) USD 16.8 billion
CAGR (2025 to 2035) 10.3%
Base Year for Estimation 2024
Historical Period 2020 to 2024
Projections Period 2025 to 2035
Quantitative Units USD billion for value and million metric tons for volume
Product Types Analyzed (Segment 1) Burgers, Sausages, Nuggets, Meatballs, Deli Slices, Crumbles
Sources Analyzed (Segment 2) Textured Vegetable Protein, Soy Protein Isolate & Concentrate, Soy Flour and Others
Applications Analyzed (Segment 3) Ready Meals, Snacks, Bakery & Confectionery, Others
Regions Covered North America, Latin America, Western Europe, Eastern Europe, East Asia, South Asia & Pacific, Others
Countries Covered United States, Canada, Germany, United Kingdom, France, Italy, Spain, China, India, Japan, South Korea, Australia, Brazil, Mexico, Argentina, Saudi Arabia, UAE, South Africa
Key Players Beyond Meat, Impossible Foods, MorningStar Farms, Quorn Foods, The Vegetarian Butcher, VBites Foods Ltd, Amy’s Kitchen, Tofurky (Conagra Brands), Prime Roots, Redefine Meat Ltd, Sunfed, Maple Leaf Foods, Unilever
Additional Attributes Dollar sales, share by product and distribution channel, growth in ready-meal and QSR demand, rising use of textured vegetable protein in large-scale production, soy reformulations for sodium reduction, regional sourcing shifts for soy protein

Leading Companies in the Soy-Based Meat Alternative Market

  • Beyond Meat
  • Impossible Foods
  • MorningStar Farms
  • Quorn Foods
  • The Vegetarian Butcher
  • VBites Foods Ltd
  • Amy’s Kitchen
  • Tofurky (Conagra Brands)
  • Prime Roots
  • Redefine Meat Ltd
  • Sunfed
  • Maple Leaf Foods
  • Unilever

Key Segments

By Product Type:

The indusrtry includes burgers, sausages, nuggets, meatballs, deli slices, and crumbles.

By Source:

The segmentation is into textured vegetable protein, soy protein isolate & concentrate and Soy Flour and Others.

By Application:

The segments include ready meals, snacks, bakery & confectionery, and others.

By Region:

The industry is segmented as North America, Latin America, Western Europe, Eastern Europe, East Asia, South Asia & Pacific and Others.

Table of Content

  1. Executive Summary
    • Global Market Outlook
    • Demand-side Trends
    • Supply-side Trends
    • Technology Roadmap Analysis
    • Analysis and Recommendations
  2. Market Overview
    • Market Coverage / Taxonomy
    • Market Definition / Scope / Limitations
  3. Market Background
    • Market Dynamics
      • Drivers
      • Restraints
      • Opportunity
      • Trends
    • Scenario Forecast
      • Demand in Optimistic Scenario
      • Demand in Likely Scenario
      • Demand in Conservative Scenario
    • Opportunity Map Analysis
    • Product Life Cycle Analysis
    • Supply Chain Analysis
      • Supply Side Participants and their Roles
        • Producers
        • Mid-Level Participants (Traders/ Agents/ Brokers)
        • Wholesalers and Distributors
      • Value Added and Value Created at Node in the Supply Chain
      • List of Raw Material Suppliers
      • List of Existing and Potential Buyer’s
    • Investment Feasibility Matrix
    • Value Chain Analysis
      • Profit Margin Analysis
      • Wholesalers and Distributors
      • Retailers
    • PESTLE and Porter’s Analysis
    • Regulatory Landscape
      • By Key Regions
      • By Key Countries
    • Regional Parent Market Outlook
    • Production and Consumption Statistics
    • Import and Export Statistics
  4. Global Market Analysis 2020 to 2024 and Forecast, 2025 to 2035
    • Historical Market Size Value (USD Billion) & Volume (Mn MT) Analysis, 2020 to 2024
    • Current and Future Market Size Value (USD Billion) & Volume (Mn MT) Projections, 2025 to 2035
      • Y-o-Y Growth Trend Analysis
      • Absolute $ Opportunity Analysis
  5. Global Market Pricing Analysis 2020 to 2024 and Forecast 2025 to 2035
  6. Global Market Analysis 2020 to 2024 and Forecast 2025 to 2035, By Product Type
    • Introduction / Key Findings
    • Historical Market Size Value (USD Billion) & Volume (Mn MT) Analysis by Product Type, 2020 to 2024
    • Current and Future Market Size Value (USD Billion) & Volume (Mn MT) Analysis and Forecast by Product Type, 2025 to 2035
      • Burgers
      • Sausages
      • Nuggets
      • Meatballs
      • Deli Slices
      • Crumbles
    • Y-o-Y Growth Trend Analysis By Product Type, 2020 to 2024
    • Absolute $ Opportunity Analysis By Product Type, 2025 to 2035
  7. Global Market Analysis 2020 to 2024 and Forecast 2025 to 2035, By Source
    • Introduction / Key Findings
    • Historical Market Size Value (USD Billion) & Volume (Mn MT) Analysis By Source, 2020 to 2024
    • Current and Future Market Size Value (USD Billion) & Volume (Mn MT) Analysis and Forecast By Source, 2025 to 2035
      • Textured Vegetable Protein
      • Soy Protein Isolate & Concentrate
    • Y-o-Y Growth Trend Analysis By Source, 2020 to 2024
    • Absolute $ Opportunity Analysis By Source, 2025 to 2035
  8. Global Market Analysis 2020 to 2024 and Forecast 2025 to 2035, By Application
    • Introduction / Key Findings
    • Historical Market Size Value (USD Billion) & Volume (Mn MT) Analysis By Application, 2020 to 2024
    • Current and Future Market Size Value (USD Billion) & Volume (Mn MT) Analysis and Forecast By Application, 2025 to 2035
      • Ready Meals
      • Snacks
      • Bakery & Confectionery
      • Others
    • Y-o-Y Growth Trend Analysis By Application, 2020 to 2024
    • Absolute $ Opportunity Analysis By Application, 2025 to 2035
  9. Global Market Analysis 2020 to 2024 and Forecast 2025 to 2035, By Region
    • Introduction
    • Historical Market Size Value (USD Billion) & Volume (Mn MT) Analysis By Region, 2020 to 2024
    • Current Market Size Value (USD Billion) & Volume (Mn MT) Analysis and Forecast By Region, 2025 to 2035
      • North America
      • Latin America
      • Western Europe
      • Eastern Europe
      • East Asia
      • South Asia & Pacific
      • Middle East and Africa
    • Market Attractiveness Analysis By Region
  10. North America Market Analysis 2020 to 2024 and Forecast 2025 to 2035, By Country
    • Historical Market Size Value (USD Billion) & Volume (Mn MT) Trend Analysis By Market Taxonomy, 2020 to 2024
    • Market Size Value (USD Billion) & Volume (Mn MT) Forecast By Market Taxonomy, 2025 to 2035
      • By Country
        • USA
        • Canada
        • Mexico
      • By Product Type
      • By Source
      • By Application
    • Market Attractiveness Analysis
      • By Country
      • By Product Type
      • By Source
      • By Application
    • Key Takeaways
  11. Latin America Market Analysis 2020 to 2024 and Forecast 2025 to 2035, By Country
    • Historical Market Size Value (USD Billion) & Volume (Mn MT) Trend Analysis By Market Taxonomy, 2020 to 2024
    • Market Size Value (USD Billion) & Volume (Mn MT) Forecast By Market Taxonomy, 2025 to 2035
      • By Country
        • Brazil
        • Argentina
        • Rest of LATAM
      • By Product Type
      • By Source
      • By Application
    • Market Attractiveness Analysis
      • By Country
      • By Product Type
      • By Source
      • By Application
    • Key Takeaways
  12. Western Europe Market Analysis 2020 to 2024 and Forecast 2025 to 2035, By Country
    • Historical Market Size Value (USD Billion) & Volume (Mn MT) Trend Analysis By Market Taxonomy, 2020 to 2024
    • Market Size Value (USD Billion) & Volume (Mn MT) Forecast By Market Taxonomy, 2025 to 2035
      • By Country
        • Germany
        • Italy
        • France
        • UK
        • Spain
        • BENELUX
        • Nordic
        • Rest of W.Europe
      • By Product Type
      • By Source
      • By Application
    • Market Attractiveness Analysis
      • By Country
      • By Product Type
      • By Source
      • By Application
    • Key Takeaways
  13. Eastern Europe Market Analysis 2020 to 2024 and Forecast 2025 to 2035, By Country
    • Historical Market Size Value (USD Billion) & Volume (Mn MT) Trend Analysis By Market Taxonomy, 2020 to 2024
    • Market Size Value (USD Billion) & Volume (Mn MT) Forecast By Market Taxonomy, 2025 to 2035
      • By Country
        • Russia
        • Hungary
        • Poland
        • Balkan & Baltics
        • Rest of E. Europe
      • By Product Type
      • By Source
      • By Application
    • Market Attractiveness Analysis
      • By Country
      • By Product Type
      • By Source
      • By Application
    • Key Takeaways
  14. East Asia Market Analysis 2020 to 2024 and Forecast 2025 to 2035, By Country
    • Historical Market Size Value (USD Billion) & Volume (Mn MT) Trend Analysis By Market Taxonomy, 2020 to 2024
    • Market Size Value (USD Billion) & Volume (Mn MT) Forecast By Market Taxonomy, 2025 to 2035
      • By Country
        • China
        • Japan
        • South Korea
      • By Product Type
      • By Source
      • By Application
    • Market Attractiveness Analysis
      • By Country
      • By Product Type
      • By Source
      • By Application
    • Key Takeaways
  15. South Asia & Pacific Market Analysis 2020 to 2024 and Forecast 2025 to 2035, By Country
    • Historical Market Size Value (USD Billion) & Volume (Mn MT) Trend Analysis By Market Taxonomy, 2020 to 2024
    • Market Size Value (USD Billion) & Volume (Mn MT) Forecast By Market Taxonomy, 2025 to 2035
      • By Country
        • India
        • Australia & New Zealand
        • ASEAN
        • Rest of SAP
      • By Product Type
      • By Source
      • By Application
    • Market Attractiveness Analysis
      • By Country
      • By Product Type
      • By Source
      • By Application
    • Key Takeaways
  16. Middle East and Africa Market Analysis 2020 to 2024 and Forecast 2025 to 2035, By Country
    • Historical Market Size Value (USD Billion) & Volume (Mn MT) Trend Analysis By Market Taxonomy, 2020 to 2024
    • Market Size Value (USD Billion) & Volume (Mn MT) Forecast By Market Taxonomy, 2025 to 2035
      • By Country
        • GCC Countries
        • Northern Africa
        • South Africa
        • Turkiye
        • Rest of MEA
      • By Product Type
      • By Source
      • By Application
    • Market Attractiveness Analysis
      • By Country
      • By Product Type
      • By Source
      • By Application
    • Key Takeaways
  17. Key Countries Market Analysis
    • USA
      • Pricing Analysis
      • Market Share Analysis, 2024
        • By Product Type
        • By Source
        • By Application
    • Canada
      • Pricing Analysis
      • Market Share Analysis, 2024
        • By Product Type
        • By Source
        • By Application
    • Brazil
      • Pricing Analysis
      • Market Share Analysis, 2024
        • By Product Type
        • By Source
        • By Application
    • Mexico
      • Pricing Analysis
      • Market Share Analysis, 2024
        • By Product Type
        • By Source
        • By Application
    • Argentina
      • Pricing Analysis
      • Market Share Analysis, 2024
        • By Product Type
        • By Source
        • By Application
  18. Market Structure Analysis
    • Competition Dashboard
    • Competition Benchmarking
    • Market Share Analysis of Top Players
      • By Regional
      • By Product Type
      • By Source
      • By Application
  19. Competition Analysis
    • Competition Deep Dive
      • Beyond Meat
        • Overview
        • Product Portfolio
        • Profitability by Market Segments (Product/Age /Sales Channel/Region)
        • Sales Footprint
        • Strategy Overview
          • Marketing Strategy
          • Product Strategy
          • Channel Strategy
      • Impossible Foods
        • Overview
        • Product Portfolio
        • Profitability by Market Segments (Product/Age /Sales Channel/Region)
        • Sales Footprint
        • Strategy Overview
          • Marketing Strategy
          • Product Strategy
          • Channel Strategy
      • MorningStar Farms
        • Overview
        • Product Portfolio
        • Profitability by Market Segments (Product/Age /Sales Channel/Region)
        • Sales Footprint
        • Strategy Overview
          • Marketing Strategy
          • Product Strategy
          • Channel Strategy
      • Quorn Foods
        • Overview
        • Product Portfolio
        • Profitability by Market Segments (Product/Age /Sales Channel/Region)
        • Sales Footprint
        • Strategy Overview
          • Marketing Strategy
          • Product Strategy
          • Channel Strategy
      • The Vegetarian Butcher
        • Overview
        • Product Portfolio
        • Profitability by Market Segments (Product/Age /Sales Channel/Region)
        • Sales Footprint
        • Strategy Overview
          • Marketing Strategy
          • Product Strategy
          • Channel Strategy
      • VBites Foods Ltd
        • Overview
        • Product Portfolio
        • Profitability by Market Segments (Product/Age /Sales Channel/Region)
        • Sales Footprint
        • Strategy Overview
          • Marketing Strategy
          • Product Strategy
          • Channel Strategy
      • Amy’s Kitchen
        • Overview
        • Product Portfolio
        • Profitability by Market Segments (Product/Age /Sales Channel/Region)
        • Sales Footprint
        • Strategy Overview
          • Marketing Strategy
          • Product Strategy
          • Channel Strategy
      • Tofurky (Conagra Brands)
        • Overview
        • Product Portfolio
        • Profitability by Market Segments (Product/Age /Sales Channel/Region)
        • Sales Footprint
        • Strategy Overview
          • Marketing Strategy
          • Product Strategy
          • Channel Strategy
      • Prime Roots
        • Overview
        • Product Portfolio
        • Profitability by Market Segments (Product/Age /Sales Channel/Region)
        • Sales Footprint
        • Strategy Overview
          • Marketing Strategy
          • Product Strategy
          • Channel Strategy
      • Redefine Meat Ltd
        • Overview
        • Product Portfolio
        • Profitability by Market Segments (Product/Age /Sales Channel/Region)
        • Sales Footprint
        • Strategy Overview
          • Marketing Strategy
          • Product Strategy
          • Channel Strategy
      • Sunfed
        • Overview
        • Product Portfolio
        • Profitability by Market Segments (Product/Age /Sales Channel/Region)
        • Sales Footprint
        • Strategy Overview
          • Marketing Strategy
          • Product Strategy
          • Channel Strategy
      • Maple Leaf Foods
        • Overview
        • Product Portfolio
        • Profitability by Market Segments (Product/Age /Sales Channel/Region)
        • Sales Footprint
        • Strategy Overview
          • Marketing Strategy
          • Product Strategy
          • Channel Strategy
      • Unilever
        • Overview
        • Product Portfolio
        • Profitability by Market Segments (Product/Age /Sales Channel/Region)
        • Sales Footprint
        • Strategy Overview
          • Marketing Strategy
          • Product Strategy
          • Channel Strategy
  20. Assumptions & Acronyms Used
  21. Research Methodology

List of Tables

  • Table 1: Global Market Value (USD Billion) Forecast by Region, 2020 to 2035
  • Table 2: Global Market Volume (Mn MT) Forecast by Region, 2020 to 2035
  • Table 3: Global Market Value (USD Billion) Forecast by Product Type, 2020 to 2035
  • Table 4: Global Market Volume (Mn MT) Forecast by Product Type, 2020 to 2035
  • Table 5: Global Market Value (USD Billion) Forecast by Source, 2020 to 2035
  • Table 6: Global Market Volume (Mn MT) Forecast by Source, 2020 to 2035
  • Table 7: Global Market Value (USD Billion) Forecast by Application, 2020 to 2035
  • Table 8: Global Market Volume (Mn MT) Forecast by Application, 2020 to 2035
  • Table 9: North America Market Value (USD Billion) Forecast by Country, 2020 to 2035
  • Table 10: North America Market Volume (Mn MT) Forecast by Country, 2020 to 2035
  • Table 11: North America Market Value (USD Billion) Forecast by Product Type, 2020 to 2035
  • Table 12: North America Market Volume (Mn MT) Forecast by Product Type, 2020 to 2035
  • Table 13: North America Market Value (USD Billion) Forecast by Source, 2020 to 2035
  • Table 14: North America Market Volume (Mn MT) Forecast by Source, 2020 to 2035
  • Table 15: North America Market Value (USD Billion) Forecast by Application, 2020 to 2035
  • Table 16: North America Market Volume (Mn MT) Forecast by Application, 2020 to 2035
  • Table 17: Latin America Market Value (USD Billion) Forecast by Country, 2020 to 2035
  • Table 18: Latin America Market Volume (Mn MT) Forecast by Country, 2020 to 2035
  • Table 19: Latin America Market Value (USD Billion) Forecast by Product Type, 2020 to 2035
  • Table 20: Latin America Market Volume (Mn MT) Forecast by Product Type, 2020 to 2035
  • Table 21: Latin America Market Value (USD Billion) Forecast by Source, 2020 to 2035
  • Table 22: Latin America Market Volume (Mn MT) Forecast by Source, 2020 to 2035
  • Table 23: Latin America Market Value (USD Billion) Forecast by Application, 2020 to 2035
  • Table 24: Latin America Market Volume (Mn MT) Forecast by Application, 2020 to 2035
  • Table 25: Western Europe Market Value (USD Billion) Forecast by Country, 2020 to 2035
  • Table 26: Western Europe Market Volume (Mn MT) Forecast by Country, 2020 to 2035
  • Table 27: Western Europe Market Value (USD Billion) Forecast by Product Type, 2020 to 2035
  • Table 28: Western Europe Market Volume (Mn MT) Forecast by Product Type, 2020 to 2035
  • Table 29: Western Europe Market Value (USD Billion) Forecast by Source, 2020 to 2035
  • Table 30: Western Europe Market Volume (Mn MT) Forecast by Source, 2020 to 2035
  • Table 31: Western Europe Market Value (USD Billion) Forecast by Application, 2020 to 2035
  • Table 32: Western Europe Market Volume (Mn MT) Forecast by Application, 2020 to 2035
  • Table 33: Eastern Europe Market Value (USD Billion) Forecast by Country, 2020 to 2035
  • Table 34: Eastern Europe Market Volume (Mn MT) Forecast by Country, 2020 to 2035
  • Table 35: Eastern Europe Market Value (USD Billion) Forecast by Product Type, 2020 to 2035
  • Table 36: Eastern Europe Market Volume (Mn MT) Forecast by Product Type, 2020 to 2035
  • Table 37: Eastern Europe Market Value (USD Billion) Forecast by Source, 2020 to 2035
  • Table 38: Eastern Europe Market Volume (Mn MT) Forecast by Source, 2020 to 2035
  • Table 39: Eastern Europe Market Value (USD Billion) Forecast by Application, 2020 to 2035
  • Table 40: Eastern Europe Market Volume (Mn MT) Forecast by Application, 2020 to 2035
  • Table 41: East Asia Market Value (USD Billion) Forecast by Country, 2020 to 2035
  • Table 42: East Asia Market Volume (Mn MT) Forecast by Country, 2020 to 2035
  • Table 43: East Asia Market Value (USD Billion) Forecast by Product Type, 2020 to 2035
  • Table 44: East Asia Market Volume (Mn MT) Forecast by Product Type, 2020 to 2035
  • Table 45: East Asia Market Value (USD Billion) Forecast by Source, 2020 to 2035
  • Table 46: East Asia Market Volume (Mn MT) Forecast by Source, 2020 to 2035
  • Table 47: East Asia Market Value (USD Billion) Forecast by Application, 2020 to 2035
  • Table 48: East Asia Market Volume (Mn MT) Forecast by Application, 2020 to 2035
  • Table 49: South Asia & Pacific Market Value (USD Billion) Forecast by Country, 2020 to 2035
  • Table 50: South Asia & Pacific Market Volume (Mn MT) Forecast by Country, 2020 to 2035
  • Table 51: South Asia & Pacific Market Value (USD Billion) Forecast by Product Type, 2020 to 2035
  • Table 52: South Asia & Pacific Market Volume (Mn MT) Forecast by Product Type, 2020 to 2035
  • Table 53: South Asia & Pacific Market Value (USD Billion) Forecast by Source, 2020 to 2035
  • Table 54: South Asia & Pacific Market Volume (Mn MT) Forecast by Source, 2020 to 2035
  • Table 55: South Asia & Pacific Market Value (USD Billion) Forecast by Application, 2020 to 2035
  • Table 56: South Asia & Pacific Market Volume (Mn MT) Forecast by Application, 2020 to 2035
  • Table 57: Middle East and Africa Market Value (USD Billion) Forecast by Country, 2020 to 2035
  • Table 58: Middle East and Africa Market Volume (Mn MT) Forecast by Country, 2020 to 2035
  • Table 59: Middle East and Africa Market Value (USD Billion) Forecast by Product Type, 2020 to 2035
  • Table 60: Middle East and Africa Market Volume (Mn MT) Forecast by Product Type, 2020 to 2035
  • Table 61: Middle East and Africa Market Value (USD Billion) Forecast by Source, 2020 to 2035
  • Table 62: Middle East and Africa Market Volume (Mn MT) Forecast by Source, 2020 to 2035
  • Table 63: Middle East and Africa Market Value (USD Billion) Forecast by Application, 2020 to 2035
  • Table 64: Middle East and Africa Market Volume (Mn MT) Forecast by Application, 2020 to 2035

List of Figures

  • Figure 1: Global Market Volume (Mn MT) Forecast 2020 to 2035
  • Figure 2: Global Market Pricing Analysis
  • Figure 3: Global Market Value (USD Billion) Forecast 2020 to 2035
  • Figure 4: Global Market Value Share and BPS Analysis by Product Type, 2025 and 2035
  • Figure 5: Global Market Y-o-Y Growth Comparison by Product Type, 2025 to 2035
  • Figure 6: Global Market Attractiveness Analysis by Product Type
  • Figure 7: Global Market Value Share and BPS Analysis by Source, 2025 and 2035
  • Figure 8: Global Market Y-o-Y Growth Comparison by Source, 2025 to 2035
  • Figure 9: Global Market Attractiveness Analysis by Source
  • Figure 10: Global Market Value Share and BPS Analysis by Application, 2025 and 2035
  • Figure 11: Global Market Y-o-Y Growth Comparison by Application, 2025 to 2035
  • Figure 12: Global Market Attractiveness Analysis by Application
  • Figure 13: Global Market Value (USD Billion) Share and BPS Analysis by Region, 2025 and 2035
  • Figure 14: Global Market Y-o-Y Growth Comparison by Region, 2025 to 2035
  • Figure 15: Global Market Attractiveness Analysis by Region
  • Figure 16: North America Market Incremental $ Opportunity, 2025 to 2035
  • Figure 17: Latin America Market Incremental $ Opportunity, 2025 to 2035
  • Figure 18: Western Europe Market Incremental $ Opportunity, 2025 to 2035
  • Figure 19: Eastern Europe Market Incremental $ Opportunity, 2025 to 2035
  • Figure 20: East Asia Market Incremental $ Opportunity, 2025 to 2035
  • Figure 21: South Asia & Pacific Market Incremental $ Opportunity, 2025 to 2035
  • Figure 22: Middle East and Africa Market Incremental $ Opportunity, 2025 to 2035
  • Figure 23: North America Market Value Share and BPS Analysis by Country, 2025 and 2035
  • Figure 24: North America Market Value Share and BPS Analysis by Product Type, 2025 and 2035
  • Figure 25: North America Market Y-o-Y Growth Comparison by Product Type, 2025 to 2035
  • Figure 26: North America Market Attractiveness Analysis by Product Type
  • Figure 27: North America Market Value Share and BPS Analysis by Source, 2025 and 2035
  • Figure 28: North America Market Y-o-Y Growth Comparison by Source, 2025 to 2035
  • Figure 29: North America Market Attractiveness Analysis by Source
  • Figure 30: North America Market Value Share and BPS Analysis by Application, 2025 and 2035
  • Figure 31: North America Market Y-o-Y Growth Comparison by Application, 2025 to 2035
  • Figure 32: North America Market Attractiveness Analysis by Application
  • Figure 33: Latin America Market Value Share and BPS Analysis by Country, 2025 and 2035
  • Figure 34: Latin America Market Value Share and BPS Analysis by Product Type, 2025 and 2035
  • Figure 35: Latin America Market Y-o-Y Growth Comparison by Product Type, 2025 to 2035
  • Figure 36: Latin America Market Attractiveness Analysis by Product Type
  • Figure 37: Latin America Market Value Share and BPS Analysis by Source, 2025 and 2035
  • Figure 38: Latin America Market Y-o-Y Growth Comparison by Source, 2025 to 2035
  • Figure 39: Latin America Market Attractiveness Analysis by Source
  • Figure 40: Latin America Market Value Share and BPS Analysis by Application, 2025 and 2035
  • Figure 41: Latin America Market Y-o-Y Growth Comparison by Application, 2025 to 2035
  • Figure 42: Latin America Market Attractiveness Analysis by Application
  • Figure 43: Western Europe Market Value Share and BPS Analysis by Country, 2025 and 2035
  • Figure 44: Western Europe Market Value Share and BPS Analysis by Product Type, 2025 and 2035
  • Figure 45: Western Europe Market Y-o-Y Growth Comparison by Product Type, 2025 to 2035
  • Figure 46: Western Europe Market Attractiveness Analysis by Product Type
  • Figure 47: Western Europe Market Value Share and BPS Analysis by Source, 2025 and 2035
  • Figure 48: Western Europe Market Y-o-Y Growth Comparison by Source, 2025 to 2035
  • Figure 49: Western Europe Market Attractiveness Analysis by Source
  • Figure 50: Western Europe Market Value Share and BPS Analysis by Application, 2025 and 2035
  • Figure 51: Western Europe Market Y-o-Y Growth Comparison by Application, 2025 to 2035
  • Figure 52: Western Europe Market Attractiveness Analysis by Application
  • Figure 53: Eastern Europe Market Value Share and BPS Analysis by Country, 2025 and 2035
  • Figure 54: Eastern Europe Market Value Share and BPS Analysis by Product Type, 2025 and 2035
  • Figure 55: Eastern Europe Market Y-o-Y Growth Comparison by Product Type, 2025 to 2035
  • Figure 56: Eastern Europe Market Attractiveness Analysis by Product Type
  • Figure 57: Eastern Europe Market Value Share and BPS Analysis by Source, 2025 and 2035
  • Figure 58: Eastern Europe Market Y-o-Y Growth Comparison by Source, 2025 to 2035
  • Figure 59: Eastern Europe Market Attractiveness Analysis by Source
  • Figure 60: Eastern Europe Market Value Share and BPS Analysis by Application, 2025 and 2035
  • Figure 61: Eastern Europe Market Y-o-Y Growth Comparison by Application, 2025 to 2035
  • Figure 62: Eastern Europe Market Attractiveness Analysis by Application
  • Figure 63: East Asia Market Value Share and BPS Analysis by Country, 2025 and 2035
  • Figure 64: East Asia Market Value Share and BPS Analysis by Product Type, 2025 and 2035
  • Figure 65: East Asia Market Y-o-Y Growth Comparison by Product Type, 2025 to 2035
  • Figure 66: East Asia Market Attractiveness Analysis by Product Type
  • Figure 67: East Asia Market Value Share and BPS Analysis by Source, 2025 and 2035
  • Figure 68: East Asia Market Y-o-Y Growth Comparison by Source, 2025 to 2035
  • Figure 69: East Asia Market Attractiveness Analysis by Source
  • Figure 70: East Asia Market Value Share and BPS Analysis by Application, 2025 and 2035
  • Figure 71: East Asia Market Y-o-Y Growth Comparison by Application, 2025 to 2035
  • Figure 72: East Asia Market Attractiveness Analysis by Application
  • Figure 73: South Asia & Pacific Market Value Share and BPS Analysis by Country, 2025 and 2035
  • Figure 74: South Asia & Pacific Market Value Share and BPS Analysis by Product Type, 2025 and 2035
  • Figure 75: South Asia & Pacific Market Y-o-Y Growth Comparison by Product Type, 2025 to 2035
  • Figure 76: South Asia & Pacific Market Attractiveness Analysis by Product Type
  • Figure 77: South Asia & Pacific Market Value Share and BPS Analysis by Source, 2025 and 2035
  • Figure 78: South Asia & Pacific Market Y-o-Y Growth Comparison by Source, 2025 to 2035
  • Figure 79: South Asia & Pacific Market Attractiveness Analysis by Source
  • Figure 80: South Asia & Pacific Market Value Share and BPS Analysis by Application, 2025 and 2035
  • Figure 81: South Asia & Pacific Market Y-o-Y Growth Comparison by Application, 2025 to 2035
  • Figure 82: South Asia & Pacific Market Attractiveness Analysis by Application
  • Figure 83: Middle East and Africa Market Value Share and BPS Analysis by Country, 2025 and 2035
  • Figure 84: Middle East and Africa Market Value Share and BPS Analysis by Product Type, 2025 and 2035
  • Figure 85: Middle East and Africa Market Y-o-Y Growth Comparison by Product Type, 2025 to 2035
  • Figure 86: Middle East and Africa Market Attractiveness Analysis by Product Type
  • Figure 87: Middle East and Africa Market Value Share and BPS Analysis by Source, 2025 and 2035
  • Figure 88: Middle East and Africa Market Y-o-Y Growth Comparison by Source, 2025 to 2035
  • Figure 89: Middle East and Africa Market Attractiveness Analysis by Source
  • Figure 90: Middle East and Africa Market Value Share and BPS Analysis by Application, 2025 and 2035
  • Figure 91: Middle East and Africa Market Y-o-Y Growth Comparison by Application, 2025 to 2035
  • Figure 92: Middle East and Africa Market Attractiveness Analysis by Application
  • Figure 93: Global Market - Tier Structure Analysis
  • Figure 94: Global Market - Company Share Analysis

Frequently Asked Questions

What is the projected industry size of the soy-based meat alternative market by 2035?

The industry is projected to reach USD 16.8 billion by 2035.

What is the expected CAGR of the soy-based meat alternative market from 2025 to 2035?

The industry is expected to grow at a CAGR of 10.3% from 2025 to 2035.

Which segment is expected to lead the soy-based meat alternative market in 2025?

Burgers are expected to dominate with a 31.0% share in 2025.

What is the industry size of the soy-based meat alternative market in 2025?

The industry is estimated to reach USD 6.3 billion in 2025.

Which region is expected to witness the highest growth in the soy-based meat alternative market?

South Asia, led by India, is expected to be the key growth region with a projected CAGR of 14.1%.

Explore Similar Insights

Future Market Insights

Soy-Based Meat Alternative Market