Reports

- Global Locations -

Headquarters

Future Market Insights, Inc.

Christiana Corporate, 200
Continental Drive, Suite 401,
Newark, Delaware - 19713,
United States

T: +1-845-579-5705

Americas

Future Market Insights, Inc.

616 Corporate Way, Suite 2-9018,
Valley Cottage, NY 10989, United States

T: +1-347-918-3531

MEA

Future Market Insights

1602-6 Jumeirah Bay X2 Tower, Plot No: JLT-PH2-X2A,
Jumeirah Lakes Towers, Dubai,
United Arab Emirates

Europe

Future Market Insights

3rd Floor, 207 Regent Street,
W1B 3HH London
United Kingdom

T: + 44 (0) 20 8123 9659
D: +44 (0) 20 3287 4268

Asia Pacific

Future Market Insights

IndiaLand Global Tech Park, Unit UG-1, Behind Grand HighStreet, Phase 1, Hinjawadi, MH, Pune – 411057, India

A Summary of the Meat Dicing Machine Market (2023 to 2033)

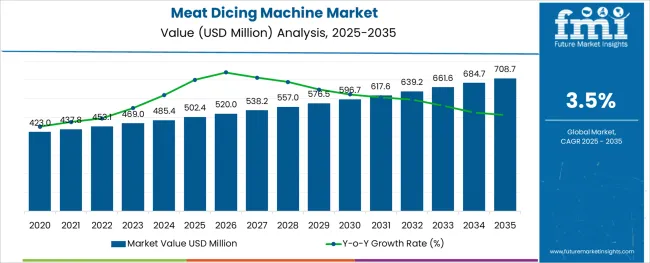
The global meat dicing machine market is projected to have a moderate-paced CAGR of 3.5% during the forecast period. The current valuation of the market is US$ 469 million in 2023. The market value of the meat dicing machine market is anticipated to reach a high of US$ 660 million by the year 2033. A historical market valuation of US$ 456 million has been recorded by the experts of Future Market Insights for the concerned market during the base year. This growth is supported by the following:

  • Safety regulations for sophisticated equipment to slice and dice meat, coupled with the high demand for processed meat, are expected to drive the growth of the meat dicing machine market.
  • Meat dicing machine makes the job easier for butcher shops and delicatessens for slicing and dicing meat, sausages, and other deli products.
  • A surge in demand for good food texture meat amongst the populace across different geographical regions is likely to fuel market growth for meat dicing machines.
  • An increase in the market share of the restaurant sector is projected to augment the growth of the forum, owing to the plethora of meat preparations and delicacies that require diced or sliced meat.
  • Upsurge in the number of global fast-food outlets having increased application of meat dicing machines to cater to consumer demand is a key market propellant identified.
  • The dicing machines increase the consistency of the meat and remove toxins, thereby raising the adoption by concerned meat shops across countries.
  • Rising investment in the automation of meat processing equipment across emerging and developing economies is anticipated to boost the market growth in the forthcoming years.

Although the market has healthy growth, it has been identified by the expert analysts at Future Market Insights that certain aspects are likely to impede the growth of the forum in the long run and exert a negative influence on the current dynamics. The factors identified are as follows:

  • A rise in the cost of raw materials is expected to hinder the overall growth at a global level.
  • There’s a robust rise in the trend of going vegan, and a large section of the populace is turning vegetarian, which is anticipated to deter the advancement of the market in the upcoming years.
Report Attribute Details
Meat Dicing Machine Market Value (2023) US$ 469 million
Meat Dicing Machine Market Anticipated Value (2033) US$ 660 million
Meat Dicing Machine Projected Growth Rate (2023 to 2033) 3.5%

Don't pay for what you don't need

Customize your report by selecting specific countries or regions and save 30%!

Rapid Urbanization and Demand for Processed Meat Influences Growing Sale of Meat Dicing Machines

Consumers across the globe are getting indulged in hectic schedules with robust urbanization across developing countries. Inflating income levels are inculcating desires to consume ready-to-eat meat products or processed meat products amongst consumers. Therefore, a rising need to dice meat arises before further processing them, and this aspect is estimated to drive the sales of frozen meat dicing machines during the estimated period of study.

Increased expenditure on research and development activities has resulted in the development of new technologies, such as the integration of equipment for different purposes, including slicing, blending, and dicing, to save transfer costs and maintain hygiene levels. These trends are directly proportional to the rising market shares of meat-dicing machines through 2033.

Contrast with the Historical Market Scenario

After analyzing the market in-depth, the experts of FMI have unveiled that the meat dicing machine market has been witnessing an unprecedented surge in the past few years. There is an approximate rise of US$ 191 million surge in the total market value from 2022 to 2023. The market during the period 2018 to 2023 registered a CAGR of 2.1%.

The market growth can be attributed to the rapidly increasing market size of fast-food outlets like Domino's, KFC, McDonald’s, and more, which are expanding their business across multiple countries, boosting the adoption of meat-dicing machines.

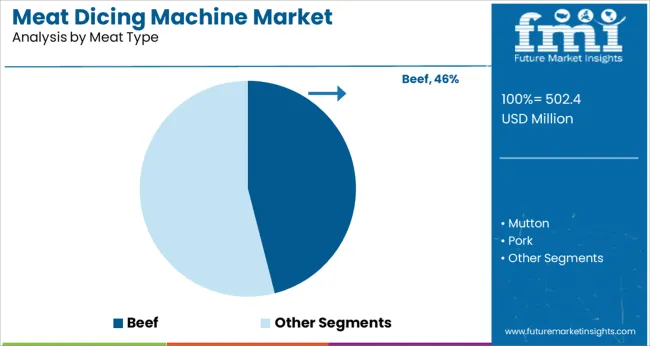
Besides this growth-propelling element prevailing in the forum, it has been identified by the analysts at FMI that there is an increased consumption of meat by athletes, and people worldwide are becoming very conscious about their health and hygiene. The beef meat dicing machine manufacturers are adhering to the concerns related to hygiene since the manual labor and dicing of meat by hand is getting eliminated, consumers are more inclined towards buying sliced and diced meat by machines, thereby impacting the market size of meat dicing machines in recent years.

Nandini Roy Choudhury

Principal Consultant

Talk to Analyst

Find your sweet spots for generating winning opportunities in this market.

Comparative Analysis of Adjacent Markets

Meat Dicing Machine Market:

Differentiating Aspects Meat Dicing Machine Market
CAGR 3.5%
Market Valuation in 2023 US$ 469 Million
Projected Market Value in 2033 US$ 660 Million
Drivers
  • The surge in disposable income is leading to increased expenditure on protein-rich food items, therefore meat dicing machines are in high demand.
  • Awareness about food hygiene, and discarding manual meat-cutting techniques is likely to fuel market growth.

Meat Processing Equipment Market:

Differentiating Aspects Meat Processing Equipment Market
CAGR 6.0%
Market Valuation in 2023 US$ 14.52 Billion
Projected Market Value in 2033 US$ 27.26 Billion
Drivers
  • This growth is attributed to the changing consumer preferences toward convenience foods, which are easy to eat and less time-consuming.
  • The rising disposable income has led to an increase in spending on luxury items such as processed foods, driving the market growth for the same.

Meat Slicing Machine Market:

Differentiating Aspects Meat Slicing machine Market
CAGR 6.83%
Market Valuation in 2023 US$ 12.98 Billion
Projected Market Value in 2033 US$ 15.12 Billion
Drivers
  • The meat slicer keeps the texture of the food intact, which is attracting a large number of consumers.
  • meat slicing equipment is increasingly finding applications in global fast-food outlets to cater to consumer demand in a proper manner, with the least operation time, and is revamping the market size for meat-slicing machines globally.

Category-wise Insights

Peek into the Domineering Segments in the Meat Dicing Machine Market

Automatic Meat Dicing Machine - By Automation Type

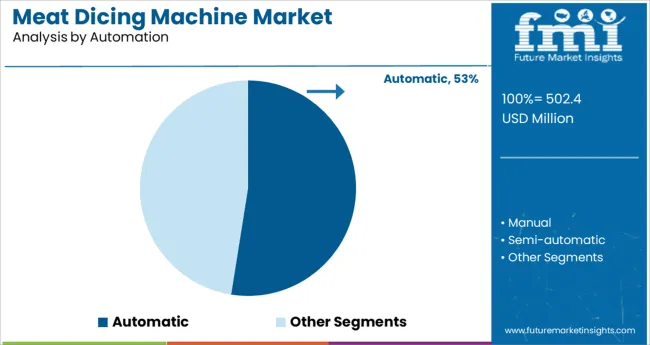
It is identified that the automatic meat dicing machine segment is likely to dominate the automation category. This segment is anticipated to account for a steady pace of advancement, registering a CAGR of 4.5% through 2033. The segment accounted for a historical CAGR of 2.6% and is likely to hold favorable shares during the estimated study period. The factors responsible for the dominance of automatic meat dicing machines are:

  • The automatic meat dicing machines are manufactured from sturdy materials and are long-lasting in nature.
  • The overall operation time is lesser in automatic meat dicing machines as compared to other product types.
  • The meticulous design and craftsmanship of these machines ensure high-quality dicing of meat and are therefore preferred by the growing hospitality sector.

Commercial Segment - By Application

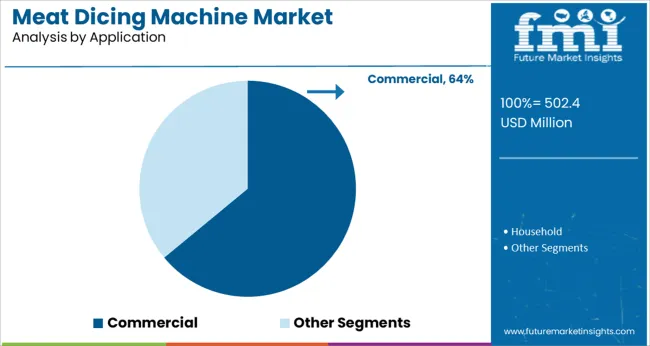
The commercial meat dicing machine segment is projected to exert a positive influence in the global meat dicing machine market. The segment is transcending at a moderate pace of 3.8% CAGR during the forecast period and has registered a historical CAGR of 2.5% during the period 2018 to 2022. The factors responsible for the favorable advancement of this segment are as follows:
  • The growing trend of barbeque restaurants is fueling the demand for dicing equipment.
  • The populace is largely favoring meatloaves, meatballs, tacos, and more, which need the meat to be diced before blending, and is therefore rapidly changing the shape of the market landscape.

Get the data you need at a Fraction of the cost

Personalize your report by choosing insights you need
and save 40%!

Country-wise Insights

Changing Lifestyle and Hygiene Concerns Stir Up the Regional Landscape for Meat Dicing Machines

Country United States of America
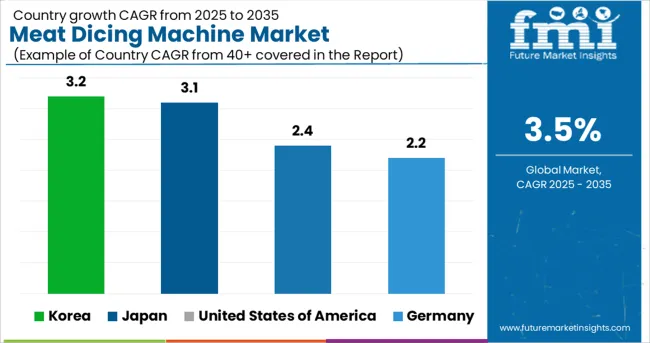
Statistics The USA meat dicing machine market is estimated to advance at a CAGR of 2.4% during the forecast period. This country is projected to touch a high of US$ 108 million by the end of 2033.
An approximate surge of US$ 23 million has been witnessed from 2022 to 2023. Historical CAGR: 1.9%
Growth Propellants The factors fueling market growth for dicing machines in the USA are:
  • A high level of automation in the food processing industry is boosting the demand for meat-dicing machines.
  • Meat is one of the most crucial parts of meals in the USA, thereby the growth prospect for the concerned market is considerably high.
Country Germany
Statistics The meat dicing machine market in Germany has registered a steady pace of growth, with a 2.2% CAGR estimated during the forecast period. The country is currently accountable for a market valuation of US$ 31 Million in 2023. There has been an approximate increase of US$ 6 million from the base year to the current. Historical CAGR: 1.6%
Growth Propellants The key elements contributing to the market growth in this European country are:
  • A spike in awareness about the benefits associated with the consumption of meat products among the populace is likely to fuel the market size in Germany.
  • Innovations in the food processing industry, such as the integration of all process equipment into one to minimize human efforts and increase hygiene levels are expected to spur market growth.
Country Japan
Statistics The Japan meat dicing machine market is anticipated to advance at an average paced CAGR of 3.1% through 2033. The market valuation is projected to reach US$ 41 million by the end of the forecast period and has witnessed a surge of US$ 11 million from 2022 to 2023. Historical CAGR: 2.2%
Growth Propellants The factors leading to the growth of the meat dicing machine in Japan are:
  • Varying income levels and cultural diversions, along with rising investments to open fast-food outlets are projected to be a key propellant for Japan.
  • The presence of a large number of manufacturers in the country is a factor aiding market advancement in Japan.
Country Korea
Statistics The market in Korea is projected to advance at a CAGR of 3.2% during the forecast period and acquire substantial shares in the global meat-dicing market.
Growth Propellants Factors owing to the growth of the market in Korea are:
  • Government grants are being extended to meat dicing suppliers to further innovate the product range and urate ease on fingertips for the deli marketers.
  • High health consciousness amongst the populace is fueling the consumption of meat due to its protein content, bolstering demand for cube meat dicing machines across the country.
  • The high-income population is demanding mechanized meat that has a good texture and is bolstering the market shares in Korea.

Start-up Ecosystem

The approach of New Entrants to Revamp the Meat Dicing Machine Landscape Through 2033

The new entrants in the meat dicing machine market are leveraging advancements in technology to launch new products and gain a competitive advantage. These firms are continually investing in research and development activities to keep themselves in tandem with the changing consumer preferences and end-use industry demands. Efforts are being made to strengthen their foothold in the forum and aid the further progression of the meat-dicing machines market.

Top Start-ups to Watch For

Prolific Machines - Cultured Meat Start-up

This start-up is ceding an entirely rare and innovative approach to curating meat and dicing them. They are incorporating the Henry Ford approach to cultivate meat using animal cells, assembling them into a structure of tissue that resembles the same meat we eat, and diversifying their range of meat saws for convenient handling.

Zaftec India - Meat Dicer Start-up

Zaftech Machines & Equipment offers industrial mincers which have been designed and developed over time based on the specific requirements of those working with these professional processing systems.

Robust, mechanically perfect, easy, and quick to dismantle and re-assemble for cleaning purposes - they are veritable production machines. The refrigerated versions highlight bonus features never before seen in similar machines: containment of bacterial load, absence of product oxidation, maintenance of sensory properties, etc.
Competitive Landscape

Attempts of Key Players to Spur Demand for Meat Dicing Machines

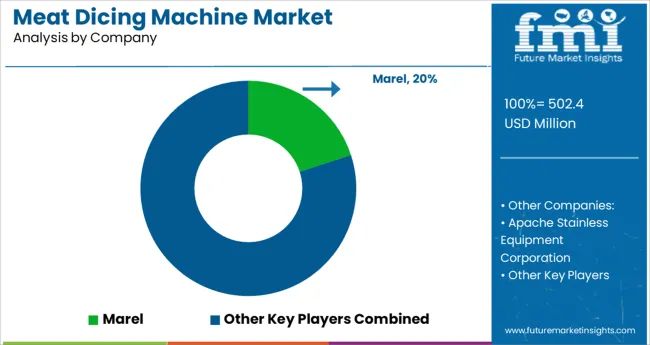
The global market is highly competitive due to the presence of multinational and local participants. New product development with faster processing times and high hygiene levels is one of the key strategies adopted by market participants to expand their product offerings to reinforce their competitive positions in the market.

Meat dicing machine suppliers are also forming strategic partnerships with other industry players to develop machinery that can perform multiple tasks, such as chopping, slicing, blending, and dicing, together with sharing expertise for Research and Development and exploring new markets. Moreover, value chain integration is one of the important strategies adopted by market players.

Recently, Sharfen upgraded their meat-slicing machines. It is identified that Scharfen machines strive for clean and consistent processing of your slicing products with zero waste. Their scale settings enable perfect product handling, whether shaving turkey or slicing triple-thick cut bacon.

Recent Developments

  • In July 2018, for the expansion of their portfolio, BAADER invested in a new salmon processing machine line by Norvelita, surimi, and a fish processing machine manufacturer.
  • In 2018, the Brazilian food industry earned about USD 179 billion which comprised approximately 35,800 food processing companies.
  • In the base year, the USA Food & Drug Administration (FDA) imposed a regulation on the transportation of human and animal food, which was also related to food processing techniques to govern the proper transportation of processed and semi-processed meat products. This has resulted in the development of advanced meat processing equipment, which is expected to fuel market growth over the forecast period.

Some of the key players proliferating in the market are

  • Apache Stainless Equipment Corporation
  • Bettcher Industries
  • Biro Manufacturing Company
  • Bizerba
  • Braher
  • Equipamientos Carnicos
  • GEA Group
  • Gee Gee Foods & Packaging
  • Illinois Tool Works
  • JBT Corporation
  • Marel
  • Metalbud Nowicki

Key Segments in the Meat dicing Machine Market

By Machine Type:

  • Automatic
  • Semi-automatic
  • Manual

By End-use:

  • Commercial
  • Household

By Meat Type:

  • Pork
  • Mutton
  • Beef

By Region:

  • North America
  • Latin America
  • Asia Pacific
  • Middle East and Africa (MEA)
  • Europe

Frequently Asked Questions

What is the Growth Outlook for the Meat Dicing Machine Market?

The growth outlook for the meat dicing machine market is predicted to advance at a CAGR of 3.5% from 2023 to 2033.

Which Region Leads the Meat Dicing Machine Market?

The North American region is anticipated to lead the meat dicing machine market during the forecast period.

What is the market valuation of the Meat Dicing Machine in 2023?

The market valuation of the meat dicing machine stands at US$ 469 million in 2023.

How much Growth Potential does the Meat Dicing Machine hold?

The meat dicing machine market is likely to hold a valuation of US$ 660 million by 2033.

Which sector is the key driver in the Meat Dicing Machine Market?

The hospitality sector is the key driver in the meat dicing machine market.

Table of Content

1. Executive Summary | Meat Dicing Machine Market

    1.1. Global Market Outlook

    1.2. Demand-side Trends

    1.3. Supply-side Trends

    1.4. Technology Roadmap Analysis

    1.5. Analysis and Recommendations

2. Market Overview

    2.1. Market Coverage / Taxonomy

    2.2. Market Definition / Scope / Limitations

3. Market Background

    3.1. Market Dynamics

        3.1.1. Drivers

        3.1.2. Restraints

        3.1.3. Opportunity

        3.1.4. Trends

    3.2. Impact of Covid-19

        3.2.1. Demand in Optimistic Scenario

        3.2.2. Demand in Likely Scenario

        3.2.3. Demand in Conservative Scenario

    3.3. Macro Factors and Forecast Factors

    3.4. Value Chain Analysis

        3.4.1. Profit Margin Analysis

        3.4.2. Raw Automation Suppliers

        3.4.3. Manufacturers, Wholesalers, and Distributors

        3.4.4. End Users/ Customers

    3.5. Regional Parent Market Outlook

    3.6. Production and Consumption Statistics

    3.7. Global Average Pricing Analysis Benchmark

4. Global Market Analysis 2018 to 2022 and Forecast, 2023 to 2033

    4.1. Historical Market Size Value (US$ Million) & Volume (Units) Analysis, 2018 to 2022

    4.2. Current and Future Market Size Value (US$ Million) & Volume (Units) Projections, 2023 to 2033

        4.2.1. Y-o-Y Growth Trend Analysis

        4.2.2. Absolute $ Opportunity Analysis

5. Global Market Analysis 2018 to 2022 and Forecast 2023 to 2033, By Automation

    5.1. Introduction / Key Findings

    5.2. Historical Market Size Value (US$ Million) & Volume (Units) Analysis By Automation, 2018 to 2022

    5.3. Current and Future Market Size Value (US$ Million) & Volume (Units) Analysis and Forecast By Automation, 2023 to 2033

        5.3.1. Manual

        5.3.2. Semi-automatic

        5.3.3. Automatic

    5.4. Y-o-Y Growth Trend Analysis By Automation, 2018 to 2022

    5.5. Absolute $ Opportunity Analysis By Automation, 2023 to 2033

6. Global Market Analysis 2018 to 2022 and Forecast 2023 to 2033, By Meat Type

    6.1. Introduction / Key Findings

    6.2. Historical Market Size Value (US$ Million) & Volume (Units) Analysis By Meat Type, 2018 to 2022

    6.3. Current and Future Market Size Value (US$ Million) & Volume (Units) Analysis and Forecast By Meat Type, 2023 to 2033

        6.3.1. Mutton

        6.3.2. Beef

        6.3.3. Pork

    6.4. Y-o-Y Growth Trend Analysis By Meat Type, 2018 to 2022

    6.5. Absolute $ Opportunity Analysis By Meat Type, 2023 to 2033

7. Global Market Analysis 2018 to 2022 and Forecast 2023 to 2033, By Application

    7.1. Introduction / Key Findings

    7.2. Historical Market Size Value (US$ Million) & Volume (Units) Analysis By Application, 2018 to 2022

    7.3. Current and Future Market Size Value (US$ Million) & Volume (Units) Analysis and Forecast By Application, 2023 to 2033

        7.3.1. Household

        7.3.2. Commercial

    7.4. Y-o-Y Growth Trend Analysis By Application, 2018 to 2022

    7.5. Absolute $ Opportunity Analysis By Application, 2023 to 2033

8. Global Market Analysis 2018 to 2022 and Forecast 2023 to 2033, by Region

    8.1. Introduction / Key Findings

    8.2. Historical Market Size Value (US$ Million) & Volume (Units) Analysis By Region, 2018 to 2022

    8.3. Current and Future Market Size Value (US$ Million) & Volume (Units) Analysis and Forecast By Region, 2023 to 2033

        8.3.1. North America

        8.3.2. Latin America

        8.3.3. Europe

        8.3.4. East Asia

        8.3.5. South Asia

        8.3.6. Oceania

        8.3.7. Middle East and Africa (MEA)

    8.4. Market Attractiveness Analysis, by Region

9. North America Market Analysis 2018 to 2022 and Forecast 2023 to 2033, By Country

    9.1. Historical Market Size Value (US$ Million) & Volume (Units) Trend Analysis By Market Taxonomy, 2018 to 2022

    9.2. Market Size Value (US$ Million) & Volume (Units) Forecast By Market Taxonomy, 2023 to 2033

        9.2.1. By Country

            9.2.1.1.United States of America

            9.2.1.2. Canada

        9.2.2. By Automation

        9.2.3. By Meat Type

        9.2.4. By Application

    9.3. Market Attractiveness Analysis

        9.3.1. By Country

        9.3.2. By Automation

        9.3.3. By Meat Type

        9.3.4. By Application

    9.4. Key Takeaways

10. Latin America Market Analysis 2018 to 2022 and Forecast 2023 to 2033, By Country

    10.1. Historical Market Size Value (US$ Million) & Volume (Units) Trend Analysis By Market Taxonomy, 2018 to 2022

    10.2. Market Size Value (US$ Million) & Volume (Units) Forecast By Market Taxonomy, 2023 to 2033

        10.2.1. By Country

            10.2.1.1. Brazil

            10.2.1.2. Mexico

            10.2.1.3. Argentina

            10.2.1.4. Chile

            10.2.1.5. Peru

            10.2.1.6. Rest of Latin America

        10.2.2. By Automation

        10.2.3. By Meat Type

        10.2.4. By Application

    10.3. Market Attractiveness Analysis

        10.3.1. By Country

        10.3.2. By Automation

        10.3.3. By Meat Type

        10.3.4. By Application

    10.4. Key Takeaways

11. Europe Market Analysis 2018 to 2022 and Forecast 2023 to 2033, By Country

    11.1. Historical Market Size Value (US$ Million) & Volume (Units) Trend Analysis By Market Taxonomy, 2018 to 2022

    11.2. Market Size Value (US$ Million) & Volume (Units) Forecast By Market Taxonomy, 2023 to 2033

        11.2.1. By Country

            11.2.1.1. Germany

            11.2.1.2. Italy

            11.2.1.3. France

            11.2.1.4. United Kingdom

            11.2.1.5. Spain

            11.2.1.6. BENELUX

            11.2.1.7. Nordic

            11.2.1.8. Russia

            11.2.1.9. Poland

            11.2.1.10. Rest of Europe

        11.2.2. By Automation

        11.2.3. By Meat Type

        11.2.4. By Application

    11.3. Market Attractiveness Analysis

        11.3.1. By Country

        11.3.2. By Automation

        11.3.3. By Meat Type

        11.3.4. By Application

    11.4. Key Takeaways

12. East Asia Market Analysis 2018 to 2022 and Forecast 2023 to 2033, By Country

    12.1. Historical Market Size Value (US$ Million) & Volume (Units) Trend Analysis By Market Taxonomy, 2018 to 2022

    12.2. Market Size Value (US$ Million) & Volume (Units) Forecast By Market Taxonomy, 2023 to 2033

        12.2.1. By Country

            12.2.1.1. China

            12.2.1.2. Japan

            12.2.1.3. South Korea

        12.2.2. By Automation

        12.2.3. By Meat Type

        12.2.4. By Application

    12.3. Market Attractiveness Analysis

        12.3.1. By Country

        12.3.2. By Automation

        12.3.3. By Meat Type

        12.3.4. By Application

    12.4. Key Takeaways

13. South Asia Market Analysis 2018 to 2022 and Forecast 2023 to 2033, By Country

    13.1. Historical Market Size Value (US$ Million) & Volume (Units) Trend Analysis By Market Taxonomy, 2018 to 2022

    13.2. Market Size Value (US$ Million) & Volume (Units) Forecast By Market Taxonomy, 2023 to 2033

        13.2.1. By Country

            13.2.1.1. India

            13.2.1.2. Thailand

            13.2.1.3. Malaysia

            13.2.1.4. Indonesia

            13.2.1.5. Rest of South Asia

        13.2.2. By Automation

        13.2.3. By Meat Type

        13.2.4. By Application

    13.3. Market Attractiveness Analysis

        13.3.1. By Country

        13.3.2. By Automation

        13.3.3. By Meat Type

        13.3.4. By Application

    13.4. Key Takeaways

14. Oceania Market Analysis 2018 to 2022 and Forecast 2023 to 2033, By Country

    14.1. Historical Market Size Value (US$ Million) & Volume (Units) Trend Analysis By Market Taxonomy, 2018 to 2022

    14.2. Market Size Value (US$ Million) & Volume (Units) Forecast By Market Taxonomy, 2023 to 2033

        14.2.1. By Country

            14.2.1.1. Australia

            14.2.1.2. New Zealand

        14.2.2. By Automation

        14.2.3. By Meat Type

        14.2.4. By Application

    14.3. Market Attractiveness Analysis

        14.3.1. By Country

        14.3.2. By Automation

        14.3.3. By Meat Type

        14.3.4. By Application

    14.4. Key Takeaways

15. Middle East & Africa Market Analysis 2018 to 2022 and Forecast 2023 to 2033, By Country

    15.1. Historical Market Size Value (US$ Million) & Volume (Units) Trend Analysis By Market Taxonomy, 2018 to 2022

    15.2. Market Size Value (US$ Million) & Volume (Units) Forecast By Market Taxonomy, 2023 to 2033

        15.2.1. By Country

            15.2.1.1. GCC Countries

            15.2.1.2. Turkey

            15.2.1.3. Northern Africa

            15.2.1.4. South Africa

            15.2.1.5. Rest of MEA

        15.2.2. By Automation

        15.2.3. By Meat Type

        15.2.4. By Application

    15.3. Market Attractiveness Analysis

        15.3.1. By Country

        15.3.2. By Automation

        15.3.3. By Meat Type

        15.3.4. By Application

    15.4. Key Takeaways

16. Country-wise Market Analysis 

    16.1. United States (USA)

        16.1.1. Market Share Analysis, 2023

        16.1.2. By Automation

        16.1.3. By Meat Type

        16.1.4. By Application

    16.2. Canada

        16.2.1. Market Share Analysis, 2023

        16.2.2. By Automation

        16.2.3. By Meat Type

        16.2.4. By Application

    16.3. Brazil

        16.3.1. Market Share Analysis, 2023

        16.3.2. By Automation

        16.3.3. By Meat Type

        16.3.4. By Application

    16.4. Mexico

        16.4.1. Market Share Analysis, 2023

        16.4.2. By Automation

        16.4.3. By Meat Type

        16.4.4. By Application

    16.5. Germany

        16.5.1. Market Share Analysis, 2023

        16.5.2. By Automation

        16.5.3. By Meat Type

        16.5.4. By Application

    16.6. Italy

        16.6.1. Market Share Analysis, 2023

        16.6.2. By Automation

        16.6.3. By Meat Type

        16.6.4. By Application

    16.7. France

        16.7.1. Market Share Analysis, 2023

        16.7.2. By Automation

        16.7.3. By Meat Type

        16.7.4. By Application

    16.8. Spain

        16.8.1. Market Share Analysis, 2023

        16.8.2. By Automation

        16.8.3. By Meat Type

        16.8.4. By Application

    16.9. United Kingdom

        16.9.1. Market Share Analysis, 2023

        16.9.2. By Automation

        16.9.3. By Meat Type

        16.9.4. By Application

    16.10. Russia

        16.10.1. Market Share Analysis, 2023

        16.10.2. By Automation

        16.10.3. By Meat Type

        16.10.4. By Application

    16.11. China

        16.11.1. Market Share Analysis, 2023

        16.11.2. By Automation

        16.11.3. By Meat Type

        16.11.4. By Application

    16.12. Japan

        16.12.1. Market Share Analysis, 2023

        16.12.2. By Automation

        16.12.3. By Meat Type

        16.12.4. By Application

    16.13. India

        16.13.1. Market Share Analysis, 2023

        16.13.2. By Automation

        16.13.3. By Meat Type

        16.13.4. By Application

    16.14. GCC Countries

        16.14.1. Market Share Analysis, 2023

        16.14.2. By Automation

        16.14.3. By Meat Type

        16.14.4. By Application

    16.15. Australia

        16.15.1. Market Share Analysis, 2023

        16.15.2. By Automation

        16.15.3. By Meat Type

        16.15.4. By Application

17. Market Structure Analysis

    17.1. Competition Dashboard

    17.2. Competition Benchmarking

    17.3. Market Share Analysis of Top Players

        17.3.1. By Region

        17.3.2. By Product Portfolio

18. Competition Analysis

    18.1. Competition Deep Dive

        18.1.1. Mingchun machinery

            18.1.1.1. Overview

            18.1.1.2. Product Portfolio

            18.1.1.3. Profitability by Market Segments (Product/Channel/Region)

            18.1.1.4. Sales Footprint

            18.1.1.5. Strategy Overview

                18.1.1.5.1. Marketing Strategy

                18.1.1.5.2. Product Strategy

                18.1.1.5.3. Channel Strategy

        18.1.2. Kang Shuo International

            18.1.2.1. Overview

            18.1.2.2. Product Portfolio

            18.1.2.3. Profitability by Market Segments (Product/Channel/Region)

            18.1.2.4. Sales Footprint

            18.1.2.5. Strategy Overview

                18.1.2.5.1. Marketing Strategy

                18.1.2.5.2. Product Strategy

                18.1.2.5.3. Channel Strategy

        18.1.3. Bettcher industries

            18.1.3.1. Overview

            18.1.3.2. Product Portfolio

            18.1.3.3. Profitability by Market Segments (Product/Channel/Region)

            18.1.3.4. Sales Footprint

            18.1.3.5. Strategy Overview

                18.1.3.5.1. Marketing Strategy

                18.1.3.5.2. Product Strategy

                18.1.3.5.3. Channel Strategy

        18.1.4. Omega Group s.r.l

            18.1.4.1. Overview

            18.1.4.2. Product Portfolio

            18.1.4.3. Profitability by Market Segments (Product/Channel/Region)

            18.1.4.4. Sales Footprint

            18.1.4.5. Strategy Overview

                18.1.4.5.1. Marketing Strategy

                18.1.4.5.2. Product Strategy

                18.1.4.5.3. Channel Strategy

        18.1.5. Volano Berkel Slicers

            18.1.5.1. Overview

            18.1.5.2. Product Portfolio

            18.1.5.3. Profitability by Market Segments (Product/Channel/Region)

            18.1.5.4. Sales Footprint

            18.1.5.5. Strategy Overview

                18.1.5.5.1. Marketing Strategy

                18.1.5.5.2. Product Strategy

                18.1.5.5.3. Channel Strategy

        18.1.6. Giantwell Machinery Co., Ltd.

            18.1.6.1. Overview

            18.1.6.2. Product Portfolio

            18.1.6.3. Profitability by Market Segments (Product/Channel/Region)

            18.1.6.4. Sales Footprint

            18.1.6.5. Strategy Overview

                18.1.6.5.1. Marketing Strategy

                18.1.6.5.2. Product Strategy

                18.1.6.5.3. Channel Strategy

        18.1.7. Alpha 

            18.1.7.1. Overview

            18.1.7.2. Product Portfolio

            18.1.7.3. Profitability by Market Segments (Product/Channel/Region)

            18.1.7.4. Sales Footprint

            18.1.7.5. Strategy Overview

                18.1.7.5.1. Marketing Strategy

                18.1.7.5.2. Product Strategy

                18.1.7.5.3. Channel Strategy

        18.1.8. Taizy Food Machines

            18.1.8.1. Overview

            18.1.8.2. Product Portfolio

            18.1.8.3. Profitability by Market Segments (Product/Channel/Region)

            18.1.8.4. Sales Footprint

            18.1.8.5. Strategy Overview

                18.1.8.5.1. Marketing Strategy

                18.1.8.5.2. Product Strategy

                18.1.8.5.3. Channel Strategy

        18.1.9. Fengxiang

            18.1.9.1. Overview

            18.1.9.2. Product Portfolio

            18.1.9.3. Profitability by Market Segments (Product/Channel/Region)

            18.1.9.4. Sales Footprint

            18.1.9.5. Strategy Overview

                18.1.9.5.1. Marketing Strategy

                18.1.9.5.2. Product Strategy

                18.1.9.5.3. Channel Strategy

        18.1.10. FAM Industrial food cutting solutions

            18.1.10.1. Overview

            18.1.10.2. Product Portfolio

            18.1.10.3. Profitability by Market Segments (Product/Channel/Region)

            18.1.10.4. Sales Footprint

            18.1.10.5. Strategy Overview

                18.1.10.5.1. Marketing Strategy

                18.1.10.5.2. Product Strategy

                18.1.10.5.3. Channel Strategy

        18.1.11. Urschel Laboratories, Inc.

            18.1.11.1. Overview

            18.1.11.2. Product Portfolio

            18.1.11.3. Profitability by Market Segments (Product/Channel/Region)

            18.1.11.4. Sales Footprint

            18.1.11.5. Strategy Overview

                18.1.11.5.1. Marketing Strategy

                18.1.11.5.2. Product Strategy

                18.1.11.5.3. Channel Strategy

        18.1.12. Rudolf Maass & Partner GmbH

            18.1.12.1. Overview

            18.1.12.2. Product Portfolio

            18.1.12.3. Profitability by Market Segments (Product/Channel/Region)

            18.1.12.4. Sales Footprint

            18.1.12.5. Strategy Overview

                18.1.12.5.1. Marketing Strategy

                18.1.12.5.2. Product Strategy

                18.1.12.5.3. Channel Strategy

        18.1.13. ABM COMPANY SRL

            18.1.13.1. Overview

            18.1.13.2. Product Portfolio

            18.1.13.3. Profitability by Market Segments (Product/Channel/Region)

            18.1.13.4. Sales Footprint

            18.1.13.5. Strategy Overview

                18.1.13.5.1. Marketing Strategy

                18.1.13.5.2. Product Strategy

                18.1.13.5.3. Channel Strategy

        18.1.14. Kingston Machinery

            18.1.14.1. Overview

            18.1.14.2. Product Portfolio

            18.1.14.3. Profitability by Market Segments (Product/Channel/Region)

            18.1.14.4. Sales Footprint

            18.1.14.5. Strategy Overview

                18.1.14.5.1. Marketing Strategy

                18.1.14.5.2. Product Strategy

                18.1.14.5.3. Channel Strategy

        18.1.15. Braher International

            18.1.15.1. Overview

            18.1.15.2. Product Portfolio

            18.1.15.3. Profitability by Market Segments (Product/Channel/Region)

            18.1.15.4. Sales Footprint

            18.1.15.5. Strategy Overview

                18.1.15.5.1. Marketing Strategy

                18.1.15.5.2. Product Strategy

                18.1.15.5.3. Channel Strategy

        18.1.16. MANCONI Srl

            18.1.16.1. Overview

            18.1.16.2. Product Portfolio

            18.1.16.3. Profitability by Market Segments (Product/Channel/Region)

            18.1.16.4. Sales Footprint

            18.1.16.5. Strategy Overview

                18.1.16.5.1. Marketing Strategy

                18.1.16.5.2. Product Strategy

                18.1.16.5.3. Channel Strategy

19. Assumptions and Acronyms Used

20. Research Methodology

Don't pay for what you don't need

Customize your report by selecting specific countries or regions and save 30%!

List of Tables

Table 01: Global Market Value (US$ Million) Forecast by Region, 2018 to 2033

Table 02: Global Market Volume (Units) Forecast by Region, 2018 to 2033

Table 03: Global Market Value (US$ Million) Forecast by Automation, 2018 to 2033

Table 04: Global Market Volume (Units) Forecast by Automation, 2018 to 2033

Table 05: Global Market Value (US$ Million) Forecast by Meat Type, 2018 to 2033

Table 06: Global Market Volume (Units) Forecast by Meat Type, 2018 to 2033

Table 07: Global Market Value (US$ Million) Forecast by Application, 2018 to 2033

Table 08: Global Market Volume (Units) Forecast by Application, 2018 to 2033

Table 09: North America Market Value (US$ Million) Forecast by Country, 2018 to 2033

Table 10: North America Market Volume (Units) Forecast by Country, 2018 to 2033

Table 11: North America Market Value (US$ Million) Forecast by Automation, 2018 to 2033

Table 12: North America Market Volume (Units) Forecast by Automation, 2018 to 2033

Table 13: North America Market Value (US$ Million) Forecast by Meat Type, 2018 to 2033

Table 14: North America Market Volume (Units) Forecast by Meat Type, 2018 to 2033

Table 15: North America Market Value (US$ Million) Forecast by Application, 2018 to 2033

Table 16: North America Market Volume (Units) Forecast by Application, 2018 to 2033

Table 17: Latin America Market Value (US$ Million) Forecast by Country, 2018 to 2033

Table 18: Latin America Market Volume (Units) Forecast by Country, 2018 to 2033

Table 19: Latin America Market Value (US$ Million) Forecast by Automation, 2018 to 2033

Table 20: Latin America Market Volume (Units) Forecast by Automation, 2018 to 2033

Table 21: Latin America Market Value (US$ Million) Forecast by Meat Type, 2018 to 2033

Table 22: Latin America Market Volume (Units) Forecast by Meat Type, 2018 to 2033

Table 23: Latin America Market Value (US$ Million) Forecast by Application, 2018 to 2033

Table 24: Latin America Market Volume (Units) Forecast by Application, 2018 to 2033

Table 25: Europe Market Value (US$ Million) Forecast by Country, 2018 to 2033

Table 26: Europe Market Volume (Units) Forecast by Country, 2018 to 2033

Table 27: Europe Market Value (US$ Million) Forecast by Automation, 2018 to 2033

Table 28: Europe Market Volume (Units) Forecast by Automation, 2018 to 2033

Table 29: Europe Market Value (US$ Million) Forecast by Meat Type, 2018 to 2033

Table 30: Europe Market Volume (Units) Forecast by Meat Type, 2018 to 2033

Table 31: Europe Market Value (US$ Million) Forecast by Application, 2018 to 2033

Table 32: Europe Market Volume (Units) Forecast by Application, 2018 to 2033

Table 33: East Asia Market Value (US$ Million) Forecast by Country, 2018 to 2033

Table 34: East Asia Market Volume (Units) Forecast by Country, 2018 to 2033

Table 35: East Asia Market Value (US$ Million) Forecast by Automation, 2018 to 2033

Table 36: East Asia Market Volume (Units) Forecast by Automation, 2018 to 2033

Table 37: East Asia Market Value (US$ Million) Forecast by Meat Type, 2018 to 2033

Table 38: East Asia Market Volume (Units) Forecast by Meat Type, 2018 to 2033

Table 39: East Asia Market Value (US$ Million) Forecast by Application, 2018 to 2033

Table 40: East Asia Market Volume (Units) Forecast by Application, 2018 to 2033

Table 41: South Asia Market Value (US$ Million) Forecast by Country, 2018 to 2033

Table 42: South Asia Market Volume (Units) Forecast by Country, 2018 to 2033

Table 43: South Asia Market Value (US$ Million) Forecast by Automation, 2018 to 2033

Table 44: South Asia Market Volume (Units) Forecast by Automation, 2018 to 2033

Table 45: South Asia Market Value (US$ Million) Forecast by Meat Type, 2018 to 2033

Table 46: South Asia Market Volume (Units) Forecast by Meat Type, 2018 to 2033

Table 47: South Asia Market Value (US$ Million) Forecast by Application, 2018 to 2033

Table 48: South Asia Market Volume (Units) Forecast by Application, 2018 to 2033

Table 49: Oceania Market Value (US$ Million) Forecast by Country, 2018 to 2033

Table 50: Oceania Market Volume (Units) Forecast by Country, 2018 to 2033

Table 51: Oceania Market Value (US$ Million) Forecast by Automation, 2018 to 2033

Table 52: Oceania Market Volume (Units) Forecast by Automation, 2018 to 2033

Table 53: Oceania Market Value (US$ Million) Forecast by Meat Type, 2018 to 2033

Table 54: Oceania Market Volume (Units) Forecast by Meat Type, 2018 to 2033

Table 55: Oceania Market Value (US$ Million) Forecast by Application, 2018 to 2033

Table 56: Oceania Market Volume (Units) Forecast by Application, 2018 to 2033

Table 57: MEA Market Value (US$ Million) Forecast by Country, 2018 to 2033

Table 58: MEA Market Volume (Units) Forecast by Country, 2018 to 2033

Table 59: MEA Market Value (US$ Million) Forecast by Automation, 2018 to 2033

Table 60: MEA Market Volume (Units) Forecast by Automation, 2018 to 2033

Table 61: MEA Market Value (US$ Million) Forecast by Meat Type, 2018 to 2033

Table 62: MEA Market Volume (Units) Forecast by Meat Type, 2018 to 2033

Table 63: MEA Market Value (US$ Million) Forecast by Application, 2018 to 2033

Table 64: MEA Market Volume (Units) Forecast by Application, 2018 to 2033

Table 65: USA Market Value (US$ Million) Forecast by Automation, Meat Type, and Application (2023(E) & 2033(F))

Table 66: Brazil Market Value (US$ Million) Forecast by Automation, Meat Type, and Application (2023(E) & 2033(F))

Table 67: Mexico Market Value (US$ Million) Forecast by Automation, Meat Type, and Application (2023(E) & 2033(F))

Table 68: Germany Market Value (US$ Million) Forecast by Automation, Meat Type, and Application (2023(E) & 2033(F))

Table 69: Italy Market Value (US$ Million) Forecast by Automation, Meat Type, and Application (2023(E) & 2033(F))

Table 70: France Market Value (US$ Million) Forecast by Automation, Meat Type, and Application (2023(E) & 2033(F))

Table 71: Spain Market Value (US$ Million) Forecast by Automation, Meat Type, and Application (2023(E) & 2033(F))

Table 72: UK Market Value (US$ Million) Forecast by Automation, Meat Type, and Application (2023(E) & 2033(F))

Table 73: China Market Value (US$ Million) Forecast by Automation, Meat Type, and Application (2023(E) & 2033(F))

Table 74: Japan Market Value (US$ Million) Forecast by Automation, Meat Type, and Application (2023(E) & 2033(F))

Table 75: India Market Value (US$ Million) Forecast by Automation, Meat Type, and Application (2023(E) & 2033(F))

Table 76: Australia Market Value (US$ Million) Forecast by Automation, Meat Type, and Application (2023(E) & 2033(F))
Nandini Roy Choudhury

Principal Consultant

Talk to Analyst

Find your sweet spots for generating winning opportunities in this market.

List of Charts

Figure 01: Global Market Value (US$ Million) by Automation, 2023 to 2033

Figure 02: Global Market Value (US$ Million) by Meat Type, 2023 to 2033

Figure 03: Global Market Value (US$ Million) by Application, 2023 to 2033

Figure 04: Global Market Value (US$ Million) by Region, 2023 to 2033

Figure 05: Global Market Value (US$ Million) Analysis by Region, 2018 to 2022

Figure 06: Global Market Volume (Units) Analysis by Region, 2018 to 2033

Figure 07: Global Market Value Share (%) and BPS Analysis by Region, 2023 to 2033

Figure 08: Global Market Y-o-Y Growth (%) Projections by Region, 2023 to 2033

Figure 09: Global Market Value (US$ Million) Analysis by Automation, 2018 to 2022

Figure 10: Global Market Volume (Units) Analysis by Automation, 2018 to 2033

Figure 11: Global Market Value Share (%) and BPS Analysis by Automation, 2023 to 2033

Figure 12: Global Market Y-o-Y Growth (%) Projections by Automation, 2023 to 2033

Figure 13: Global Market Value (US$ Million) Analysis by Meat Type, 2018 to 2022

Figure 14: Global Market Volume (Units) Analysis by Meat Type, 2018 to 2033

Figure 15: Global Market Value Share (%) and BPS Analysis by Meat Type, 2023 to 2033

Figure 16: Global Market Y-o-Y Growth (%) Projections by Meat Type, 2023 to 2033

Figure 17: Global Market Value (US$ Million) Analysis by Application, 2018 to 2022

Figure 18: Global Market Volume (Units) Analysis by Application, 2018 to 2033

Figure 19: Global Market Value Share (%) and BPS Analysis by Application, 2023 to 2033

Figure 20: Global Market Y-o-Y Growth (%) Projections by Application, 2023 to 2033

Figure 21: Global Market Attractiveness by Automation, 2023 to 2033

Figure 22: Global Market Attractiveness by Meat Type, 2023 to 2033

Figure 23: Global Market Attractiveness by Meat Type, 2023 to 2033

Figure 24: Global Market Attractiveness by Application, 2023 to 2033

Figure 25: Global Market Attractiveness by Region, 2023 to 2033

Figure 26: North America Market Value (US$ Million) by Automation, 2023 to 2033

Figure 27: North America Market Value (US$ Million) by Meat Type, 2023 to 2033

Figure 28: North America Market Value (US$ Million) by Application, 2023 to 2033

Figure 29: North America Market Value (US$ Million) by Country, 2023 to 2033

Figure 30: North America Market Value (US$ Million) Analysis by Country, 2018 to 2022

Figure 31: North America Market Volume (Units) Analysis by Country, 2018 to 2033

Figure 32: North America Market Value Share (%) and BPS Analysis by Country, 2023 to 2033

Figure 33: North America Market Y-o-Y Growth (%) Projections by Country, 2023 to 2033

Figure 34: North America Market Value (US$ Million) Analysis by Automation, 2018 to 2022

Figure 35: North America Market Volume (Units) Analysis by Automation, 2018 to 2033

Figure 36: North America Market Value Share (%) and BPS Analysis by Automation, 2023 to 2033

Figure 37: North America Market Y-o-Y Growth (%) Projections by Automation, 2023 to 2033

Figure 38: North America Market Value (US$ Million) Analysis by Meat Type, 2018 to 2022

Figure 39: North America Market Volume (Units) Analysis by Meat Type, 2018 to 2033

Figure 40: North America Market Value Share (%) and BPS Analysis by Meat Type, 2023 to 2033

Figure 41: North America Market Y-o-Y Growth (%) Projections by Meat Type, 2023 to 2033

Figure 42: North America Market Value (US$ Million) Analysis by Application, 2018 to 2022

Figure 43: North America Market Volume (Units) Analysis by Application, 2018 to 2033

Figure 44: North America Market Value Share (%) and BPS Analysis by Application, 2023 to 2033

Figure 45: North America Market Y-o-Y Growth (%) Projections by Application, 2023 to 2033

Figure 46: North America Market Attractiveness by Automation, 2023 to 2033

Figure 47: North America Market Attractiveness by Meat Type, 2023 to 2033

Figure 48: North America Market Attractiveness by Application, 2023 to 2033

Figure 49: North America Market Attractiveness by Country, 2023 to 2033

Figure 50: Latin America Market Value (US$ Million) by Automation, 2023 to 2033

Figure 51: Latin America Market Value (US$ Million) by Meat Type, 2023 to 2033

Figure 52: Latin America Market Value (US$ Million) by Application, 2023 to 2033

Figure 53: Latin America Market Value (US$ Million) by Country, 2023 to 2033

Figure 54: Latin America Market Value (US$ Million) Analysis by Country, 2018 to 2022

Figure 55: Latin America Market Volume (Units) Analysis by Country, 2018 to 2033

Figure 56: Latin America Market Value Share (%) and BPS Analysis by Country, 2023 to 2033

Figure 57: Latin America Market Y-o-Y Growth (%) Projections by Country, 2023 to 2033

Figure 58: Latin America Market Value (US$ Million) Analysis by Automation, 2018 to 2022

Figure 59: Latin America Market Volume (Units) Analysis by Automation, 2018 to 2033

Figure 60: Latin America Market Value Share (%) and BPS Analysis by Automation, 2023 to 2033

Figure 61: Latin America Market Y-o-Y Growth (%) Projections by Automation, 2023 to 2033

Figure 62: Latin America Market Value (US$ Million) Analysis by Meat Type, 2018 to 2022

Figure 63: Latin America Market Volume (Units) Analysis by Meat Type, 2018 to 2033

Figure 64: Latin America Market Value Share (%) and BPS Analysis by Meat Type, 2023 to 2033

Figure 65: Latin America Market Y-o-Y Growth (%) Projections by Meat Type, 2023 to 2033

Figure 66: Latin America Market Value (US$ Million) Analysis by Application, 2018 to 2022

Figure 67: Latin America Market Volume (Units) Analysis by Application, 2018 to 2033

Figure 68: Latin America Market Value Share (%) and BPS Analysis by Application, 2023 to 2033

Figure 69: Latin America Market Y-o-Y Growth (%) Projections by Application, 2023 to 2033

Figure 70: Latin America Market Attractiveness by Automation, 2023 to 2033

Figure 71: Latin America Market Attractiveness by Meat Type, 2023 to 2033

Figure 72: Latin America Market Attractiveness by Application, 2023 to 2033

Figure 73: Latin America Market Attractiveness by Country, 2023 to 2033

Figure 74: Europe Market Value (US$ Million) by Automation, 2023 to 2033

Figure 75: Europe Market Value (US$ Million) by Meat Type, 2023 to 2033

Figure 76: Europe Market Value (US$ Million) by Application, 2023 to 2033

Figure 77: Europe Market Value (US$ Million) by Country, 2023 to 2033

Figure 78: Europe Market Value (US$ Million) Analysis by Country, 2018 to 2022

Figure 79: Europe Market Volume (Units) Analysis by Country, 2018 to 2033

Figure 80: Europe Market Value Share (%) and BPS Analysis by Country, 2023 to 2033

Figure 81: Europe Market Y-o-Y Growth (%) Projections by Country, 2023 to 2033

Figure 82: Europe Market Value (US$ Million) Analysis by Automation, 2018 to 2022

Figure 83: Europe Market Volume (Units) Analysis by Automation, 2018 to 2033

Figure 84: Europe Market Value Share (%) and BPS Analysis by Automation, 2023 to 2033

Figure 85: Europe Market Y-o-Y Growth (%) Projections by Automation, 2023 to 2033

Figure 86: Europe Market Value (US$ Million) Analysis by Meat Type, 2018 to 2022

Figure 87: Europe Market Volume (Units) Analysis by Meat Type, 2018 to 2033

Figure 88: Europe Market Value Share (%) and BPS Analysis by Meat Type, 2023 to 2033

Figure 89: Europe Market Y-o-Y Growth (%) Projections by Meat Type, 2023 to 2033

Figure 90: Europe Market Value (US$ Million) Analysis by Application, 2018 to 2022

Figure 91: Europe Market Volume (Units) Analysis by Application, 2018 to 2033

Figure 92: Europe Market Value Share (%) and BPS Analysis by Application, 2023 to 2033

Figure 93: Europe Market Y-o-Y Growth (%) Projections by Application, 2023 to 2033

Figure 94: Europe Market Attractiveness by Automation, 2023 to 2033

Figure 95: Europe Market Attractiveness by Meat Type, 2023 to 2033

Figure 96: Europe Market Attractiveness by Application, 2023 to 2033

Figure 97: Europe Market Attractiveness by Country, 2023 to 2033

Figure 98: East Asia Market Value (US$ Million) by Automation, 2023 to 2033

Figure 99: East Asia Market Value (US$ Million) by Meat Type, 2023 to 2033

Figure 100: East Asia Market Value (US$ Million) by Application, 2023 to 2033

Figure 101: East Asia Market Value (US$ Million) by Country, 2023 to 2033

Figure 102: East Asia Market Value (US$ Million) Analysis by Country, 2018 to 2022

Figure 103: East Asia Market Volume (Units) Analysis by Country, 2018 to 2033

Figure 104: East Asia Market Value Share (%) and BPS Analysis by Country, 2023 to 2033

Figure 105: East Asia Market Y-o-Y Growth (%) Projections by Country, 2023 to 2033

Figure 106: East Asia Market Value (US$ Million) Analysis by Automation, 2018 to 2022

Figure 107: East Asia Market Volume (Units) Analysis by Automation, 2018 to 2033

Figure 108: East Asia Market Value Share (%) and BPS Analysis by Automation, 2023 to 2033

Figure 109: East Asia Market Y-o-Y Growth (%) Projections by Automation, 2023 to 2033

Figure 110: East Asia Market Value (US$ Million) Analysis by Meat Type, 2018 to 2022

Figure 111: East Asia Market Volume (Units) Analysis by Meat Type, 2018 to 2033

Figure 112: East Asia Market Value Share (%) and BPS Analysis by Meat Type, 2023 to 2033

Figure 113: East Asia Market Y-o-Y Growth (%) Projections by Meat Type, 2023 to 2033

Figure 114: East Asia Market Value (US$ Million) Analysis by Application, 2018 to 2022

Figure 115: East Asia Market Volume (Units) Analysis by Application, 2018 to 2033

Figure 116: East Asia Market Value Share (%) and BPS Analysis by Application, 2023 to 2033

Figure 117: East Asia Market Y-o-Y Growth (%) Projections by Application, 2023 to 2033

Figure 118: East Asia Market Attractiveness by Automation, 2023 to 2033

Figure 119: East Asia Market Attractiveness by Meat Type, 2023 to 2033

Figure 120: East Asia Market Attractiveness by Application, 2023 to 2033

Figure 121: East Asia Market Attractiveness by Country, 2023 to 2033

Figure 122: South Asia Market Value (US$ Million) by Automation, 2023 to 2033

Figure 123: South Asia Market Value (US$ Million) by Meat Type, 2023 to 2033

Figure 124: South Asia Market Value (US$ Million) by Application, 2023 to 2033

Figure 125: South Asia Market Value (US$ Million) by Country, 2023 to 2033

Figure 126: South Asia Market Value (US$ Million) Analysis by Country, 2018 to 2022

Figure 127: South Asia Market Volume (Units) Analysis by Country, 2018 to 2033

Figure 128: South Asia Market Value Share (%) and BPS Analysis by Country, 2023 to 2033

Figure 129: South Asia Market Y-o-Y Growth (%) Projections by Country, 2023 to 2033

Figure 130: South Asia Market Value (US$ Million) Analysis by Automation, 2018 to 2022

Figure 131: South Asia Market Volume (Units) Analysis by Automation, 2018 to 2033

Figure 132: South Asia Market Value Share (%) and BPS Analysis by Automation, 2023 to 2033

Figure 133: South Asia Market Y-o-Y Growth (%) Projections by Automation, 2023 to 2033

Figure 134: South Asia Market Value (US$ Million) Analysis by Meat Type, 2018 to 2022

Figure 135: South Asia Market Volume (Units) Analysis by Meat Type, 2018 to 2033

Figure 136: South Asia Market Value Share (%) and BPS Analysis by Meat Type, 2023 to 2033

Figure 137: South Asia Market Y-o-Y Growth (%) Projections by Meat Type, 2023 to 2033

Figure 138: South Asia Market Value (US$ Million) Analysis by Application, 2018 to 2022

Figure 139: South Asia Market Volume (Units) Analysis by Application, 2018 to 2033

Figure 140: South Asia Market Value Share (%) and BPS Analysis by Application, 2023 to 2033

Figure 141: South Asia Market Y-o-Y Growth (%) Projections by Application, 2023 to 2033

Figure 142: South Asia Market Attractiveness by Automation, 2023 to 2033

Figure 143: South Asia Market Attractiveness by Meat Type, 2023 to 2033

Figure 144: South Asia Market Attractiveness by Application, 2023 to 2033

Figure 145: South Asia Market Attractiveness by Country, 2023 to 2033

Figure 146: Oceania Market Value (US$ Million) by Automation, 2023 to 2033

Figure 147: Oceania Market Value (US$ Million) by Meat Type, 2023 to 2033

Figure 148: Oceania Market Value (US$ Million) by Application, 2023 to 2033

Figure 149: Oceania Market Value (US$ Million) by Country, 2023 to 2033

Figure 150: Oceania Market Value (US$ Million) Analysis by Country, 2018 to 2022

Figure 151: Oceania Market Volume (Units) Analysis by Country, 2018 to 2033

Figure 152: Oceania Market Value Share (%) and BPS Analysis by Country, 2023 to 2033

Figure 153: Oceania Market Y-o-Y Growth (%) Projections by Country, 2023 to 2033

Figure 154: Oceania Market Value (US$ Million) Analysis by Automation, 2018 to 2022

Figure 155: Oceania Market Volume (Units) Analysis by Automation, 2018 to 2033

Figure 156: Oceania Market Value Share (%) and BPS Analysis by Automation, 2023 to 2033

Figure 157: Oceania Market Y-o-Y Growth (%) Projections by Automation, 2023 to 2033

Figure 158: Oceania Market Value (US$ Million) Analysis by Meat Type, 2018 to 2022

Figure 159: Oceania Market Volume (Units) Analysis by Meat Type, 2018 to 2033

Figure 160: Oceania Market Value Share (%) and BPS Analysis by Meat Type, 2023 to 2033

Figure 161: Oceania Market Y-o-Y Growth (%) Projections by Meat Type, 2023 to 2033

Figure 162: Oceania Market Value (US$ Million) Analysis by Application, 2018 to 2022

Figure 163: Oceania Market Volume (Units) Analysis by Application, 2018 to 2033

Figure 164: Oceania Market Value Share (%) and BPS Analysis by Application, 2023 to 2033

Figure 165: Oceania Market Y-o-Y Growth (%) Projections by Application, 2023 to 2033

Figure 166: Oceania Market Attractiveness by Automation, 2023 to 2033

Figure 167: Oceania Market Attractiveness by Meat Type, 2023 to 2033

Figure 168: Oceania Market Attractiveness by Application, 2023 to 2033

Figure 169 Oceania Market Attractiveness by Country, 2023 to 2033

Figure 170: MEA Market Value (US$ Million) by Automation, 2023 to 2033

Figure 171: MEA Market Value (US$ Million) by Meat Type, 2023 to 2033

Figure 172: MEA Market Value (US$ Million) by Application, 2023 to 2033

Figure 173: MEA Market Value (US$ Million) by Country, 2023 to 2033

Figure 174: MEA Market Value (US$ Million) Analysis by Country, 2018 to 2022

Figure 175: MEA Market Volume (Units) Analysis by Country, 2018 to 2033

Figure 176: MEA Market Value Share (%) and BPS Analysis by Country, 2023 to 2033

Figure 177: MEA Market Y-o-Y Growth (%) Projections by Country, 2023 to 2033

Figure 178: MEA Market Value (US$ Million) Analysis by Automation, 2018 to 2022

Figure 179: MEA Market Volume (Units) Analysis by Automation, 2018 to 2033

Figure 180: MEA Market Value Share (%) and BPS Analysis by Automation, 2023 to 2033

Figure 181: MEA Market Y-o-Y Growth (%) Projections by Automation, 2023 to 2033

Figure 182: MEA Market Value (US$ Million) Analysis by Meat Type, 2018 to 2022

Figure 183: MEA Market Volume (Units) Analysis by Meat Type, 2018 to 2033

Figure 184: MEA Market Value Share (%) and BPS Analysis by Meat Type, 2023 to 2033

Figure 185: MEA Market Y-o-Y Growth (%) Projections by Meat Type, 2023 to 2033

Figure 186: MEA Market Value (US$ Million) Analysis by Application, 2018 to 2022

Figure 187: MEA Market Volume (Units) Analysis by Application, 2018 to 2033

Figure 188: MEA Market Value Share (%) and BPS Analysis by Application, 2023 to 2033

Figure 189: MEA Market Y-o-Y Growth (%) Projections by Application, 2023 to 2033

Figure 190: MEA Market Attractiveness by Automation, 2023 to 2033

Figure 191: MEA Market Attractiveness by Meat Type, 2023 to 2033

Figure 192: MEA Market Attractiveness by Application, 2023 to 2033

Figure 193 MEA Market Attractiveness by Country, 2023 to 2033

Explore Process Automation Insights

View Reports

Meat Dicing Machine Market