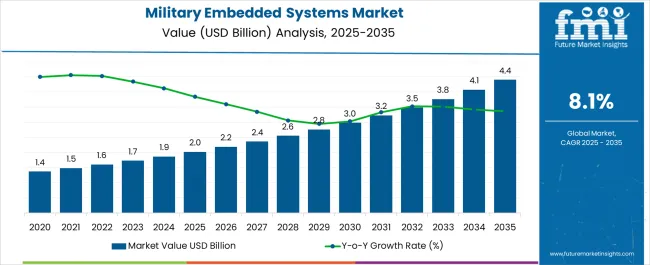
The Military Embedded Systems Market is estimated to be valued at USD 2.0 billion in 2025 and is projected to reach USD 4.4 billion by 2035, registering a compound annual growth rate (CAGR) of 8.1% over the forecast period.
| Metric | Value |
|---|---|
| Military Embedded Systems Market Estimated Value in (2025 E) | USD 2.0 billion |
| Military Embedded Systems Market Forecast Value in (2035 F) | USD 4.4 billion |
| Forecast CAGR (2025 to 2035) | 8.1% |
The military embedded systems market is witnessing steady growth driven by increasing defense modernization programs, advancements in autonomous platforms, and the rising need for real-time data processing and battlefield awareness. Government spending on upgrading legacy systems and integrating cutting-edge electronics in military vehicles, aircraft, and naval vessels is creating strong demand.
The focus on developing interoperable, rugged, and secure embedded solutions to support complex mission-critical applications is boosting adoption across various defense sectors. Additionally, the growth is supported by innovations in low-power consumption, miniaturization, and enhanced processing capabilities that improve operational efficiency.
The market outlook is positive, with future expansion expected through increased investments in unmanned systems and electronic warfare capabilities, aligned with evolving defense strategies worldwide..
The market is segmented by Component Type, Platform Type, and Application Type and region. By Component Type, the market is divided into Hardware and Software. In terms of Platform Type, the market is classified into Land, Airborne, Naval, Space, and Satellite. Based on Application Type, the market is segmented into Intelligence, Surveillance, And Reconnaissance (ISR), Command & Control, Communication & Navigation, Electronic Warfare (EW), Weapon And Fire Control, Wearable, and Others. Regionally, the market is classified into North America, Latin America, Western Europe, Eastern Europe, Balkan & Baltic Countries, Russia & Belarus, Central Asia, East Asia, South Asia & Pacific, and the Middle East & Africa.
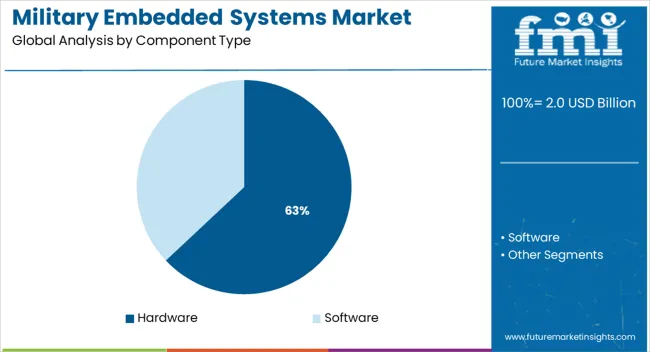
Hardware components are anticipated to hold 63.00% of the total revenue share in 2025, marking it as the leading segment. This dominance is driven by the critical role of robust and reliable hardware in military embedded systems, which must endure harsh environmental conditions while maintaining high performance.
The demand for advanced sensors, processors, memory modules, and communication interfaces that meet strict military standards is fueling this segment’s growth.
Hardware upgrades are essential for system longevity and adaptability to new defense technologies, reinforcing the segment’s leading position..
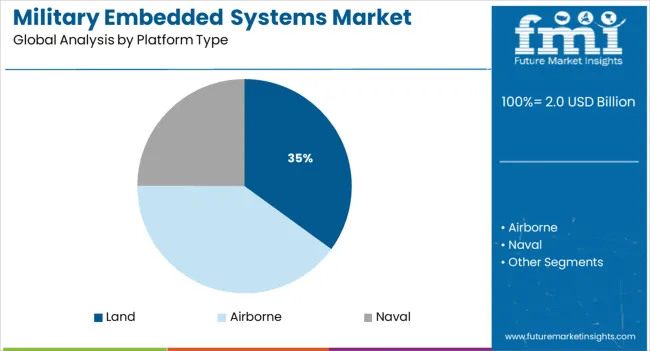
The land platform segment is projected to account for 35.00% of the overall market revenue in 2025, making it the foremost platform category. This growth is being facilitated by the modernization of armored vehicles, unmanned ground vehicles, and communication systems that require sophisticated embedded computing solutions.
The emphasis on improving situational awareness, command and control, and survivability on land-based missions is driving investments.
Enhanced processing power and integration capabilities of embedded systems support real-time data acquisition and processing critical to land operations..
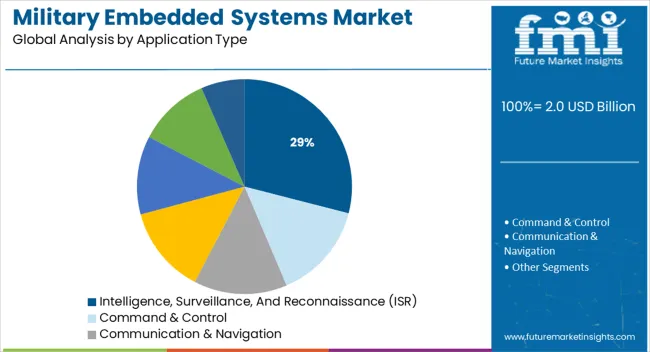
Intelligence, Surveillance, and Reconnaissance (ISR) applications are expected to contribute 29.00% of the total market revenue in 2025, emerging as the leading application segment. The rising importance of ISR for mission success has led to increased deployment of embedded systems in drones, sensor networks, and surveillance platforms.
Real-time data analytics, signal processing, and secure communication facilitated by embedded systems enhance operational decision-making and threat detection.
The segment’s growth is further backed by expanding global security challenges and technological advancements in sensor and imaging technologies..
During the projection period, technological development in military-embedded devices would have a significant positive impact on market growth. The scientific, research, and technology news website Phys.org claims that modern embedded systems are seldom made up of only one microcontroller.
They are instead made up of computer systems that have a variety of accelerators, processors, memory, peripherals, hardware, and networks. It gives military equipment both great performance and excellent efficiency. These embedded systems are a critical component of the control functions for military and defense equipment, according to the Linux Information Project (LINFO). During the projected period, rising military and defense spending as well as Research and Development in military equipment will significantly drive market expansion for military embedded systems.
During the projected period, the industry for military embedded systems would rise due to increased research and development in embedded platforms and System on Chip (SoC) design. Following the Open Innovations Framework Program (FRUCT), the Space wire standard ECSS-E-50-12A was created through cooperative relationships on a global scale under the European Space Agency initiative.
With specifications like dependability, low power consumption, small implementation in chips, EMC, etc., it strives to produce embedded system hardware. Additionally, industry expansion is supported by research and development in the domain of wireless communication technologies that help military communications (tactical communication).
For example, software-defined radio is a type of radio communication technology where software is used on a computer or embedded device to implement the various components rather than hardware. It provides secured wireless nodes that let various military gadgets connect in a secure setting. During the anticipated period, the industry for military embedded systems would expand due to its growth and increasing usage.
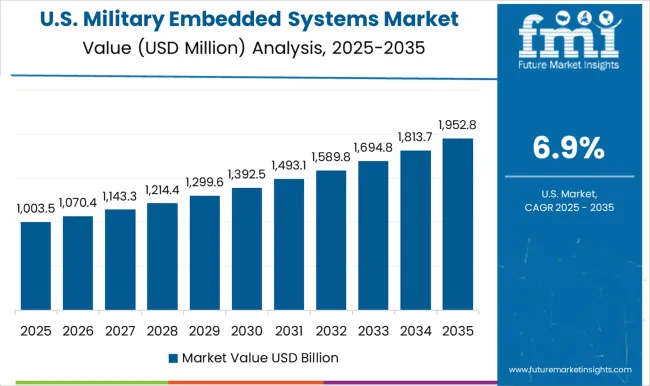
North America will probably continue to dominate the market for military-embedded systems over the projected period. The USA government's significant military spending is anticipated to make it easier for the USA defense industry to embrace military-embedded systems. The worldwide market for military embedded systems has been driven by the rising investment in structural arrangements, which raised money for purchasing defense equipment and cutting-edge military capabilities that utilize embedded systems.
The main drivers of the USA market's expansion are the USA government's provision of military assistance to nations like South Korea and Japan and the strict rules it has established to combat threats to domestic security. Thus, with such notable developments in this region, the demand for military-embedded systems will skyrocket in the near future.
Due to advances in embedded system technology, it is now feasible to use a single network to transfer data from numerous separate systems via a single cable.
Ethernet for these systems may transmit a wide range of data, including audio, video, and data from numerous sensors and applications, in industries such as aerospace and military.
A converged network is currently replacing many single-purpose connections, resulting in significant SWaP (size, weight, and power) savings and enhanced flexibility when adding new capabilities to a platform.
The size of embedded systems has shrunk dramatically as technology has advanced, allowing them to fit into a variety of portable platforms used in military applications. Their size is now inversely related to the number of applications they can run.
There is a rising need for competent developers with a variety of skill sets for the creation of such embedded systems. In embedded systems dealing with safety and security-oriented applications in military and aviation, code quality is also increasingly crucial.
Since most traditional radar systems employ set waveforms, they are simple to detect, learn about, and develop strategies against. The modern, digitally programmable radars, on the other hand, can produce never-before-seen waveforms, making them more difficult to defeat.
Military embedded systems market participants have the chance to create flexible and adaptable electronic warfare systems capable of detecting and countering modern sensors. They can also create electronic embedded systems for electronic warfare that can manufacture effective countermeasures in real-time against new, unknown, and adaptive radars on the battlefield.
The complexity of electronic system design has risen, as have the complications of embedded systems. As the need for embedded systems has grown, so has the complexity of electronic system design. In addition, a constant update is always necessary to meet the design criteria.
Keeping up with the shifting demand for military-embedded systems and technical changes has become a key problem for suppliers. Failure to do so may result in the cancellation of contracts and licenses. The main actors are doing everything they can to keep up with the demand for military-embedded systems.
According to the platform, the land sector is predicted to lead the military embedded systems market and will continue to lead. The military embedded systems market has been divided into four sections: land, airborne, naval, and space. During the projection period, the land segment is expected to hold the largest military-embedded systems market share.
The platform segment's rise may be linked to the increased need for surveillance activities as a result of geographical instability, as well as the development of complex electronic systems and mission-critical embedded technologies.
The harsh-environment embedded computer systems will assist the Army in increasing the usage of low-cost open standards-based commercial off-the-shelf (COTS) electronics in military ground vehicles.
Curtiss-Wright is supplying armoured combat vehicles applications such as command, control, communications, computers, intelligence, surveillance, and reconnaissance (C4ISR).
The military embedded systems market is classified as Intelligence, Surveillance & Reconnaissance (ISR), command & control, communication & navigation, electronic warfare, wearable, weapon & fire control, and others based on application.
The intelligence, surveillance, and reconnaissance (ISR) category is expected to lead the military embedded systems market in terms of application. The rising acquisition of innovative and high-tech surveillance and monitoring systems can be related to the segment's rise.
Due to increased demand for military-embedded systems with ISR capabilities, the Intelligence, Surveillance, and Reconnaissance (ISR) sector is predicted to be the fastest-growing segment in the military-embedded systems.
The defense sector is undergoing tremendous transitions, with military-embedded systems market participants making many technical breakthroughs to meet the changing demand for military-embedded systems
The blade server sector is expected to lead the military embedded systems market based on server architecture. This segment is expected to lead the military embedded systems market due to the increasing adoption of modern blade servers, particularly in the network-centric military and avionics applications that require high-end computing with more I/O than standard servers and have environmental requirements that exceed those of typical data centers.
ATCA is now being used in network-centric military and avionics applications such as radar/sonar systems, C4ISR, electronic warfare, naval tactical combat systems, C2, communications, and data center consolidation.
| Regions | CAGR (2025 to 2035) |
|---|---|
| United States of America | 7.6% |
| United Kingdom | 6.7% |
| China | 7.4% |
| Japan | 6.4% |
| South Korea | 5.1% |
North America is projected to maintain its advantage in the area. North America is predicted to dominate the military embedded systems market owing to increased investments in defense equipment and fighting capabilities, as well as the adoption of network-centric infrastructure.
The primary nations in this industry are the USA and Canada, with the USA leading the military-embedded systems market in North America. The USA is a technologically advanced country with enormous investment potential in military electronics.
North America is a primary distribution point for technologically advanced applications.
The USA is a technologically advanced country with enormous investment potential in embedded system technology. Increased expenditures in next-generation communication technologies and integrated warfare capabilities aided military embedded systems market expansion.
A few globally established firms lead the military embedded systems market, including Mercury Systems, Inc., Curtiss-Wright Corporation, Advantech Co., Ltd., SMART Embedded Computing, and Kontron AG.
Network intelligence applications are the major driver for ATCA product innovations, including 40G Ethernet fabrics, with associated payload blades based on either traditional packet processors, such as the Cavium Octeon II or Intel Xeon processors.
Recent Developments:
The global military embedded systems market is estimated to be valued at USD 2.0 billion in 2025.
The market size for the military embedded systems market is projected to reach USD 4.4 billion by 2035.
The military embedded systems market is expected to grow at a 8.1% CAGR between 2025 and 2035.
The key product types in military embedded systems market are hardware, _processor, _memory, _converter, _graphical processing unit (gpu), _others and software.
In terms of platform type, land segment to command 35.0% share in the military embedded systems market in 2025.


Full Research Suite comprises of:
Market outlook & trends analysis
Interviews & case studies
Strategic recommendations
Vendor profiles & capabilities analysis
5-year forecasts
8 regions and 60+ country-level data splits
Market segment data splits
12 months of continuous data updates
DELIVERED AS:
PDF EXCEL ONLINE
Military Test Equipment Market Size and Share Forecast Outlook 2025 to 2035
Military Textile Materials Testing Market Size and Share Forecast Outlook 2025 to 2035
Military Cyber Security Market Size and Share Forecast Outlook 2025 to 2035
Military Sensor Market Size and Share Forecast Outlook 2025 to 2035
Military Displays Market Size and Share Forecast Outlook 2025 to 2035
Military and Defense Ground Support Equipment Market Size and Share Forecast Outlook 2025 to 2035
Military Radar Market Size and Share Forecast Outlook 2025 to 2035
Military Microgrid Market Size and Share Forecast Outlook 2025 to 2035
Military Cloud Computing Market Size and Share Forecast Outlook 2025 to 2035
Military Vehicle Electrification Market Size and Share Forecast Outlook 2025 to 2035
Military Wearables Market Size and Share Forecast Outlook 2025 to 2035
Military Trucks Market Size and Share Forecast Outlook 2025 to 2035
Military Robots Market Size and Share Forecast Outlook 2025 to 2035
Military Logistics Market Size and Share Forecast Outlook 2025 to 2035
Military Lighting Market Size and Share Forecast Outlook 2025 to 2035
Military Biometrics Market Size and Share Forecast Outlook 2025 to 2035
Military Vehicles and Aircraft Simulations Market Growth - Trends & Forecast 2025 to 2035
Military Hydration Products Market Growth - Trends & Forecast 2025 to 2035
Military Batteries Market Analysis & Forecast by Platform, Capacity, Type, End-Use and Region through 2025 to 2035
Military Communications Market Analysis by Component, Application, End User & Region from 2025 to 2035

Thank you!
You will receive an email from our Business Development Manager. Please be sure to check your SPAM/JUNK folder too.
Chat With
MaRIA