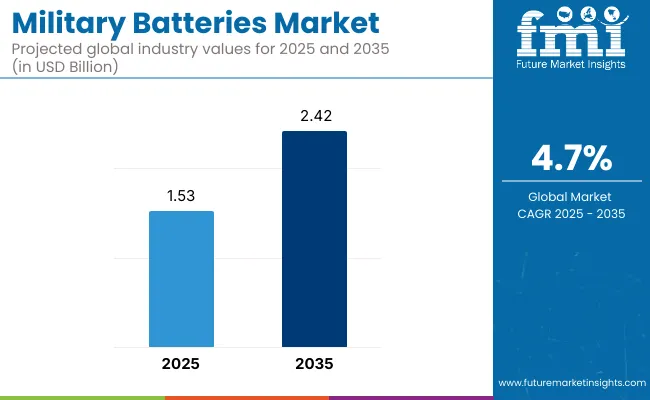
The Military Batteries Market is valued at USD 1.53 billion in 2025. As per FMI's analysis, the industry will grow at a CAGR of 4.7% and reach USD 2.42 billion by 2035. The military batteries also known as defence grade power systems industry is at a consistent rate of growth in 2024, primarily due to increasing defence budgets and technological advances in energy storage.

Lithium-ion batteries gained traction due to their higher energy density and longer life cycles, and defence agencies-especially large ones-used them in unmanned aerial vehicles, communication systems, and armored vehicles, according to FMI research. Governments invested more in indigenous battery production to mitigate supply chain risks caused by limited raw materials.
Demand for high-performance battery systems was driven by increased orders for hybrid-electric military vehicles, according to FMI. The year also saw advances in thermal management of battery packs that led to improved performance in demanding conditions. Partnerships between defence contractors and battery producers intensified, focusing on next-generation energy solutions.
According to FMI Research, advancements in solid-state and graphene battery development in 2025 will enhance power efficiency and operational life. AI-based battery diagnostics will enhance real-time monitoring and reduce maintenance downtime. By 2035, modular and swappable battery packs for flexible deployment across military platforms will increasingly be used by defence forces.
The military batteries industry is expected to grow in the long term, driven by increasing defence budgets, growing demand for high-performance energy storage, and technological developments in lithium-ion and solid-state technologies. According to analysis by FMI, one key beneficiary of the trend might be defence agencies and producers of military equipment due to improvements in battery efficiency, while legacy battery suppliers that use older chemistries may struggle to stay afloat. FMI believes that continued investment in next-generation energy offerings that will transform battlefield power capabilities, including modular and artificial intelligence-integrated battery systems that will be the industry standard.
Accelerate Investment in New Generation Battery Technologies
Executives should prioritize R&D on solid-state, graphene-based, and AI-integrated batteries, as they are at the forefront of these higher energy density, more longevity, and more flexible battery solutions for novel military applications. Investing in proprietary battery chemistries will build competitive differentiation and win long-term contracts with defence agencies.
Accommodate Shifting Towards Electrification and Smart Energy Systems
As hybrid-electric and AI-based defence systems become more common, businesses must adapt by developing high-volume, modular battery packs that support real-time monitoring of cell states and predictive maintenance analytics. Building relationships with military vehicle-and-drone makers will no doubt be vital in locking in long-term supply agreements.
Expand Strategic Supply Chain Partnerships to Mitigate Risk
Reducing dependence on volatile global supply chains will require a concerted effort from executives to focus on securing raw material sources through vertical integration, local partnerships, and alternative material development. Strengthening its relations with state-backed energy schemes and national defence purchasing programs will guarantee revenue growth and industry leadership.
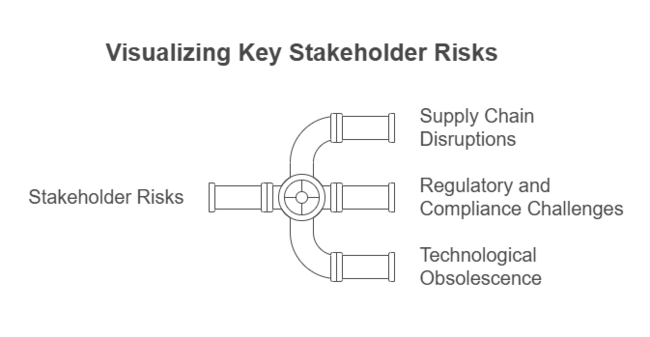
| Risk | Probability & Impact |
|---|---|
| Supply Chain Disruptions | High Probability - High Impact |
| Regulatory and Compliance Challenges | Medium Probability - High Impact |
| Technological Obsolescence | Medium Probability - Medium Impact |

| Priority | Immediate Action |
|---|---|
| Advanced Battery Development | Accelerate R&D on solid-state and graphene-based batteries |
| Supply Chain Resilience | Secure alternative raw material sources and strengthen regional partnerships |
| Military Electrification Alignment | Establish an OEM feedback loop to assess hybrid and AI-integrated battery demand |
To stay ahead companies must act decisively by rapidly investing in energy storage systems of the next generation and securing long-term supply chain stability. FMI analysis projects that electrification and AI-based energy management investments will shift procurement priorities toward modular and high-efficiency battery packs.
Leadership groups must prioritize R&D investments, form strategic partnerships with OEMs and defence agencies, and pursue vertical integration opportunities to mitigate geopolitical and material sourcing risks, according to FMI. Companies standing in front of these changes and actively responding will position themselves to gain industry leadership and negotiate for optimized defence contract opportunities in the next ten years.
Energy density and lifespan were the No. 1 concern for 85% of stakeholders according to FMI research, as current defence applications demand longer-lasting and more power-efficient batteries. Supply chain security was called one of the “most critical” issues by 78%, driven largely by the concern of US and European defence agencies facing geopolitical threats.
Regional Variance:
High Variance:
Divergent ROI Views:
FMI reports that lithium, which was chosen for its energy density, weight, and durability, was the most prevalent chemistry by 68 percent of the stakeholders.
Regional Variance:
Shared Challenges:
Regional Differences:
Manufacturers:
Procurement Officials:
Alignment:
According to FMI analysis, 77% of manufacturers planned to invest in AI-based battery diagnostics and energy management systems by 2026.
Divergence:
High Consensus:
Key Variances:
Strategic Insight:
The defence sector maximization may not be forced-the one-size-fits-all model does not apply; manufacturers must best match offers with the region’s priorities: solid-state technologies in the US, eco-friendly technologies in Europe, and price-friendly hybrid solutions for Asia-Pacific.
| Country | Regulatory Impact & Mandatory Certifications |
|---|---|
| United States | The Inflation Reduction Act (IRA) encourages US battery manufacturing, providing tax credits for domestically produced lithium-ion batteries. Military battery vendors are required to meet DoD MIL-PRF-32565 for lithium-ion safety and National Defence Authorization Act (NDAA) Section 889 limitations on foreign-made components. |
| United Kingdom | The UK Defence Standard DEF STAN 61-21 requires tough safety testing for military batteries. The Ministry of Defence (MoD) also demands meeting NATO STANAG 4370 for environmental tests. |
| France | Complies with EU Battery Regulation 2023/1542, with lifecycle traceability and carbon footprint reporting. NF-EN 60086 requirements for electrochemical safety must be met by military battery suppliers. |
| Germany | Defence battery producers need to abide by Bundeswehr TL 6145-002, establishing endurance and energy density standards. Germany complies with EU REACH and WEEE regulations for control of hazardous substances and recycling batteries. |
| Italy | The Italian Ministry of Defence imposes UNI CEI EN 62133, which governs lithium-ion safety regulations. Italy complies with EU Battery Passport provisions for supply chain traceability. |
| South Korea | Compliant with the Korean Battery Safety Act, requiring strict tests on thermal stability and overcharge protection. All defence battery products must carry the KC (Korea Certification) mark. |
| Japan | Governed by the Japan Industrial Standards (JIS C 8712) for military rechargeable batteries. Domestic testing of imported cells is required by the METI (Ministry of Economy, Trade, and Industry). |
| China | Compliant with the GB/T 31241-2022 military lithium-ion battery standard. CCC certification is required for large defence orders by companies. |
| Australia & New Zealand | Suppliers of defence grade power systems have to adhere to AS/NZS 60086 safety standards and Australian Defence Standard DEF(AUST)1000C for performance standards. |
| India | The Defence Procurement Procedure (DPP) requires local procurement under the Make in India initiative, with locally manufactured battery parts being preferred. Lithium-ion safety is regulated by the Bureau of Indian Standards (IS 16046). |

The United States military batteries industry is expected to register steady growth during the forecast period owing to increasing defence expenditure and government incentives for domestic production in the Inflation Reduction Act (IRA) and the National Defence Authorization Act (NDAA).
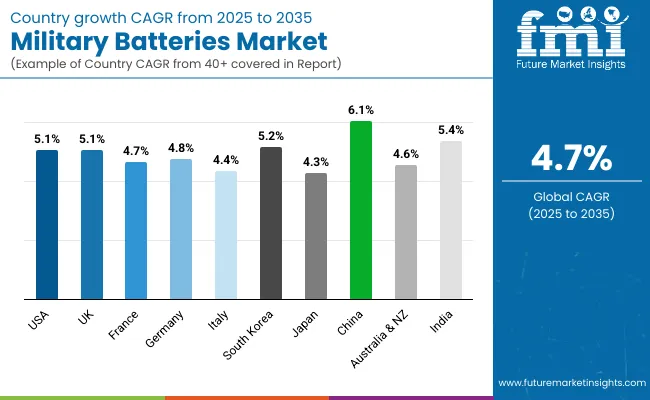
The Executive Order on Sustainable Batteries (14057) is also driving purchasing trends, and the importance of continued DoD MIL-PRF-32565 compliance remains relevant as new battery recycling programs become available. Nevertheless, supply chain features and raw material weaknesses result in a challenge, though stimulating companies' dependence on local supply and future-proof energy storage technology. The predicted CAGR of the USA industry from 2025 to 2035 is 5.1%.
As the MoD invests in advanced soldier systems and energy resilience capabilities, the UK military batteries industry continues to evolve. Compliance with DEF STAN 61-21 and NATO STANAG 4370 is still an important factor. The Net Zero Defence Strategy 2050 is driving the demand for sustainable, high energy density batteries.
Looking for land and naval applications, the UK focuses on lithium-ion and hybrid battery systems. Supply chain disruptions linked to Brexit have increased procurement costs for UK defence manufacturers. Companies investing in domestic production and advanced battery chemistries will have multiyear defence contracts. The predicted CAGR of the UK’s industry from 2025 to 2035 is 5.1%.
EU Battery Regulation 2023/1542 and NF-EN 60086 safety requirements will significantly influence the growth of France’s military batteries industry. The French Ministry of Armed Forces is investing in battery-based energy solutions for infantry, next-gen fighter jets, and naval vehicle high-capacity storage.
European nations vaunted efforts of indigenization in defence are now forcing collaboration with local battery manufacturers. The country is also increasing investment in battery recycling and life-cycle management. However, competition from German and Italian industry is a challenge. The CAGR for the France’s industry from 2025 to 2035 is forecast at 4.7%.
The German military batteries industry has been driven by the Bundeswehr's push towards electrification of armored vehicles and soldier-portable systems. Strict adherence to TL 6145-002 ensures high safety and performance of the plate. At the same time, alignment with laws such as EU REACH and WEEE is encouraging the government towards sustainable battery innovations. However, high material costs and reliance on Asian battery materials pose hurdles for manufacturers. Between 2025 and 2035, the CAGR of the German industry is 4.8%.
With a focus on militarized electrification and autonomous defence systems, the Italian Ministry of Defence is driving steady growth in the country's military batteries industry. The demand for UNI CEI EN 62133 and EU Battery Passport compliance.
The Russian energy and defence companies are heavily investing in hybrid batteries for the naval and aerospace industries. But reliance on imported raw materials and competition from France and Germany pose challenges. The Italian industry is expected to record a CAGR of 4.4% during the forecast period.
South Korea's military batteries industry is emerging robustly, alongside rising government initiatives for next-gen lithium-based battery & solid-state battery R&D under the Defence Reform 4.0. Specifications adherence to K-MIL-PRF standards are driving battery design in unmanned aerial vehicles (UAVs) and electric combat vehicles.
Another thrust area for South Korea is localization of the supply chain to reduce dependence on Chinese raw materials. Yet, high R&D costs and a lack of local raw material sources remain significant challenges. The South Korea military batteries industry is projected to record a CAGR of 5.2% from 2025 to 2035.
The defence battery industry in Japan is increasing steadily with the government placing an emphasis on power-saving soldier equipment and electric warfare systems in the Defence Buildup Program 2023. Naval and aero applications are already funded for high-density sodium-ion and lithium-ion batteries, aiming at prolonged operational longevity.
Local battery companies should comply with the requirements referred to in JIS C 8712. But Japan suffers from high production costs and a focus on keeping military-grade batteries from being exported. Japan's industry CAGR is estimated at 4.3% from 2025 to 2035.
With the People's Liberation Army modernization programs and the country's leading position in the production of lithium-ion batteries, China is the fastest-growing industry for military batteries. Touted programs like Made in China 2025 have made the country a front-runner for R&D on solid-state and lithium-sulfur batteries to use in armored vehicles and the navy.
Battery performance and safety are regulated by stringent military standards such as GB/T 18287. Geopolitics and trade barriers limit exports, though, and domestic companies stress self-sufficiency. The China military batteries industry will expand at a CAGR of 6.1% between 2025 and 2035.
The Australia & New Zealand Military Batteries Industry is Driven by Emphasis to Keep Defence Batteries Energy-Dense and Battle-Hardened Due to Modernization Plans ADF focuses on next-gen combat platforms using electric propulsion and soldier-worn batteries.
For indigenous battery vendors, compliance with AS/NZS IEC 62133 is critical. However, reliance on imported lithium-ion cells and high production costs limit growth. The Australia & New Zealand defence grade power systems industry CAGR is estimated to be 4.6% from 2025 to 2035.
Government support for local manufacturing under "Make in India" and "Atmanirbhar Bharat" (Self-Reliant India) is driving segment growth. DRDO is indigenously producing lithium-ion batteries for UAVs, submarines, and electric warfighting vehicles. ISO 16046-2:2018 compliance ensures strict battery safety norms.
Indigenous battery manufacturing is being encouraged through rising defence budgets and partnerships with local manufacturers. However, domestic lithium reserves are scarce, and they are heavily reliant on imports. The Indian military batteries industry in terms of CAGR is expected to grow at 5.4% over the period of 2025 to 2035.
The prominent segment is rechargeable military batteries, driven by innovations in lithium-ion and solid-state battery technologies. The rising need for energy-efficient & long-lived energy sources in warfare platforms like soldier systems, UAVs, & electric battle vehicles has served as a key driver for the dominance of rechargeable batteries. Governments encourage sustainable solutions, and strict military standards have accelerated widespread adoption.
Lithium-sulfur rechargeable batteries are the fastest-growing segment due to their higher energy density with lighter weight and thus are more suitable for aviation and soldier-borne applications. In contrast, non-rechargeable batteries still play a vital role in mission-critical scenarios requiring high-speed power turnover, particularly in field operations and in expendable electronic warfare systems.
However, the shift toward rechargeable sources with long lives, coupled with the improvement of the laws on recycling batteries, has been putting a brake on the dependency on disposable batteries. Advances toward nanomaterial-based anodes and high-energy-density cathodes are expected are expected to drive strong growth in the rechargeable military batteries industry in the years to follow.
The ground military batteries lead the industry, driven by the demand for armored tanks, electronic warfare equipment, and field power supplies for soldiers. With the electrification of combat platforms, lithium-ion and hybrid battery packs are now part of standard issue for modern land forces. The fast adoption of electric combat vehicles, along with smart soldier systems that need lightweight and durable energy systems, ensures persistent development. Aviation is, however, the fastest-growing industry, largely fueled by the increasing demand for lightweight, high-capacity batteries for UAVs and for next-generation fighter jets.
Air vehicles rely on high-energy-density batteries for powering on-board systems, emergency backup power, and electronic warfare. Marine-while important-is more slow growth, though lithium-ion batteries are seeing strong adoption in submarines. Naval defence systems integrating fuel cells and hybrid energy storage are growing; however, endurance in the deep seas and regulatory approvals remain challenges to fast growth compared with aviation and ground-up platforms.
High-capacity batteries rated at over 24V make up the largest segment, largely due to their widespread use in heavy-duty military engagements, including armored vehicles, radar units, and ships. These batteries power advanced electronic systems and energy-hungry combat vehicles and so are a necessity for modern defence activities.
However, the 12V to 24V industry is the fastest-growing segment, fueled mainly by applications such as soldier-worn equipment, UAVs, and tactical communication units. This category growth is driven by the increasing demand for weight-critical high-powered energy solutions for infantry and small defence systems.
Batteries below 12V are still used in night vision goggles, medical field use, and sensor-based monitoring devices, but new applications here are much slower compared to ultra-high-capacity solutions. Military battery technology for ultra-high capacity will see increased investments in the coming years as defence forces focus more on ensuring longer operational life and reduced need for frequent recharging.
The compelling revenue segment of the OEM (Original Equipment Manufacturer) industry due to defence contracts for new military vehicles, planes, and ships means that advanced battery solutions are to be implemented at the point of manufacture. In modern warfare systems, which cover the entire spectrum from non-contact operations to long-term combat operations, governments are progressively insisting that new battery technologies should be integrated into combat systems during the design stage, enabling non-disrupted energy control.
Aftermarket is the fastest-growing segment, owing to an increase in the demand for battery replacement, upgrades, and retrofits for aging military equipment. Because military assets operate over extended lifespans, battery modernization programs have become a strategic necessity.
The aftermarket segment also stimulated from the growing adoption of modular battery packs, which can be exchanged and enhanced for particular missions. Moreover, the aftermarket segment is improving with the introduction of battery maintenance solutions, advanced diagnostics, and predictive analytics.

The leading military battery manufacturers compete in terms of pricing decisions, technological innovation, strategic collaborations, and regional expansion. Energy density, lightweight design, and long cycle life are key factors driving defence contracts.
Companies are focusing on lithium-sulfur or solid-state batteries in order to differentiate, as doing so helps in forming collaboration with defence agencies or OEMs in providing niche offers, which leads to the utilization of defence companies' resources and positioning them to win the industry.
A key growth strategy is expansion into new defence industries, particularly in Asia-Pacific and the Middle East. Companies are also investing in vertical integration to secure supply chains. Mergers and acquisitions are increasing as companies pool expertise in battery chemistry, energy storage, and power management for next-generation military applications.
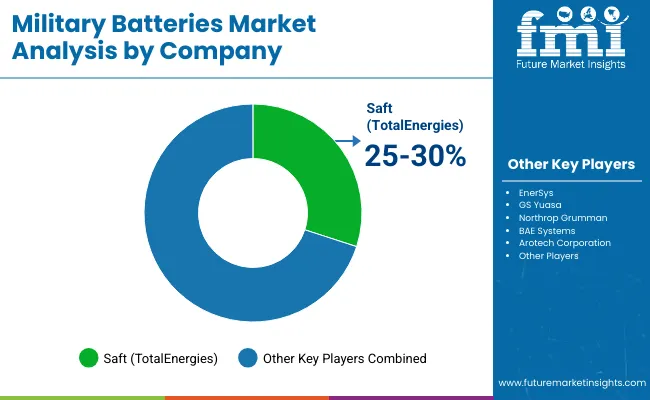
Saft (TotalEnergies)
Industry Share: ~25-30%
Leading specialist in advanced military batteries, providing lithium-ion and nickel-based solutions for defence applications. Saft interjects its role with future contracts with NATO and other defence entities.
EnerSys
Industry Share: ~20-25%
A major provider of ruggedized batteries for military vehicles, submarines, and aerospace. Uses its Odyssey and Hawker brands to win USA Department of Defence contracts.
GS Yuasa
Industry Share: ~15-20%
A big Japanese manufacturer providing high energy density lithium-ion batteries for use in defence applications, including submarines and unmanned systems. GS Yuasa has solid partners at home and abroad.
Northrop Grumman
Industry Share: ~10-15%
Northrop Grumman, primarily known for defence technologies, also develops high-tech batteries for UAVs and space applications, integrating energy storage into its broader defence portfolio.
BAE Systems
Industry Share: ~5-10%
Provides hybrid power and energy storage systems for military vehicles with a focus on military applications electrification and sustainability.
Arotech Corporation
Industry Share: ~5-10%
The company provides advanced battery and power management systems for various defence platforms, including soldier-worn systems, unmanned aerial vehicles (UAVs), ground vehicles, and naval applications. Arotech has a strong history of securing contracts with the USA Department of Defence (DOD) and allied defence agencies, positioning itself as a key player in the military battery industry.
The industry is segmented into land, marine and aviation.
It is segmented into below 12V, 12 to 24V and above 24V.
It is bifurcated into rechargeable and non-rechargeable.
It is segmented into OEM and aftermarket.
The industry is fragmented among North America, Latin America, Western Europe, Eastern Europe, East Asia, South Asia and Pacific, Middle East and Africa.
They are being driven by increased defence spending, the electrification of combat vehicles, and the development of energy storage technologies.
They offer better toughness, temperature resistance, and energy density to meet demanding defence requirements.
The most promising technologies are lithium-sulfur and solid-state batteries, which offer high energy efficiency and a lightweight profile.
Companies are investing in domestic manufacturing, securing raw material supplies, and forming strategic alliances to reduce import reliance.
Design, functionality, and procurement decisions concerning defence units worldwide are also governed by strict military requirements and safety standards.


Full Research Suite comprises of:
Market outlook & trends analysis
Interviews & case studies
Strategic recommendations
Vendor profiles & capabilities analysis
5-year forecasts
8 regions and 60+ country-level data splits
Market segment data splits
12 months of continuous data updates
DELIVERED AS:
PDF EXCEL ONLINE
Military Test Equipment Market Size and Share Forecast Outlook 2025 to 2035
Military Textile Materials Testing Market Size and Share Forecast Outlook 2025 to 2035
Military Cyber Security Market Size and Share Forecast Outlook 2025 to 2035
Military Sensor Market Size and Share Forecast Outlook 2025 to 2035
Military Displays Market Size and Share Forecast Outlook 2025 to 2035
Military and Defense Ground Support Equipment Market Size and Share Forecast Outlook 2025 to 2035
Military Radar Market Size and Share Forecast Outlook 2025 to 2035
Military Microgrid Market Size and Share Forecast Outlook 2025 to 2035
Military Cloud Computing Market Size and Share Forecast Outlook 2025 to 2035
Military Vehicle Electrification Market Size and Share Forecast Outlook 2025 to 2035
Military Wearables Market Size and Share Forecast Outlook 2025 to 2035
Military Trucks Market Size and Share Forecast Outlook 2025 to 2035
Military Robots Market Size and Share Forecast Outlook 2025 to 2035
Military Embedded Systems Market Size and Share Forecast Outlook 2025 to 2035
Military Logistics Market Size and Share Forecast Outlook 2025 to 2035
Military Lighting Market Size and Share Forecast Outlook 2025 to 2035
Military Biometrics Market Size and Share Forecast Outlook 2025 to 2035
Military Electro-Optics Infrared (EO/IR) Systems Market Report – Growth & Trends 2025 to 2035
Military Hydration Products Market Growth - Trends & Forecast 2025 to 2035
Military Vehicles and Aircraft Simulations Market Growth - Trends & Forecast 2025 to 2035

Thank you!
You will receive an email from our Business Development Manager. Please be sure to check your SPAM/JUNK folder too.
Chat With
MaRIA