The military vehicles and aircraft simulations market is experiencing robust growth due to rising investments in defense modernization and training programs. Governments worldwide are prioritizing advanced simulation technologies to enhance the operational preparedness and safety of military personnel. These simulations provide cost-effective, risk-free environments for practicing complex combat scenarios, vehicle operations, and aircraft maneuvers.
The increased adoption of virtual reality (VR), augmented reality (AR), and artificial intelligence (AI) in simulation systems is elevating training realism and effectiveness. With growing geopolitical tensions and the emphasis on military readiness, the demand for cutting-edge simulation solutions is steadily increasing.
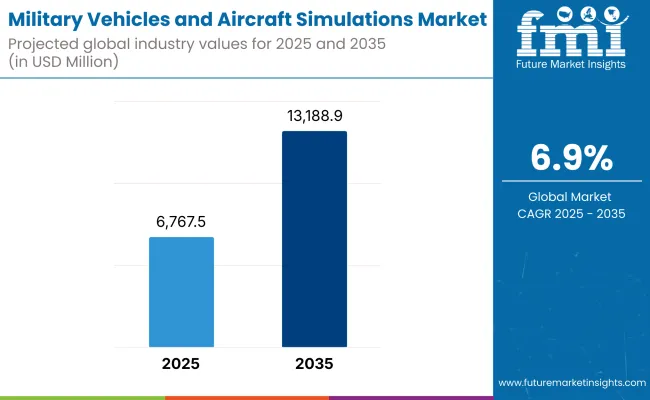
In 2025, the market size for military vehicles and aircraft simulations is estimated at approximately USD 6,767.5 million. By 2035, it is projected to reach USD 13,188.9 million, expanding at a compound annual growth rate (CAGR) of 6.9%. This growth is fueled by technological advancements, such as AI-driven scenario generation, enhanced graphics engines, and integration of IoT sensors into simulation platforms.
Metric | Value |
---|---|
Market Size in 2025 | USD 6,767.5 Million |
Projected Market Size in 2035 | USD 13,188.9 Million |
CAGR (2025 to 2035) | 6.9% |
Defense agencies are focusing on upgrading their simulation infrastructures to mirror real-world complexities, thereby boosting demand. Additionally, collaborative training exercises between allied nations are increasing the need for interoperable and scalable simulation systems that can adapt to multi-domain operations.
Type | Market Share (2025) |
---|---|
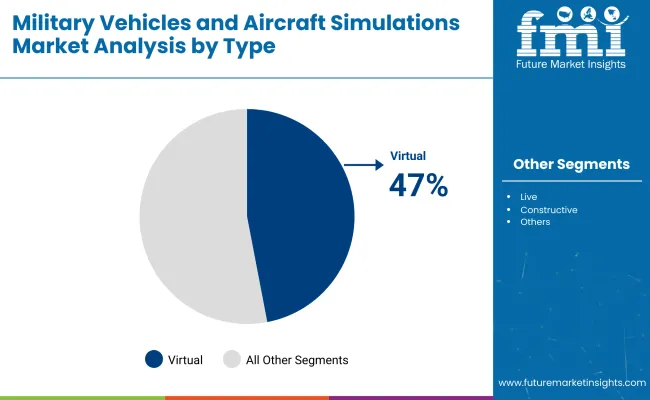
Virtual | 47% |
Demand for virtual simulation dominates the market, with nearly half of the demand for across the globe. Virtual simulations provide high-fidelity, immersive training environments that closely reproduce a variety of combat, tactical, and operational scenarios.
They allow defense forces to train for complex missions in secure, controlled environments, without the high logistical costs, safety risks or environmental footprints of conventional, live field exercises. With the support of advanced technologies like artificial intelligence (AI), machine learning (ML), augmented reality (AR), and virtual reality (VR), modern virtual simulations offer highly immersive and responsive environments.
Such technologies enable the tailoring of training programs, delivery of real-time feedback and the simulation of unpredictable combat situations that can assist soldiers in developing critical thinking, adaptability and strategic planning skills.
In addition, virtual simulations are scalable and facilitate multi-domain training that enables the training of participants from different branches land, air and naval as well as cyber which can team up to engage in synchronized missions. Such interconnectivity enhances joint operation readiness preparations while also making faultless communication, as well as collaboration between teams under pressure, that much easier.
Another advantage is the potential to quickly update scenarios for contemporary threats or geopolitical changes, keeping forces ready for modern challenges like cyber warfare, urban combat, and counterinsurgency operations. Cost-effectiveness is a key motivation for the move to virtual simulation, with significant savings on both fuel, ammunition, maintenance, and fielding to have a real effect on training outcomes.
It also contributes to the zero environmental impact in training, responding to the broader sustainability goals of multiple defense organizations around the globe. As global defense concepts of operations evolve and move towards preparing for technology-enabled military readiness, adaptive training responses, and net-centric warfare, the requirement for advanced virtual simulation solutions continue to accelerate. AI-driven adaptive learning paths, wearable simulation suits, full-body motion tracking, all incorporated to further the realism and effectiveness of such systems, have become a bedrock in military training infrastructure today.
Application | Market Share (2025) |
---|---|
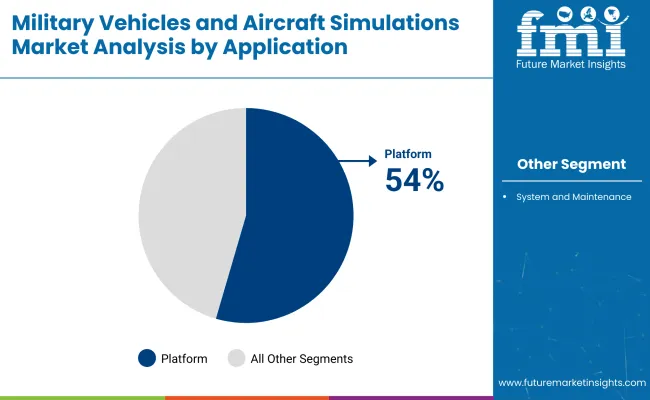
Platform | 54% |
Due to the importance of vehicle, aircraft, naval, and weapon platform-specific trainings to modern military forces, platform application segment accounts for the larger market share in this segment. In the complex operational environment of today, learning the particulars of a given platform from a next-generation fighter to an armored vehicle to a missile system translates directly to mission effectiveness and operational safety. An advanced simulation-based training platform delivers some of the most realistic, scenario-based experiences available, closely approximating how systems will operate, malfunction, and perform in combat scenarios.
Such fidelity empowers personnel to attain technical proficiency, rapidly acclimate to equipment upgrades and improve their tactical decision-making in a controlled pressurized environment. Platform-specific training, in addition, can help maintenance crews and technical personnel get practice with problem-solving and managing systems without risking a live system.
The increasing need for multi-domain operations and network-centric warfare only adds to the necessity of having platform simulations for air, land, sea, space and cyber that can be interoperable. Simulation platforms leverage real-time data analytics, artificial intelligence-driven threat generation and virtualized environments to prepare forces for rapidly changing battlefield scenarios.
Additionally, the objective of the cost-efficient and sustainable implementation of defense solutions has also pushed the militaries to invest more in platform simulators, since they significantly minimize wear and tear on costly equipment and lower fuel and munitions expenditure during training.
With global defense modernization initiatives gaining momentum - in particular, in North America, Europe and Asia-Pacific - the platform application segment is expected to grow considerably, further solidifying its position as the largest segment in the military simulation & virtual training market.
High Initial Investment and Technology Complexity
Advanced simulation systems for military vehicles and aircraft require investments of significant financial and elite expertise. Simulators that employ technologies such as AI, the VR, and the haptics are among the most advanced in the world, requiring high levels of complexity to ensure their design, production, and upkeep.
Defense agencies in developing countries may face budgetary constraints thus limiting the growth of the market. Also, developments of ultra-realistic training environments have technical challenges which need continued R&D investment.
Cybersecurity Threats and Data Integrity Risks
Military simulations are increasingly digital and networked; the potential for cyberattacks, data breaches and the sabotage of systems is significant. A key concern is to ensure the security of simulation data which often contains sensitive information that could be harmful if disclosed. In order to maintain trust with their defense clients and protect vital national security interests, companies are required to make significant investments in cybersecurity controls, encryption technologies, and secure network architectures.
Rising Demand for Cost-Effective and Safe Training Solutions
Simulation as a facilitator for dealing with dangers and expenses of live training exercises. The world's defense forces are implementing simulations to train personnel on complex maneuvers without wasting real assets including fuel, ammunition and aircraft time. And this trend is creating significant opportunities for manufacturers of fully immersive and modular training systems designed for the unique needs of a given military service.
Integration of Next-Generation Technologies (AI, VR, AR)
Simulators are undergoing a revolution in the market with the integration of Artificial Intelligence, Virtual Reality, Augmented Reality, and Machine Learning. Next-gen simulations can adapt dynamically based on how trainees are performing, create hyper-realistic environments, and replicate complex battlefield conditions in real-time. Businesses that use these technologies to increase realism, lower costs, and improve training performance stand to grow significantly.
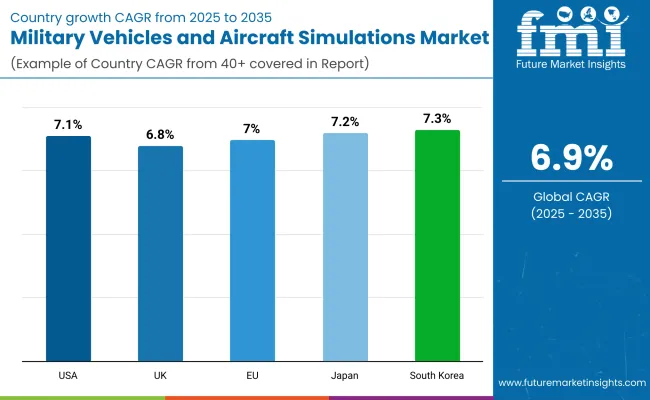
The United States dominates the Military vehicles and aircraft simulations market due to its significant defense budget and focus on next-generation training technologies. The USA Department of Defense actively invests in simulation-based training to enhance combat readiness and reduce operational costs. Advancements in VR (Virtual Reality), AR (Augmented Reality), and AI-driven simulators are fueling innovation.
Additionally, increasing reliance on unmanned systems requires sophisticated simulation programs for both manned and unmanned platforms. Collaboration between defense contractors and tech firms is expanding the market scope, while modernizing pilot and crew training continues to be a primary focus.
Country | CAGR (2025 to 2035) |
---|---|
USA | 7.1% |
The United Kingdom is witnessing strong growth in the Military Vehicles and Aircraft Simulations market, supported by its Future Combat Air System (FCAS) program and ongoing investments in military modernization. British defense forces are increasingly adopting advanced simulators to train pilots and vehicle operators more cost-effectively.
The rising emphasis on reducing training risks and enhancing mission preparedness is pushing demand for immersive simulation solutions. Additionally, public-private partnerships in defense technology development are strengthening the country's position in simulation training technologies for land and air platforms.
Country | CAGR (2025 to 2035) |
---|---|
UK | 6.8% |
Across the European Union, the Military vehicles and aircraft simulations market is gaining momentum as countries seek cost-effective and high-fidelity training solutions. Nations like Germany, France, and Italy are heavily investing in simulation technologies to maintain force readiness amid evolving security threats.
The European Defense Fund (EDF) and collaborative defense programs are accelerating the integration of AI, VR, and cloud-based simulations. The need for interoperability among allied forces is further encouraging the adoption of standardized simulation systems for both ground vehicles and aircraft across the region.
Country | CAGR (2025 to 2035) |
---|---|
European Union (EU) | 7.0% |
Japan’s Military vehicles and aircraft simulations market is expanding rapidly, driven by the nation’s ongoing defense modernization efforts. Rising regional tensions and a strategic push to bolster air and ground forces are prompting investment in simulation-based training.
Japan’s Ministry of Defense is increasingly adopting advanced simulation platforms to improve the capabilities of both Self-Defense Forces and joint operations with allied nations. Emphasis on integrating AI and big data analytics into simulators enhances training realism, while partnerships with domestic tech firms are strengthening simulation innovation.
Country | CAGR (2025 to 2035) |
---|---|
Japan | 7.2% |
South Korea is experiencing strong growth in the Military Vehicles and Aircraft Simulations market, driven by a growing need for readiness amid evolving security dynamics on the Korean peninsula. The South Korean military actively adopts simulation systems for aircraft, armored vehicles, and unmanned systems training.
Government initiatives to modernize armed forces and enhance joint training exercises with allied countries are boosting the adoption of advanced simulation platforms. Additionally, the domestic development of indigenous simulation technologies is positioning South Korea as a key player in regional defense training innovation.
Country | CAGR (2025 to 2035) |
---|---|
South Korea | 7.3% |
The military vehicles and aircraft simulations market is experiencing significant growth due to the rising emphasis on cost-effective, safe, and realistic training environments. Simulators reduce operational costs, minimize accident risks during training, and extend the lifespan of real vehicles and aircraft by limiting their use in training missions.
Technological advances such as VR (Virtual Reality), AR (Augmented Reality), and AI-based adaptive learning are also revolutionizing simulation capabilities. As global defense budgets rise and militaries prioritize modernization, demand for highly sophisticated simulation technologies that replicate real battlefield conditions is soaring, particularly in North America, Europe, and parts of Asia-Pacific.
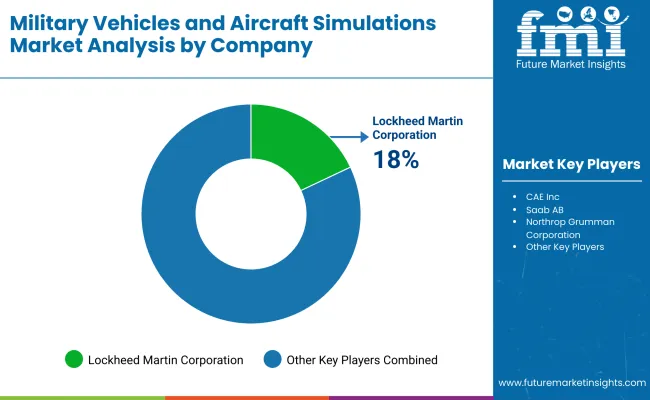
Lockheed Martin Corporation (18 to 20%)
Lockheed Martin holds a dominant share of the market, fueled by its extensive experience in simulation systems for advanced aircraft such as the F-35 Lightning II. The company’s integration of AI-based threat modeling and real-time battlefield updates into simulators sets a new benchmark for realism.
Strategic collaborations with government agencies and militaries worldwide ensure consistent revenue streams. Lockheed’s aggressive R&D investments in immersive simulation technologies are expected to keep it at the forefront of the defense simulation industry throughout the next decade.
CAE Inc. (15-17%)
CAE Inc. is a major force in simulation and training, offering cutting-edge VR and mixed-reality systems for military vehicles and aircraft. Their focus on modular simulators allows for quick updates and flexibility across multiple platforms, from tanks to helicopters.
The company’s emphasis on collaborative training environments, where crews operate together in synthetic battlefields, enhances realism and combat readiness. CAE's strong international presence positions it as a preferred partner for defense modernization programs globally.
Northrop Grumman Corporation (10-12%)
Northrop Grumman is leveraging AI and autonomous systems expertise to innovate next-generation military simulation platforms. Their offerings, especially in simulating electronic warfare and unmanned aerial vehicle (UAV) operations, cater to rapidly evolving combat needs
Northrop’s simulators support distributed mission operations (DMO), allowing pilots and ground forces to train together virtually. Continued investments in cybersecurity and digital twin technologies are key pillars of Northrop’s strategy to capture greater market share moving forward.
Saab AB (8-10%)
Saab AB is known for its agile, modular simulation systems tailored to the needs of smaller and mid-sized military forces. Their portable and deployable training environments provide flexibility, enabling rapid adaptation to changing mission profiles.
Saab’s expertise in combining live, virtual, and constructive (LVC) training enhances realism without the logistical complexity of traditional exercises. With growing demand for mobile and cost-effective solutions, Saab is well-positioned for expansion, especially across emerging markets in Asia and Eastern Europe.
Other Key Players (43-49% Combined)
Other players, including Cubic Corporation, Thales Group, and Rheinmetall AG, are actively developing specialized simulations, such as convoy protection training, air-to-air combat drills, and asymmetric warfare scenarios. The combined impact of these companies is significant, driving innovation and diversifying simulation offerings beyond traditional armored and aviation domains. Focus on cyber training modules and unmanned systems simulations is increasing across this broader competitive field, ensuring vibrant market dynamics through 2035.
Table 1: Global Military Vehicles and Aircraft Simulations Market Value (US$ Mn) Forecast by Region, 2017-2032
Table 2: Global Military Vehicles and Aircraft Simulations Market Volume (Units) Forecast by Region, 2017-2032
Table 3: Global Military Vehicles and Aircraft Simulations Market Value (US$ Mn) Forecast by Vehicle Type, 2017-2032
Table 4: Global Military Vehicles and Aircraft Simulations Market Volume (Units) Forecast by Vehicle Type, 2017-2032
Table 5: Global Military Vehicles and Aircraft Simulations Market Value (US$ Mn) Forecast by Simulation Type, 2017-2032
Table 6: Global Military Vehicles and Aircraft Simulations Market Volume (Units) Forecast by Simulation Type, 2017-2032
Table 7: Global Military Vehicles and Aircraft Simulations Market Value (US$ Mn) Forecast by Component, 2017-2032
Table 8: Global Military Vehicles and Aircraft Simulations Market Volume (Units) Forecast by Component, 2017-2032
Table 9: Global Military Vehicles and Aircraft Simulations Market Value (US$ Mn) Forecast by Application, 2017-2032
Table 10: Global Military Vehicles and Aircraft Simulations Market Volume (Units) Forecast by Application, 2017-2032
Table 11: North America Military Vehicles and Aircraft Simulations Market Value (US$ Mn) Forecast by Country, 2017-2032
Table 12: North America Military Vehicles and Aircraft Simulations Market Volume (Units) Forecast by Country, 2017-2032
Table 13: North America Military Vehicles and Aircraft Simulations Market Value (US$ Mn) Forecast by Vehicle Type, 2017-2032
Table 14: North America Military Vehicles and Aircraft Simulations Market Volume (Units) Forecast by Vehicle Type, 2017-2032
Table 15: North America Military Vehicles and Aircraft Simulations Market Value (US$ Mn) Forecast by Simulation Type, 2017-2032
Table 16: North America Military Vehicles and Aircraft Simulations Market Volume (Units) Forecast by Simulation Type, 2017-2032
Table 17: North America Military Vehicles and Aircraft Simulations Market Value (US$ Mn) Forecast by Component, 2017-2032
Table 18: North America Military Vehicles and Aircraft Simulations Market Volume (Units) Forecast by Component, 2017-2032
Table 19: North America Military Vehicles and Aircraft Simulations Market Value (US$ Mn) Forecast by Application, 2017-2032
Table 20: North America Military Vehicles and Aircraft Simulations Market Volume (Units) Forecast by Application, 2017-2032
Table 21: Latin America Military Vehicles and Aircraft Simulations Market Value (US$ Mn) Forecast by Country, 2017-2032
Table 22: Latin America Military Vehicles and Aircraft Simulations Market Volume (Units) Forecast by Country, 2017-2032
Table 23: Latin America Military Vehicles and Aircraft Simulations Market Value (US$ Mn) Forecast by Vehicle Type, 2017-2032
Table 24: Latin America Military Vehicles and Aircraft Simulations Market Volume (Units) Forecast by Vehicle Type, 2017-2032
Table 25: Latin America Military Vehicles and Aircraft Simulations Market Value (US$ Mn) Forecast by Simulation Type, 2017-2032
Table 26: Latin America Military Vehicles and Aircraft Simulations Market Volume (Units) Forecast by Simulation Type, 2017-2032
Table 27: Latin America Military Vehicles and Aircraft Simulations Market Value (US$ Mn) Forecast by Component, 2017-2032
Table 28: Latin America Military Vehicles and Aircraft Simulations Market Volume (Units) Forecast by Component, 2017-2032
Table 29: Latin America Military Vehicles and Aircraft Simulations Market Value (US$ Mn) Forecast by Application, 2017-2032
Table 30: Latin America Military Vehicles and Aircraft Simulations Market Volume (Units) Forecast by Application, 2017-2032
Table 31: Europe Military Vehicles and Aircraft Simulations Market Value (US$ Mn) Forecast by Country, 2017-2032
Table 32: Europe Military Vehicles and Aircraft Simulations Market Volume (Units) Forecast by Country, 2017-2032
Table 33: Europe Military Vehicles and Aircraft Simulations Market Value (US$ Mn) Forecast by Vehicle Type, 2017-2032
Table 34: Europe Military Vehicles and Aircraft Simulations Market Volume (Units) Forecast by Vehicle Type, 2017-2032
Table 35: Europe Military Vehicles and Aircraft Simulations Market Value (US$ Mn) Forecast by Simulation Type, 2017-2032
Table 36: Europe Military Vehicles and Aircraft Simulations Market Volume (Units) Forecast by Simulation Type, 2017-2032
Table 37: Europe Military Vehicles and Aircraft Simulations Market Value (US$ Mn) Forecast by Component, 2017-2032
Table 38: Europe Military Vehicles and Aircraft Simulations Market Volume (Units) Forecast by Component, 2017-2032
Table 39: Europe Military Vehicles and Aircraft Simulations Market Value (US$ Mn) Forecast by Application, 2017-2032
Table 40: Europe Military Vehicles and Aircraft Simulations Market Volume (Units) Forecast by Application, 2017-2032
Table 41: East Asia Military Vehicles and Aircraft Simulations Market Value (US$ Mn) Forecast by Country, 2017-2032
Table 42: East Asia Military Vehicles and Aircraft Simulations Market Volume (Units) Forecast by Country, 2017-2032
Table 43: East Asia Military Vehicles and Aircraft Simulations Market Value (US$ Mn) Forecast by Vehicle Type, 2017-2032
Table 44: East Asia Military Vehicles and Aircraft Simulations Market Volume (Units) Forecast by Vehicle Type, 2017-2032
Table 45: East Asia Military Vehicles and Aircraft Simulations Market Value (US$ Mn) Forecast by Simulation Type, 2017-2032
Table 46: East Asia Military Vehicles and Aircraft Simulations Market Volume (Units) Forecast by Simulation Type, 2017-2032
Table 47: East Asia Military Vehicles and Aircraft Simulations Market Value (US$ Mn) Forecast by Component, 2017-2032
Table 48: East Asia Military Vehicles and Aircraft Simulations Market Volume (Units) Forecast by Component, 2017-2032
Table 49: East Asia Military Vehicles and Aircraft Simulations Market Value (US$ Mn) Forecast by Application, 2017-2032
Table 50: East Asia Military Vehicles and Aircraft Simulations Market Volume (Units) Forecast by Application, 2017-2032
Table 51: South Asia & Pacific Military Vehicles and Aircraft Simulations Market Value (US$ Mn) Forecast by Country, 2017-2032
Table 52: South Asia & Pacific Military Vehicles and Aircraft Simulations Market Volume (Units) Forecast by Country, 2017-2032
Table 53: South Asia & Pacific Military Vehicles and Aircraft Simulations Market Value (US$ Mn) Forecast by Vehicle Type, 2017-2032
Table 54: South Asia & Pacific Military Vehicles and Aircraft Simulations Market Volume (Units) Forecast by Vehicle Type, 2017-2032
Table 55: South Asia & Pacific Military Vehicles and Aircraft Simulations Market Value (US$ Mn) Forecast by Simulation Type, 2017-2032
Table 56: South Asia & Pacific Military Vehicles and Aircraft Simulations Market Volume (Units) Forecast by Simulation Type, 2017-2032
Table 57: South Asia & Pacific Military Vehicles and Aircraft Simulations Market Value (US$ Mn) Forecast by Component, 2017-2032
Table 58: South Asia & Pacific Military Vehicles and Aircraft Simulations Market Volume (Units) Forecast by Component, 2017-2032
Table 59: South Asia & Pacific Military Vehicles and Aircraft Simulations Market Value (US$ Mn) Forecast by Application, 2017-2032
Table 60: South Asia & Pacific Military Vehicles and Aircraft Simulations Market Volume (Units) Forecast by Application, 2017-2032
Table 61: MEA Military Vehicles and Aircraft Simulations Market Value (US$ Mn) Forecast by Country, 2017-2032
Table 62: MEA Military Vehicles and Aircraft Simulations Market Volume (Units) Forecast by Country, 2017-2032
Table 63: MEA Military Vehicles and Aircraft Simulations Market Value (US$ Mn) Forecast by Vehicle Type, 2017-2032
Table 64: MEA Military Vehicles and Aircraft Simulations Market Volume (Units) Forecast by Vehicle Type, 2017-2032
Table 65: MEA Military Vehicles and Aircraft Simulations Market Value (US$ Mn) Forecast by Simulation Type, 2017-2032
Table 66: MEA Military Vehicles and Aircraft Simulations Market Volume (Units) Forecast by Simulation Type, 2017-2032
Table 67: MEA Military Vehicles and Aircraft Simulations Market Value (US$ Mn) Forecast by Component, 2017-2032
Table 68: MEA Military Vehicles and Aircraft Simulations Market Volume (Units) Forecast by Component, 2017-2032
Table 69: MEA Military Vehicles and Aircraft Simulations Market Value (US$ Mn) Forecast by Application, 2017-2032
Table 70: MEA Military Vehicles and Aircraft Simulations Market Volume (Units) Forecast by Application, 2017-2032
Figure 1: Global Military Vehicles and Aircraft Simulations Market Value (US$ Mn) by Vehicle Type, 2022-2032
Figure 2: Global Military Vehicles and Aircraft Simulations Market Value (US$ Mn) by Simulation Type, 2022-2032
Figure 3: Global Military Vehicles and Aircraft Simulations Market Value (US$ Mn) by Component, 2022-2032
Figure 4: Global Military Vehicles and Aircraft Simulations Market Value (US$ Mn) by Application, 2022-2032
Figure 5: Global Military Vehicles and Aircraft Simulations Market Value (US$ Mn) by Region, 2022-2032
Figure 6: Global Military Vehicles and Aircraft Simulations Market Value (US$ Mn) Analysis by Region, 2017-2032
Figure 7: Global Military Vehicles and Aircraft Simulations Market Volume (Units) Analysis by Region, 2017-2032
Figure 8: Global Military Vehicles and Aircraft Simulations Market Value Share (%) and BPS Analysis by Region, 2022-2032
Figure 9: Global Military Vehicles and Aircraft Simulations Market Y-o-Y Growth (%) Projections by Region, 2022-2032
Figure 10: Global Military Vehicles and Aircraft Simulations Market Value (US$ Mn) Analysis by Vehicle Type, 2017-2032
Figure 11: Global Military Vehicles and Aircraft Simulations Market Volume (Units) Analysis by Vehicle Type, 2017-2032
Figure 12: Global Military Vehicles and Aircraft Simulations Market Value Share (%) and BPS Analysis by Vehicle Type, 2022-2032
Figure 13: Global Military Vehicles and Aircraft Simulations Market Y-o-Y Growth (%) Projections by Vehicle Type, 2022-2032
Figure 14: Global Military Vehicles and Aircraft Simulations Market Value (US$ Mn) Analysis by Simulation Type, 2017-2032
Figure 15: Global Military Vehicles and Aircraft Simulations Market Volume (Units) Analysis by Simulation Type, 2017-2032
Figure 16: Global Military Vehicles and Aircraft Simulations Market Value Share (%) and BPS Analysis by Simulation Type, 2022-2032
Figure 17: Global Military Vehicles and Aircraft Simulations Market Y-o-Y Growth (%) Projections by Simulation Type, 2022-2032
Figure 18: Global Military Vehicles and Aircraft Simulations Market Value (US$ Mn) Analysis by Component, 2017-2032
Figure 19: Global Military Vehicles and Aircraft Simulations Market Volume (Units) Analysis by Component, 2017-2032
Figure 20: Global Military Vehicles and Aircraft Simulations Market Value Share (%) and BPS Analysis by Component, 2022-2032
Figure 21: Global Military Vehicles and Aircraft Simulations Market Y-o-Y Growth (%) Projections by Component, 2022-2032
Figure 22: Global Military Vehicles and Aircraft Simulations Market Value (US$ Mn) Analysis by Application, 2017-2032
Figure 23: Global Military Vehicles and Aircraft Simulations Market Volume (Units) Analysis by Application, 2017-2032
Figure 24: Global Military Vehicles and Aircraft Simulations Market Value Share (%) and BPS Analysis by Application, 2022-2032
Figure 25: Global Military Vehicles and Aircraft Simulations Market Y-o-Y Growth (%) Projections by Application, 2022-2032
Figure 26: Global Military Vehicles and Aircraft Simulations Market Attractiveness by Vehicle Type, 2022-2032
Figure 27: Global Military Vehicles and Aircraft Simulations Market Attractiveness by Simulation Type, 2022-2032
Figure 28: Global Military Vehicles and Aircraft Simulations Market Attractiveness by Component, 2022-2032
Figure 29: Global Military Vehicles and Aircraft Simulations Market Attractiveness by Application, 2022-2032
Figure 30: Global Military Vehicles and Aircraft Simulations Market Attractiveness by Region, 2022-2032
Figure 31: North America Military Vehicles and Aircraft Simulations Market Value (US$ Mn) by Vehicle Type, 2022-2032
Figure 32: North America Military Vehicles and Aircraft Simulations Market Value (US$ Mn) by Simulation Type, 2022-2032
Figure 33: North America Military Vehicles and Aircraft Simulations Market Value (US$ Mn) by Component, 2022-2032
Figure 34: North America Military Vehicles and Aircraft Simulations Market Value (US$ Mn) by Application, 2022-2032
Figure 35: North America Military Vehicles and Aircraft Simulations Market Value (US$ Mn) by Country, 2022-2032
Figure 36: North America Military Vehicles and Aircraft Simulations Market Value (US$ Mn) Analysis by Country, 2017-2032
Figure 37: North America Military Vehicles and Aircraft Simulations Market Volume (Units) Analysis by Country, 2017-2032
Figure 38: North America Military Vehicles and Aircraft Simulations Market Value Share (%) and BPS Analysis by Country, 2022-2032
Figure 39: North America Military Vehicles and Aircraft Simulations Market Y-o-Y Growth (%) Projections by Country, 2022-2032
Figure 40: North America Military Vehicles and Aircraft Simulations Market Value (US$ Mn) Analysis by Vehicle Type, 2017-2032
Figure 41: North America Military Vehicles and Aircraft Simulations Market Volume (Units) Analysis by Vehicle Type, 2017-2032
Figure 42: North America Military Vehicles and Aircraft Simulations Market Value Share (%) and BPS Analysis by Vehicle Type, 2022-2032
Figure 43: North America Military Vehicles and Aircraft Simulations Market Y-o-Y Growth (%) Projections by Vehicle Type, 2022-2032
Figure 44: North America Military Vehicles and Aircraft Simulations Market Value (US$ Mn) Analysis by Simulation Type, 2017-2032
Figure 45: North America Military Vehicles and Aircraft Simulations Market Volume (Units) Analysis by Simulation Type, 2017-2032
Figure 46: North America Military Vehicles and Aircraft Simulations Market Value Share (%) and BPS Analysis by Simulation Type, 2022-2032
Figure 47: North America Military Vehicles and Aircraft Simulations Market Y-o-Y Growth (%) Projections by Simulation Type, 2022-2032
Figure 48: North America Military Vehicles and Aircraft Simulations Market Value (US$ Mn) Analysis by Component, 2017-2032
Figure 49: North America Military Vehicles and Aircraft Simulations Market Volume (Units) Analysis by Component, 2017-2032
Figure 50: North America Military Vehicles and Aircraft Simulations Market Value Share (%) and BPS Analysis by Component, 2022-2032
Figure 51: North America Military Vehicles and Aircraft Simulations Market Y-o-Y Growth (%) Projections by Component, 2022-2032
Figure 52: North America Military Vehicles and Aircraft Simulations Market Value (US$ Mn) Analysis by Application, 2017-2032
Figure 53: North America Military Vehicles and Aircraft Simulations Market Volume (Units) Analysis by Application, 2017-2032
Figure 54: North America Military Vehicles and Aircraft Simulations Market Value Share (%) and BPS Analysis by Application, 2022-2032
Figure 55: North America Military Vehicles and Aircraft Simulations Market Y-o-Y Growth (%) Projections by Application, 2022-2032
Figure 56: North America Military Vehicles and Aircraft Simulations Market Attractiveness by Vehicle Type, 2022-2032
Figure 57: North America Military Vehicles and Aircraft Simulations Market Attractiveness by Simulation Type, 2022-2032
Figure 58: North America Military Vehicles and Aircraft Simulations Market Attractiveness by Component, 2022-2032
Figure 59: North America Military Vehicles and Aircraft Simulations Market Attractiveness by Application, 2022-2032
Figure 60: North America Military Vehicles and Aircraft Simulations Market Attractiveness by Country, 2022-2032
Figure 61: Latin America Military Vehicles and Aircraft Simulations Market Value (US$ Mn) by Vehicle Type, 2022-2032
Figure 62: Latin America Military Vehicles and Aircraft Simulations Market Value (US$ Mn) by Simulation Type, 2022-2032
Figure 63: Latin America Military Vehicles and Aircraft Simulations Market Value (US$ Mn) by Component, 2022-2032
Figure 64: Latin America Military Vehicles and Aircraft Simulations Market Value (US$ Mn) by Application, 2022-2032
Figure 65: Latin America Military Vehicles and Aircraft Simulations Market Value (US$ Mn) by Country, 2022-2032
Figure 66: Latin America Military Vehicles and Aircraft Simulations Market Value (US$ Mn) Analysis by Country, 2017-2032
Figure 67: Latin America Military Vehicles and Aircraft Simulations Market Volume (Units) Analysis by Country, 2017-2032
Figure 68: Latin America Military Vehicles and Aircraft Simulations Market Value Share (%) and BPS Analysis by Country, 2022-2032
Figure 69: Latin America Military Vehicles and Aircraft Simulations Market Y-o-Y Growth (%) Projections by Country, 2022-2032
Figure 70: Latin America Military Vehicles and Aircraft Simulations Market Value (US$ Mn) Analysis by Vehicle Type, 2017-2032
Figure 71: Latin America Military Vehicles and Aircraft Simulations Market Volume (Units) Analysis by Vehicle Type, 2017-2032
Figure 72: Latin America Military Vehicles and Aircraft Simulations Market Value Share (%) and BPS Analysis by Vehicle Type, 2022-2032
Figure 73: Latin America Military Vehicles and Aircraft Simulations Market Y-o-Y Growth (%) Projections by Vehicle Type, 2022-2032
Figure 74: Latin America Military Vehicles and Aircraft Simulations Market Value (US$ Mn) Analysis by Simulation Type, 2017-2032
Figure 75: Latin America Military Vehicles and Aircraft Simulations Market Volume (Units) Analysis by Simulation Type, 2017-2032
Figure 76: Latin America Military Vehicles and Aircraft Simulations Market Value Share (%) and BPS Analysis by Simulation Type, 2022-2032
Figure 77: Latin America Military Vehicles and Aircraft Simulations Market Y-o-Y Growth (%) Projections by Simulation Type, 2022-2032
Figure 78: Latin America Military Vehicles and Aircraft Simulations Market Value (US$ Mn) Analysis by Component, 2017-2032
Figure 79: Latin America Military Vehicles and Aircraft Simulations Market Volume (Units) Analysis by Component, 2017-2032
Figure 80: Latin America Military Vehicles and Aircraft Simulations Market Value Share (%) and BPS Analysis by Component, 2022-2032
Figure 81: Latin America Military Vehicles and Aircraft Simulations Market Y-o-Y Growth (%) Projections by Component, 2022-2032
Figure 82: Latin America Military Vehicles and Aircraft Simulations Market Value (US$ Mn) Analysis by Application, 2017-2032
Figure 83: Latin America Military Vehicles and Aircraft Simulations Market Volume (Units) Analysis by Application, 2017-2032
Figure 84: Latin America Military Vehicles and Aircraft Simulations Market Value Share (%) and BPS Analysis by Application, 2022-2032
Figure 85: Latin America Military Vehicles and Aircraft Simulations Market Y-o-Y Growth (%) Projections by Application, 2022-2032
Figure 86: Latin America Military Vehicles and Aircraft Simulations Market Attractiveness by Vehicle Type, 2022-2032
Figure 87: Latin America Military Vehicles and Aircraft Simulations Market Attractiveness by Simulation Type, 2022-2032
Figure 88: Latin America Military Vehicles and Aircraft Simulations Market Attractiveness by Component, 2022-2032
Figure 89: Latin America Military Vehicles and Aircraft Simulations Market Attractiveness by Application, 2022-2032
Figure 90: Latin America Military Vehicles and Aircraft Simulations Market Attractiveness by Country, 2022-2032
Figure 91: Europe Military Vehicles and Aircraft Simulations Market Value (US$ Mn) by Vehicle Type, 2022-2032
Figure 92: Europe Military Vehicles and Aircraft Simulations Market Value (US$ Mn) by Simulation Type, 2022-2032
Figure 93: Europe Military Vehicles and Aircraft Simulations Market Value (US$ Mn) by Component, 2022-2032
Figure 94: Europe Military Vehicles and Aircraft Simulations Market Value (US$ Mn) by Application, 2022-2032
Figure 95: Europe Military Vehicles and Aircraft Simulations Market Value (US$ Mn) by Country, 2022-2032
Figure 96: Europe Military Vehicles and Aircraft Simulations Market Value (US$ Mn) Analysis by Country, 2017-2032
Figure 97: Europe Military Vehicles and Aircraft Simulations Market Volume (Units) Analysis by Country, 2017-2032
Figure 98: Europe Military Vehicles and Aircraft Simulations Market Value Share (%) and BPS Analysis by Country, 2022-2032
Figure 99: Europe Military Vehicles and Aircraft Simulations Market Y-o-Y Growth (%) Projections by Country, 2022-2032
Figure 100: Europe Military Vehicles and Aircraft Simulations Market Value (US$ Mn) Analysis by Vehicle Type, 2017-2032
Figure 101: Europe Military Vehicles and Aircraft Simulations Market Volume (Units) Analysis by Vehicle Type, 2017-2032
Figure 102: Europe Military Vehicles and Aircraft Simulations Market Value Share (%) and BPS Analysis by Vehicle Type, 2022-2032
Figure 103: Europe Military Vehicles and Aircraft Simulations Market Y-o-Y Growth (%) Projections by Vehicle Type, 2022-2032
Figure 104: Europe Military Vehicles and Aircraft Simulations Market Value (US$ Mn) Analysis by Simulation Type, 2017-2032
Figure 105: Europe Military Vehicles and Aircraft Simulations Market Volume (Units) Analysis by Simulation Type, 2017-2032
Figure 106: Europe Military Vehicles and Aircraft Simulations Market Value Share (%) and BPS Analysis by Simulation Type, 2022-2032
Figure 107: Europe Military Vehicles and Aircraft Simulations Market Y-o-Y Growth (%) Projections by Simulation Type, 2022-2032
Figure 108: Europe Military Vehicles and Aircraft Simulations Market Value (US$ Mn) Analysis by Component, 2017-2032
Figure 109: Europe Military Vehicles and Aircraft Simulations Market Volume (Units) Analysis by Component, 2017-2032
Figure 110: Europe Military Vehicles and Aircraft Simulations Market Value Share (%) and BPS Analysis by Component, 2022-2032
Figure 111: Europe Military Vehicles and Aircraft Simulations Market Y-o-Y Growth (%) Projections by Component, 2022-2032
Figure 112: Europe Military Vehicles and Aircraft Simulations Market Value (US$ Mn) Analysis by Application, 2017-2032
Figure 113: Europe Military Vehicles and Aircraft Simulations Market Volume (Units) Analysis by Application, 2017-2032
Figure 114: Europe Military Vehicles and Aircraft Simulations Market Value Share (%) and BPS Analysis by Application, 2022-2032
Figure 115: Europe Military Vehicles and Aircraft Simulations Market Y-o-Y Growth (%) Projections by Application, 2022-2032
Figure 116: Europe Military Vehicles and Aircraft Simulations Market Attractiveness by Vehicle Type, 2022-2032
Figure 117: Europe Military Vehicles and Aircraft Simulations Market Attractiveness by Simulation Type, 2022-2032
Figure 118: Europe Military Vehicles and Aircraft Simulations Market Attractiveness by Component, 2022-2032
Figure 119: Europe Military Vehicles and Aircraft Simulations Market Attractiveness by Application, 2022-2032
Figure 120: Europe Military Vehicles and Aircraft Simulations Market Attractiveness by Country, 2022-2032
Figure 121: East Asia Military Vehicles and Aircraft Simulations Market Value (US$ Mn) by Vehicle Type, 2022-2032
Figure 122: East Asia Military Vehicles and Aircraft Simulations Market Value (US$ Mn) by Simulation Type, 2022-2032
Figure 123: East Asia Military Vehicles and Aircraft Simulations Market Value (US$ Mn) by Component, 2022-2032
Figure 124: East Asia Military Vehicles and Aircraft Simulations Market Value (US$ Mn) by Application, 2022-2032
Figure 125: East Asia Military Vehicles and Aircraft Simulations Market Value (US$ Mn) by Country, 2022-2032
Figure 126: East Asia Military Vehicles and Aircraft Simulations Market Value (US$ Mn) Analysis by Country, 2017-2032
Figure 127: East Asia Military Vehicles and Aircraft Simulations Market Volume (Units) Analysis by Country, 2017-2032
Figure 128: East Asia Military Vehicles and Aircraft Simulations Market Value Share (%) and BPS Analysis by Country, 2022-2032
Figure 129: East Asia Military Vehicles and Aircraft Simulations Market Y-o-Y Growth (%) Projections by Country, 2022-2032
Figure 130: East Asia Military Vehicles and Aircraft Simulations Market Value (US$ Mn) Analysis by Vehicle Type, 2017-2032
Figure 131: East Asia Military Vehicles and Aircraft Simulations Market Volume (Units) Analysis by Vehicle Type, 2017-2032
Figure 132: East Asia Military Vehicles and Aircraft Simulations Market Value Share (%) and BPS Analysis by Vehicle Type, 2022-2032
Figure 133: East Asia Military Vehicles and Aircraft Simulations Market Y-o-Y Growth (%) Projections by Vehicle Type, 2022-2032
Figure 134: East Asia Military Vehicles and Aircraft Simulations Market Value (US$ Mn) Analysis by Simulation Type, 2017-2032
Figure 135: East Asia Military Vehicles and Aircraft Simulations Market Volume (Units) Analysis by Simulation Type, 2017-2032
Figure 136: East Asia Military Vehicles and Aircraft Simulations Market Value Share (%) and BPS Analysis by Simulation Type, 2022-2032
Figure 137: East Asia Military Vehicles and Aircraft Simulations Market Y-o-Y Growth (%) Projections by Simulation Type, 2022-2032
Figure 138: East Asia Military Vehicles and Aircraft Simulations Market Value (US$ Mn) Analysis by Component, 2017-2032
Figure 139: East Asia Military Vehicles and Aircraft Simulations Market Volume (Units) Analysis by Component, 2017-2032
Figure 140: East Asia Military Vehicles and Aircraft Simulations Market Value Share (%) and BPS Analysis by Component, 2022-2032
Figure 141: East Asia Military Vehicles and Aircraft Simulations Market Y-o-Y Growth (%) Projections by Component, 2022-2032
Figure 142: East Asia Military Vehicles and Aircraft Simulations Market Value (US$ Mn) Analysis by Application, 2017-2032
Figure 143: East Asia Military Vehicles and Aircraft Simulations Market Volume (Units) Analysis by Application, 2017-2032
Figure 144: East Asia Military Vehicles and Aircraft Simulations Market Value Share (%) and BPS Analysis by Application, 2022-2032
Figure 145: East Asia Military Vehicles and Aircraft Simulations Market Y-o-Y Growth (%) Projections by Application, 2022-2032
Figure 146: East Asia Military Vehicles and Aircraft Simulations Market Attractiveness by Vehicle Type, 2022-2032
Figure 147: East Asia Military Vehicles and Aircraft Simulations Market Attractiveness by Simulation Type, 2022-2032
Figure 148: East Asia Military Vehicles and Aircraft Simulations Market Attractiveness by Component, 2022-2032
Figure 149: East Asia Military Vehicles and Aircraft Simulations Market Attractiveness by Application, 2022-2032
Figure 150: East Asia Military Vehicles and Aircraft Simulations Market Attractiveness by Country, 2022-2032
Figure 151: South Asia & Pacific Military Vehicles and Aircraft Simulations Market Value (US$ Mn) by Vehicle Type, 2022-2032
Figure 152: South Asia & Pacific Military Vehicles and Aircraft Simulations Market Value (US$ Mn) by Simulation Type, 2022-2032
Figure 153: South Asia & Pacific Military Vehicles and Aircraft Simulations Market Value (US$ Mn) by Component, 2022-2032
Figure 154: South Asia & Pacific Military Vehicles and Aircraft Simulations Market Value (US$ Mn) by Application, 2022-2032
Figure 155: South Asia & Pacific Military Vehicles and Aircraft Simulations Market Value (US$ Mn) by Country, 2022-2032
Figure 156: South Asia & Pacific Military Vehicles and Aircraft Simulations Market Value (US$ Mn) Analysis by Country, 2017-2032
Figure 157: South Asia & Pacific Military Vehicles and Aircraft Simulations Market Volume (Units) Analysis by Country, 2017-2032
Figure 158: South Asia & Pacific Military Vehicles and Aircraft Simulations Market Value Share (%) and BPS Analysis by Country, 2022-2032
Figure 159: South Asia & Pacific Military Vehicles and Aircraft Simulations Market Y-o-Y Growth (%) Projections by Country, 2022-2032
Figure 160: South Asia & Pacific Military Vehicles and Aircraft Simulations Market Value (US$ Mn) Analysis by Vehicle Type, 2017-2032
Figure 161: South Asia & Pacific Military Vehicles and Aircraft Simulations Market Volume (Units) Analysis by Vehicle Type, 2017-2032
Figure 162: South Asia & Pacific Military Vehicles and Aircraft Simulations Market Value Share (%) and BPS Analysis by Vehicle Type, 2022-2032
Figure 163: South Asia & Pacific Military Vehicles and Aircraft Simulations Market Y-o-Y Growth (%) Projections by Vehicle Type, 2022-2032
Figure 164: South Asia & Pacific Military Vehicles and Aircraft Simulations Market Value (US$ Mn) Analysis by Simulation Type, 2017-2032
Figure 165: South Asia & Pacific Military Vehicles and Aircraft Simulations Market Volume (Units) Analysis by Simulation Type, 2017-2032
Figure 166: South Asia & Pacific Military Vehicles and Aircraft Simulations Market Value Share (%) and BPS Analysis by Simulation Type, 2022-2032
Figure 167: South Asia & Pacific Military Vehicles and Aircraft Simulations Market Y-o-Y Growth (%) Projections by Simulation Type, 2022-2032
Figure 168: South Asia & Pacific Military Vehicles and Aircraft Simulations Market Value (US$ Mn) Analysis by Component, 2017-2032
Figure 169: South Asia & Pacific Military Vehicles and Aircraft Simulations Market Volume (Units) Analysis by Component, 2017-2032
Figure 170: South Asia & Pacific Military Vehicles and Aircraft Simulations Market Value Share (%) and BPS Analysis by Component, 2022-2032
Figure 171: South Asia & Pacific Military Vehicles and Aircraft Simulations Market Y-o-Y Growth (%) Projections by Component, 2022-2032
Figure 172: South Asia & Pacific Military Vehicles and Aircraft Simulations Market Value (US$ Mn) Analysis by Application, 2017-2032
Figure 173: South Asia & Pacific Military Vehicles and Aircraft Simulations Market Volume (Units) Analysis by Application, 2017-2032
Figure 174: South Asia & Pacific Military Vehicles and Aircraft Simulations Market Value Share (%) and BPS Analysis by Application, 2022-2032
Figure 175: South Asia & Pacific Military Vehicles and Aircraft Simulations Market Y-o-Y Growth (%) Projections by Application, 2022-2032
Figure 176: South Asia & Pacific Military Vehicles and Aircraft Simulations Market Attractiveness by Vehicle Type, 2022-2032
Figure 177: South Asia & Pacific Military Vehicles and Aircraft Simulations Market Attractiveness by Simulation Type, 2022-2032
Figure 178: South Asia & Pacific Military Vehicles and Aircraft Simulations Market Attractiveness by Component, 2022-2032
Figure 179: South Asia & Pacific Military Vehicles and Aircraft Simulations Market Attractiveness by Application, 2022-2032
Figure 180: South Asia & Pacific Military Vehicles and Aircraft Simulations Market Attractiveness by Country, 2022-2032
Figure 181: MEA Military Vehicles and Aircraft Simulations Market Value (US$ Mn) by Vehicle Type, 2022-2032
Figure 182: MEA Military Vehicles and Aircraft Simulations Market Value (US$ Mn) by Simulation Type, 2022-2032
Figure 183: MEA Military Vehicles and Aircraft Simulations Market Value (US$ Mn) by Component, 2022-2032
Figure 184: MEA Military Vehicles and Aircraft Simulations Market Value (US$ Mn) by Application, 2022-2032
Figure 185: MEA Military Vehicles and Aircraft Simulations Market Value (US$ Mn) by Country, 2022-2032
Figure 186: MEA Military Vehicles and Aircraft Simulations Market Value (US$ Mn) Analysis by Country, 2017-2032
Figure 187: MEA Military Vehicles and Aircraft Simulations Market Volume (Units) Analysis by Country, 2017-2032
Figure 188: MEA Military Vehicles and Aircraft Simulations Market Value Share (%) and BPS Analysis by Country, 2022-2032
Figure 189: MEA Military Vehicles and Aircraft Simulations Market Y-o-Y Growth (%) Projections by Country, 2022-2032
Figure 190: MEA Military Vehicles and Aircraft Simulations Market Value (US$ Mn) Analysis by Vehicle Type, 2017-2032
Figure 191: MEA Military Vehicles and Aircraft Simulations Market Volume (Units) Analysis by Vehicle Type, 2017-2032
Figure 192: MEA Military Vehicles and Aircraft Simulations Market Value Share (%) and BPS Analysis by Vehicle Type, 2022-2032
Figure 193: MEA Military Vehicles and Aircraft Simulations Market Y-o-Y Growth (%) Projections by Vehicle Type, 2022-2032
Figure 194: MEA Military Vehicles and Aircraft Simulations Market Value (US$ Mn) Analysis by Simulation Type, 2017-2032
Figure 195: MEA Military Vehicles and Aircraft Simulations Market Volume (Units) Analysis by Simulation Type, 2017-2032
Figure 196: MEA Military Vehicles and Aircraft Simulations Market Value Share (%) and BPS Analysis by Simulation Type, 2022-2032
Figure 197: MEA Military Vehicles and Aircraft Simulations Market Y-o-Y Growth (%) Projections by Simulation Type, 2022-2032
Figure 198: MEA Military Vehicles and Aircraft Simulations Market Value (US$ Mn) Analysis by Component, 2017-2032
Figure 199: MEA Military Vehicles and Aircraft Simulations Market Volume (Units) Analysis by Component, 2017-2032
Figure 200: MEA Military Vehicles and Aircraft Simulations Market Value Share (%) and BPS Analysis by Component, 2022-2032
Figure 201: MEA Military Vehicles and Aircraft Simulations Market Y-o-Y Growth (%) Projections by Component, 2022-2032
Figure 202: MEA Military Vehicles and Aircraft Simulations Market Value (US$ Mn) Analysis by Application, 2017-2032
Figure 203: MEA Military Vehicles and Aircraft Simulations Market Volume (Units) Analysis by Application, 2017-2032
Figure 204: MEA Military Vehicles and Aircraft Simulations Market Value Share (%) and BPS Analysis by Application, 2022-2032
Figure 205: MEA Military Vehicles and Aircraft Simulations Market Y-o-Y Growth (%) Projections by Application, 2022-2032
Figure 206: MEA Military Vehicles and Aircraft Simulations Market Attractiveness by Vehicle Type, 2022-2032
Figure 207: MEA Military Vehicles and Aircraft Simulations Market Attractiveness by Simulation Type, 2022-2032
Figure 208: MEA Military Vehicles and Aircraft Simulations Market Attractiveness by Component, 2022-2032
Figure 209: MEA Military Vehicles and Aircraft Simulations Market Attractiveness by Application, 2022-2032
Figure 210: MEA Military Vehicles and Aircraft Simulations Market Attractiveness by Country, 2022-2032
The overall market size for military vehicles and aircraft simulations market was USD 6,767.5 million in 2025.
The military vehicles and aircraft simulations market expected to reach USD 13,188.9 million in 2035.
Increased defense budgets, rising need for cost-effective training, technological advancements, and geopolitical tensions will drive military vehicles and aircraft simulations market demand during the forecast period.
The top 5 countries which drives the development of cargo bike tire marketare USA, UK, Europe Union, Japan and South Korea.
Platform application segment driving market growth to command significant share over the assessment period.
Explore Similar Insights
Thank you!
You will receive an email from our Business Development Manager. Please be sure to check your SPAM/JUNK folder too.